Gene Page: HS6ST1
Summary ?
| GeneID | 9394 |
| Symbol | HS6ST1 |
| Synonyms | HH15|HS6ST |
| Description | heparan sulfate 6-O-sulfotransferase 1 |
| Reference | MIM:604846|HGNC:HGNC:5201|Ensembl:ENSG00000136720|HPRD:07274|Vega:OTTHUMG00000153542 |
| Gene type | protein-coding |
| Map location | 2q21 |
| Pascal p-value | 0.755 |
| Fetal beta | -0.53 |
| DMG | 3 (# studies) |
| eGene | Meta |
| Support | Ascano FMRP targets |
Gene in Data Sources
| Gene set name | Method of gene set | Description | Info |
|---|---|---|---|
| CV:PGCnp | Genome-wide Association Study | GWAS | |
| DMG:Jaffe_2016 | Genome-wide DNA methylation analysis | This dataset includes 2,104 probes/CpGs associated with SZ patients (n=108) compared to 136 controls at Bonferroni-adjusted P < 0.05. | 3 |
| DMG:Montano_2016 | Genome-wide DNA methylation analysis | This dataset includes 172 replicated associations between CpGs with schizophrenia. | 3 |
| DMG:Wockner_2014 | Genome-wide DNA methylation analysis | This dataset includes 4641 differentially methylated probes corresponding to 2929 unique genes between schizophrenia patients (n=24) and controls (n=24). | 3 |
| GSMA_I | Genome scan meta-analysis | Psr: 0.023 | |
| GSMA_IIA | Genome scan meta-analysis (All samples) | Psr: 0.00755 |
Section I. Genetics and epigenetics annotation
 Differentially methylated gene
| Probe | Chromosome | Position | Nearest gene | P (dis) | Beta (dis) | FDR (dis) | Study |
|---|---|---|---|---|---|---|---|
| cg01765406 | 2 | 129231478 | HS6ST1 | 3.35E-5 | -0.007 | 0.077 | DMG:Montano_2016 |
| cg08472795 | 2 | 129067253 | HS6ST1 | 1.09E-4 | -0.589 | 0.028 | DMG:Wockner_2014 |
| cg12995162 | 2 | 129079641 | HS6ST1 | 3.09E-9 | -0.019 | 2.1E-6 | DMG:Jaffe_2016 |
Section II. Transcriptome annotation
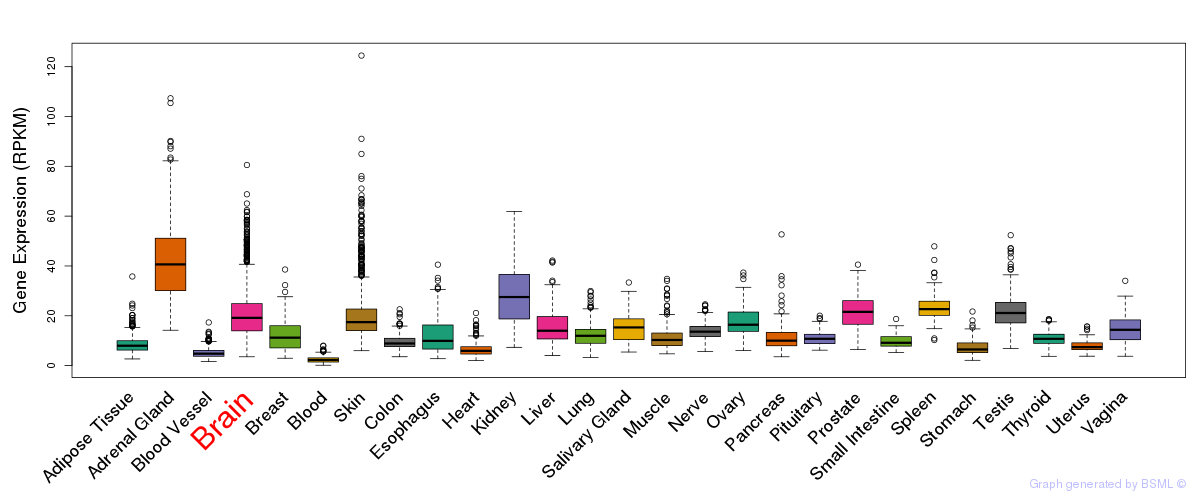
General gene expression (GTEx)
Gene expression during devlopment (BrainCloud)
Footnote:
A total of 269 time points ploted, with n=38 fetal samples (x=1:38). Each triangle represents one time point.
Gene expression of temporal and spatial changes (BrainSpan)
Footnote:
SC: sub-cortical regions; SM: sensory-motor regions; FC: frontal cortex; and TP: temporal-parietal cortex
ST1: fetal (13 - 26 postconception weeks), ST2: early infancy to late childhood (4 months to 11 years), and ST3: adolescence to adulthood (13 - 23 years)
The bar shown representes the lower 25% and upper 25% of the expression distribution.
Top co-expressed genes in brain regions
| Top 10 positively co-expressed genes | ||
| Gene | Pearson's Correlation | Spearman's Correlation |
| LST1 | 0.78 | 0.74 |
| VAMP8 | 0.78 | 0.78 |
| VAMP5 | 0.75 | 0.75 |
| IFI27L2 | 0.74 | 0.71 |
| CD63 | 0.73 | 0.69 |
| RP11-884K10.1 | 0.73 | 0.67 |
| LY96 | 0.73 | 0.75 |
| MTCP1NB | 0.71 | 0.63 |
| C1orf54 | 0.71 | 0.76 |
| AL050337.1 | 0.70 | 0.64 |
| Top 10 negatively co-expressed genes | ||
| Gene | Pearson's Correlation | Spearman's Correlation |
| SUPT6H | -0.65 | -0.71 |
| MYO18A | -0.65 | -0.69 |
| SMG6 | -0.64 | -0.72 |
| MACF1 | -0.64 | -0.75 |
| GON4L | -0.63 | -0.73 |
| ANKRD17 | -0.63 | -0.70 |
| HERC2 | -0.62 | -0.69 |
| INO80 | -0.62 | -0.71 |
| TCOF1 | -0.62 | -0.70 |
| KDM2A | -0.62 | -0.71 |
Section III. Gene Ontology annotation
| Molecular function | GO term | Evidence | Neuro keywords | PubMed ID |
|---|---|---|---|---|
| GO:0016740 | transferase activity | IEA | - | |
| GO:0008146 | sulfotransferase activity | TAS | 9535912 | |
| Biological process | GO term | Evidence | Neuro keywords | PubMed ID |
| GO:0015015 | heparan sulfate proteoglycan biosynthetic process, enzymatic modification | TAS | 9535912 | |
| Cellular component | GO term | Evidence | Neuro keywords | PubMed ID |
| GO:0016020 | membrane | IEA | - | |
| GO:0005887 | integral to plasma membrane | TAS | 9535912 |
Section V. Pathway annotation
| Pathway name | Pathway size | # SZGR 2.0 genes in pathway | Info |
|---|---|---|---|
| KEGG GLYCOSAMINOGLYCAN BIOSYNTHESIS HEPARAN SULFATE | 26 | 16 | All SZGR 2.0 genes in this pathway |
| REACTOME HS GAG BIOSYNTHESIS | 31 | 17 | All SZGR 2.0 genes in this pathway |
| REACTOME HEPARAN SULFATE HEPARIN HS GAG METABOLISM | 52 | 33 | All SZGR 2.0 genes in this pathway |
| REACTOME GLYCOSAMINOGLYCAN METABOLISM | 111 | 69 | All SZGR 2.0 genes in this pathway |
| REACTOME METABOLISM OF CARBOHYDRATES | 247 | 154 | All SZGR 2.0 genes in this pathway |
| GARGALOVIC RESPONSE TO OXIDIZED PHOSPHOLIPIDS TURQUOISE UP | 79 | 50 | All SZGR 2.0 genes in this pathway |
| KINSEY TARGETS OF EWSR1 FLII FUSION UP | 1278 | 748 | All SZGR 2.0 genes in this pathway |
| GRAESSMANN APOPTOSIS BY DOXORUBICIN UP | 1142 | 669 | All SZGR 2.0 genes in this pathway |
| GRAESSMANN RESPONSE TO MC AND DOXORUBICIN UP | 612 | 367 | All SZGR 2.0 genes in this pathway |
| PEREZ TP53 TARGETS | 1174 | 695 | All SZGR 2.0 genes in this pathway |
| PEREZ TP63 TARGETS | 355 | 243 | All SZGR 2.0 genes in this pathway |
| PEREZ TP53 AND TP63 TARGETS | 205 | 145 | All SZGR 2.0 genes in this pathway |
| PENG GLUTAMINE DEPRIVATION DN | 337 | 230 | All SZGR 2.0 genes in this pathway |
| COATES MACROPHAGE M1 VS M2 DN | 78 | 44 | All SZGR 2.0 genes in this pathway |
| RIGGI EWING SARCOMA PROGENITOR UP | 430 | 288 | All SZGR 2.0 genes in this pathway |
| WANG TUMOR INVASIVENESS UP | 374 | 247 | All SZGR 2.0 genes in this pathway |
| KYNG WERNER SYNDROM AND NORMAL AGING DN | 225 | 124 | All SZGR 2.0 genes in this pathway |
| CHANDRAN METASTASIS UP | 221 | 135 | All SZGR 2.0 genes in this pathway |
| PURBEY TARGETS OF CTBP1 NOT SATB1 DN | 448 | 282 | All SZGR 2.0 genes in this pathway |
| PEDRIOLI MIR31 TARGETS UP | 221 | 120 | All SZGR 2.0 genes in this pathway |