Gene Page: PIGS
Summary ?
| GeneID | 94005 |
| Symbol | PIGS |
| Synonyms | - |
| Description | phosphatidylinositol glycan anchor biosynthesis class S |
| Reference | MIM:610271|HGNC:HGNC:14937|Ensembl:ENSG00000087111|HPRD:15135|Vega:OTTHUMG00000132604 |
| Gene type | protein-coding |
| Map location | 17p13.2 |
| Pascal p-value | 0.529 |
| Sherlock p-value | 0.895 |
| Fetal beta | -0.379 |
| eGene | Myers' cis & trans |
Gene in Data Sources
| Gene set name | Method of gene set | Description | Info |
|---|---|---|---|
| PMID:cooccur | High-throughput literature-search | Systematic search in PubMed for genes co-occurring with SCZ keywords. A total of 3027 genes were included. | |
| Literature | High-throughput literature-search | Co-occurance with Schizophrenia keywords: schizophrenia,schizophrenic,schizophrenics,schizophrenias | Click to show details |
Section I. Genetics and epigenetics annotation
 eQTL annotation
| SNP ID | Chromosome | Position | eGene | Gene Entrez ID | pvalue | qvalue | TSS distance | eQTL type |
|---|---|---|---|---|---|---|---|---|
| rs10521963 | chrX | 31174993 | PIGS | 94005 | 0.02 | trans |
Section II. Transcriptome annotation
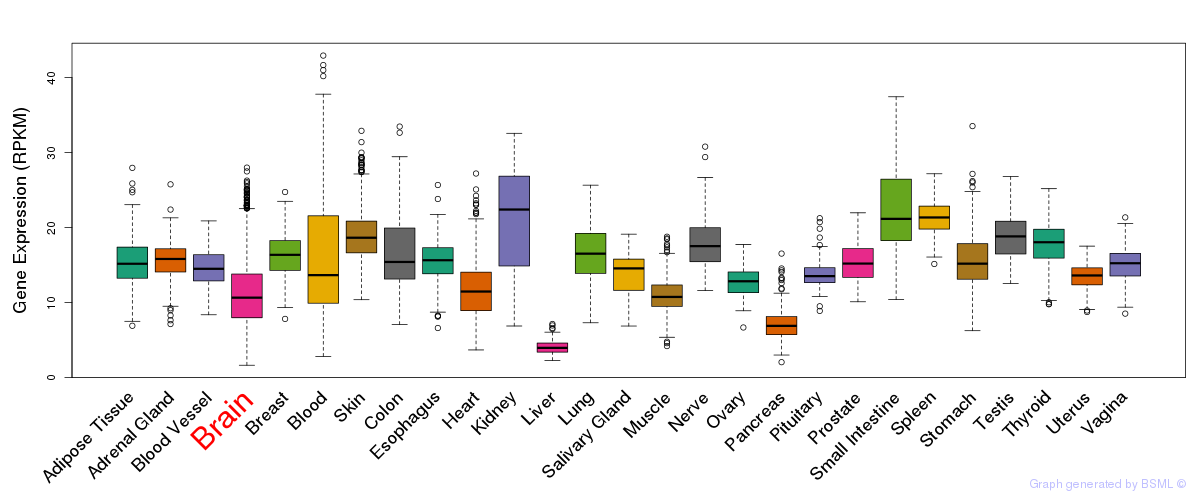
General gene expression (GTEx)
Gene expression during devlopment (BrainCloud)
Footnote:
A total of 269 time points ploted, with n=38 fetal samples (x=1:38). Each triangle represents one time point.
Gene expression of temporal and spatial changes (BrainSpan)
Footnote:
SC: sub-cortical regions; SM: sensory-motor regions; FC: frontal cortex; and TP: temporal-parietal cortex
ST1: fetal (13 - 26 postconception weeks), ST2: early infancy to late childhood (4 months to 11 years), and ST3: adolescence to adulthood (13 - 23 years)
The bar shown representes the lower 25% and upper 25% of the expression distribution.
Top co-expressed genes in brain regions
| Top 10 positively co-expressed genes | ||
| Gene | Pearson's Correlation | Spearman's Correlation |
| ZFP62 | 0.85 | 0.82 |
| C2CD3 | 0.84 | 0.83 |
| SECISBP2 | 0.84 | 0.83 |
| PHF21A | 0.84 | 0.81 |
| KIAA1267 | 0.84 | 0.83 |
| ALMS1 | 0.84 | 0.78 |
| IGF2BP2 | 0.84 | 0.68 |
| DDX17 | 0.84 | 0.83 |
| MED12 | 0.83 | 0.78 |
| C4orf8 | 0.83 | 0.81 |
| Top 10 negatively co-expressed genes | ||
| Gene | Pearson's Correlation | Spearman's Correlation |
| AF347015.31 | -0.63 | -0.76 |
| AF347015.27 | -0.62 | -0.75 |
| AIFM3 | -0.61 | -0.70 |
| C5orf53 | -0.61 | -0.68 |
| IFI27 | -0.61 | -0.77 |
| MT-CO2 | -0.61 | -0.74 |
| FXYD1 | -0.60 | -0.75 |
| HLA-F | -0.60 | -0.65 |
| AF347015.33 | -0.60 | -0.72 |
| S100B | -0.59 | -0.72 |
Section V. Pathway annotation
| Pathway name | Pathway size | # SZGR 2.0 genes in pathway | Info |
|---|---|---|---|
| KEGG GLYCOSYLPHOSPHATIDYLINOSITOL GPI ANCHOR BIOSYNTHESIS | 25 | 17 | All SZGR 2.0 genes in this pathway |
| REACTOME METABOLISM OF PROTEINS | 518 | 242 | All SZGR 2.0 genes in this pathway |
| REACTOME POST TRANSLATIONAL MODIFICATION SYNTHESIS OF GPI ANCHORED PROTEINS | 26 | 19 | All SZGR 2.0 genes in this pathway |
| REACTOME POST TRANSLATIONAL PROTEIN MODIFICATION | 188 | 116 | All SZGR 2.0 genes in this pathway |
| FERREIRA EWINGS SARCOMA UNSTABLE VS STABLE UP | 167 | 92 | All SZGR 2.0 genes in this pathway |
| NIKOLSKY BREAST CANCER 17Q11 Q21 AMPLICON | 133 | 78 | All SZGR 2.0 genes in this pathway |
| NIKOLSKY MUTATED AND AMPLIFIED IN BREAST CANCER | 94 | 60 | All SZGR 2.0 genes in this pathway |
| WONG IFNA2 RESISTANCE DN | 34 | 20 | All SZGR 2.0 genes in this pathway |
| DOUGLAS BMI1 TARGETS DN | 314 | 188 | All SZGR 2.0 genes in this pathway |
| MILI PSEUDOPODIA HAPTOTAXIS DN | 668 | 419 | All SZGR 2.0 genes in this pathway |