Gene Page: ORMDL3
Summary ?
| GeneID | 94103 |
| Symbol | ORMDL3 |
| Synonyms | - |
| Description | ORMDL sphingolipid biosynthesis regulator 3 |
| Reference | MIM:610075|HGNC:HGNC:16038|Ensembl:ENSG00000172057|HPRD:17803|Vega:OTTHUMG00000133249 |
| Gene type | protein-coding |
| Map location | 17q12 |
| Pascal p-value | 0.044 |
| Sherlock p-value | 0.002 |
| Fetal beta | -0.01 |
| DMG | 2 (# studies) |
| eGene | Caudate basal ganglia |
Gene in Data Sources
| Gene set name | Method of gene set | Description | Info |
|---|---|---|---|
| CV:PGCnp | Genome-wide Association Study | GWAS | |
| DMG:Jaffe_2016 | Genome-wide DNA methylation analysis | This dataset includes 2,104 probes/CpGs associated with SZ patients (n=108) compared to 136 controls at Bonferroni-adjusted P < 0.05. | 2 |
| DMG:Wockner_2014 | Genome-wide DNA methylation analysis | This dataset includes 4641 differentially methylated probes corresponding to 2929 unique genes between schizophrenia patients (n=24) and controls (n=24). | 2 |
Section I. Genetics and epigenetics annotation
 Differentially methylated gene
| Probe | Chromosome | Position | Nearest gene | P (dis) | Beta (dis) | FDR (dis) | Study |
|---|---|---|---|---|---|---|---|
| cg04308185 | 17 | 38084377 | ORMDL3 | 2.909E-4 | -0.531 | 0.039 | DMG:Wockner_2014 |
| cg09155575 | 17 | 38084037 | ORMDL3 | 7.13E-9 | -0.01 | 3.59E-6 | DMG:Jaffe_2016 |
Section II. Transcriptome annotation
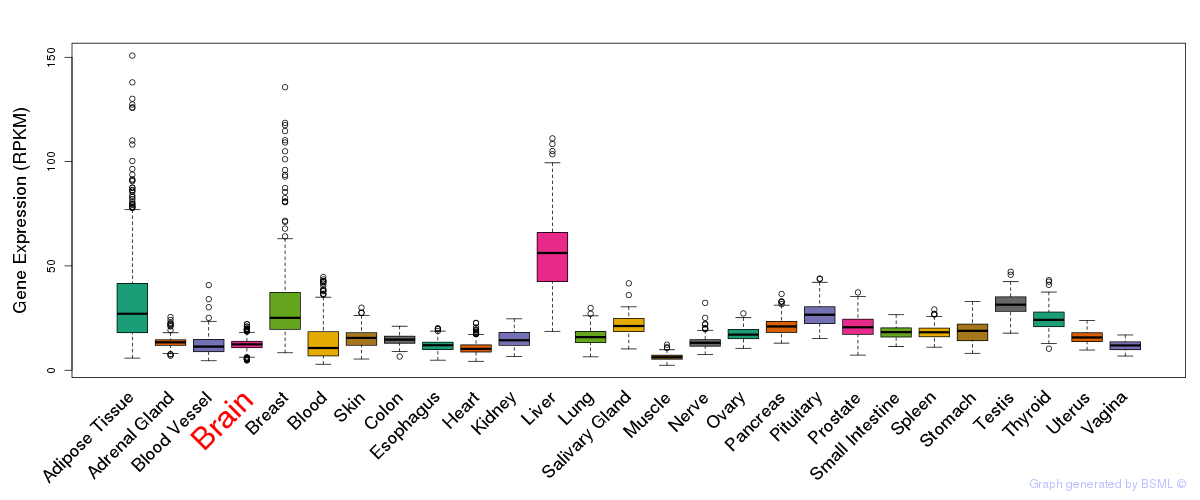
General gene expression (GTEx)
Gene expression during devlopment (BrainCloud)
Footnote:
A total of 269 time points ploted, with n=38 fetal samples (x=1:38). Each triangle represents one time point.
Gene expression of temporal and spatial changes (BrainSpan)
Footnote:
SC: sub-cortical regions; SM: sensory-motor regions; FC: frontal cortex; and TP: temporal-parietal cortex
ST1: fetal (13 - 26 postconception weeks), ST2: early infancy to late childhood (4 months to 11 years), and ST3: adolescence to adulthood (13 - 23 years)
The bar shown representes the lower 25% and upper 25% of the expression distribution.
Top co-expressed genes in brain regions
| Top 10 positively co-expressed genes | ||
| Gene | Pearson's Correlation | Spearman's Correlation |
| NSUN5C | 0.80 | 0.82 |
| SCNN1D | 0.79 | 0.84 |
| NOXA1 | 0.76 | 0.80 |
| ACCN3 | 0.76 | 0.78 |
| AC011511.1 | 0.76 | 0.77 |
| NSUN5B | 0.75 | 0.73 |
| CPT1B | 0.75 | 0.78 |
| NEIL1 | 0.75 | 0.77 |
| ZNF692 | 0.74 | 0.74 |
| AP1G2 | 0.73 | 0.79 |
| Top 10 negatively co-expressed genes | ||
| Gene | Pearson's Correlation | Spearman's Correlation |
| SEPT7 | -0.50 | -0.52 |
| GMFB | -0.50 | -0.55 |
| ZMPSTE24 | -0.48 | -0.52 |
| ABCD2 | -0.48 | -0.50 |
| ACTR2 | -0.47 | -0.53 |
| RAP1A | -0.47 | -0.53 |
| LMBRD2 | -0.47 | -0.52 |
| PJA2 | -0.46 | -0.51 |
| PNPLA8 | -0.45 | -0.52 |
| OSGIN2 | -0.45 | -0.50 |
Section V. Pathway annotation
| Pathway name | Pathway size | # SZGR 2.0 genes in pathway | Info |
|---|---|---|---|
| RODRIGUES THYROID CARCINOMA POORLY DIFFERENTIATED DN | 805 | 505 | All SZGR 2.0 genes in this pathway |
| NIKOLSKY BREAST CANCER 17Q11 Q21 AMPLICON | 133 | 78 | All SZGR 2.0 genes in this pathway |
| BYSTRYKH HEMATOPOIESIS STEM CELL AND BRAIN QTL TRANS | 185 | 114 | All SZGR 2.0 genes in this pathway |
| KUMAR TARGETS OF MLL AF9 FUSION | 405 | 264 | All SZGR 2.0 genes in this pathway |
| BURTON ADIPOGENESIS 5 | 126 | 78 | All SZGR 2.0 genes in this pathway |
| MASSARWEH TAMOXIFEN RESISTANCE UP | 578 | 341 | All SZGR 2.0 genes in this pathway |
| WANG TUMOR INVASIVENESS UP | 374 | 247 | All SZGR 2.0 genes in this pathway |
| ELLWOOD MYC TARGETS DN | 40 | 27 | All SZGR 2.0 genes in this pathway |
| MONTERO THYROID CANCER POOR SURVIVAL DN | 11 | 6 | All SZGR 2.0 genes in this pathway |
| DUTERTRE ESTRADIOL RESPONSE 24HR DN | 505 | 328 | All SZGR 2.0 genes in this pathway |
| KOINUMA TARGETS OF SMAD2 OR SMAD3 | 824 | 528 | All SZGR 2.0 genes in this pathway |
| WAKABAYASHI ADIPOGENESIS PPARG RXRA BOUND 8D | 882 | 506 | All SZGR 2.0 genes in this pathway |
| WAKABAYASHI ADIPOGENESIS PPARG RXRA BOUND WITH H4K20ME1 MARK | 145 | 82 | All SZGR 2.0 genes in this pathway |