Gene Page: EPSTI1
Summary ?
| GeneID | 94240 |
| Symbol | EPSTI1 |
| Synonyms | BRESI1 |
| Description | epithelial stromal interaction 1 (breast) |
| Reference | MIM:607441|HGNC:HGNC:16465|Ensembl:ENSG00000133106|HPRD:06309|Vega:OTTHUMG00000016814 |
| Gene type | protein-coding |
| Map location | 13q13.3 |
| Pascal p-value | 0.905 |
| Sherlock p-value | 0.425 |
| Fetal beta | 0.06 |
| DMG | 1 (# studies) |
| eGene | Myers' cis & trans |
Gene in Data Sources
| Gene set name | Method of gene set | Description | Info |
|---|---|---|---|
| CV:PGCnp | Genome-wide Association Study | GWAS | |
| DMG:Wockner_2014 | Genome-wide DNA methylation analysis | This dataset includes 4641 differentially methylated probes corresponding to 2929 unique genes between schizophrenia patients (n=24) and controls (n=24). | 1 |
Section I. Genetics and epigenetics annotation
 Differentially methylated gene
| Probe | Chromosome | Position | Nearest gene | P (dis) | Beta (dis) | FDR (dis) | Study |
|---|---|---|---|---|---|---|---|
| cg25261228 | 13 | 43566114 | EPSTI1 | 1.118E-4 | -0.213 | 0.029 | DMG:Wockner_2014 |
eQTL annotation
| SNP ID | Chromosome | Position | eGene | Gene Entrez ID | pvalue | qvalue | TSS distance | eQTL type |
|---|---|---|---|---|---|---|---|---|
| rs3766034 | chr1 | 169087664 | EPSTI1 | 94240 | 0.05 | trans | ||
| rs12748624 | chr1 | 169189770 | EPSTI1 | 94240 | 0.17 | trans | ||
| rs10495652 | chr2 | 17139288 | EPSTI1 | 94240 | 0.05 | trans | ||
| rs6531271 | chr2 | 17139932 | EPSTI1 | 94240 | 0.05 | trans | ||
| rs12620194 | chr2 | 17148003 | EPSTI1 | 94240 | 0.05 | trans | ||
| rs9397692 | chr6 | 154487314 | EPSTI1 | 94240 | 0.17 | trans | ||
| rs6477661 | chr9 | 111399284 | EPSTI1 | 94240 | 0.14 | trans | ||
| rs10816692 | chr9 | 111403558 | EPSTI1 | 94240 | 0.09 | trans | ||
| rs894376 | chr10 | 99674122 | EPSTI1 | 94240 | 0.17 | trans | ||
| rs2592926 | chr11 | 127251272 | EPSTI1 | 94240 | 0.1 | trans | ||
| rs12577873 | chr11 | 127261987 | EPSTI1 | 94240 | 0.1 | trans | ||
| rs10507881 | chr13 | 78760860 | EPSTI1 | 94240 | 0.05 | trans | ||
| rs17000632 | chr20 | 53676802 | EPSTI1 | 94240 | 0.14 | trans |
Section II. Transcriptome annotation
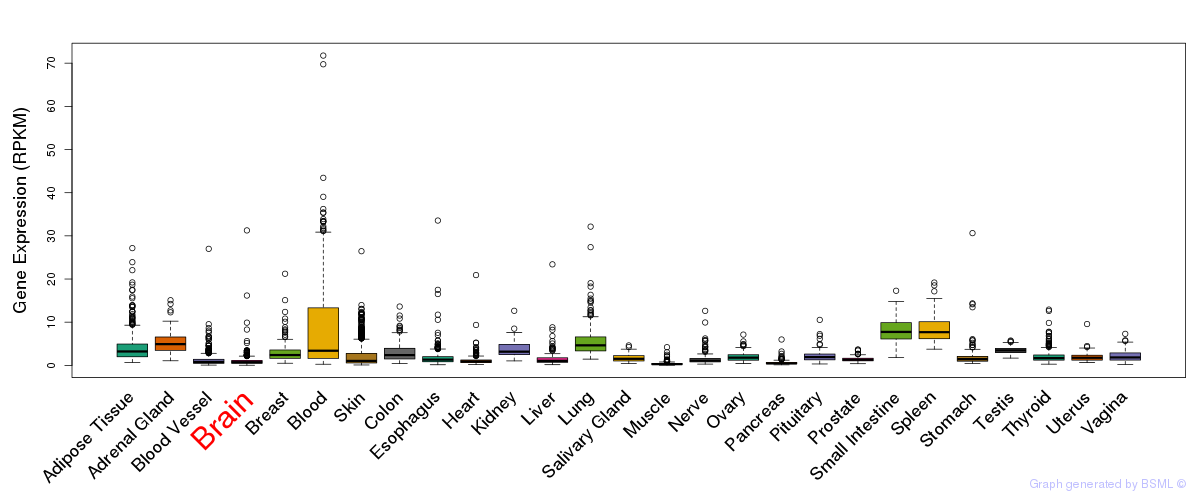
General gene expression (GTEx)
Gene expression during devlopment (BrainCloud)
Footnote:
A total of 269 time points ploted, with n=38 fetal samples (x=1:38). Each triangle represents one time point.
Gene expression of temporal and spatial changes (BrainSpan)
Footnote:
SC: sub-cortical regions; SM: sensory-motor regions; FC: frontal cortex; and TP: temporal-parietal cortex
ST1: fetal (13 - 26 postconception weeks), ST2: early infancy to late childhood (4 months to 11 years), and ST3: adolescence to adulthood (13 - 23 years)
The bar shown representes the lower 25% and upper 25% of the expression distribution.
No co-expressed genes in brain regions
Section V. Pathway annotation
| Pathway name | Pathway size | # SZGR 2.0 genes in pathway | Info |
|---|---|---|---|
| FULCHER INFLAMMATORY RESPONSE LECTIN VS LPS DN | 463 | 290 | All SZGR 2.0 genes in this pathway |
| HORIUCHI WTAP TARGETS UP | 306 | 188 | All SZGR 2.0 genes in this pathway |
| TAKEDA TARGETS OF NUP98 HOXA9 FUSION 3D UP | 182 | 110 | All SZGR 2.0 genes in this pathway |
| TAKEDA TARGETS OF NUP98 HOXA9 FUSION 8D UP | 157 | 91 | All SZGR 2.0 genes in this pathway |
| TAKEDA TARGETS OF NUP98 HOXA9 FUSION 10D UP | 194 | 122 | All SZGR 2.0 genes in this pathway |
| TAKEDA TARGETS OF NUP98 HOXA9 FUSION 16D UP | 175 | 108 | All SZGR 2.0 genes in this pathway |
| NUYTTEN NIPP1 TARGETS UP | 769 | 437 | All SZGR 2.0 genes in this pathway |
| NUYTTEN EZH2 TARGETS UP | 1037 | 673 | All SZGR 2.0 genes in this pathway |
| FOSTER TOLERANT MACROPHAGE DN | 409 | 268 | All SZGR 2.0 genes in this pathway |
| ACEVEDO LIVER CANCER UP | 973 | 570 | All SZGR 2.0 genes in this pathway |
| MOSERLE IFNA RESPONSE | 31 | 19 | All SZGR 2.0 genes in this pathway |
| CHEN METABOLIC SYNDROM NETWORK | 1210 | 725 | All SZGR 2.0 genes in this pathway |
| BOSCO INTERFERON INDUCED ANTIVIRAL MODULE | 78 | 48 | All SZGR 2.0 genes in this pathway |
| ZWANG TRANSIENTLY UP BY 1ST EGF PULSE ONLY | 1839 | 928 | All SZGR 2.0 genes in this pathway |
| HECKER IFNB1 TARGETS | 95 | 54 | All SZGR 2.0 genes in this pathway |