Gene Page: MED27
Summary ?
| GeneID | 9442 |
| Symbol | MED27 |
| Synonyms | CRAP34|CRSP34|CRSP8|MED3|TRAP37 |
| Description | mediator complex subunit 27 |
| Reference | MIM:605044|HGNC:HGNC:2377|Ensembl:ENSG00000160563|HPRD:05438|Vega:OTTHUMG00000020833 |
| Gene type | protein-coding |
| Map location | 9q34.13 |
| Pascal p-value | 0.01 |
| Sherlock p-value | 0.504 |
| Fetal beta | -0.084 |
| DMG | 1 (# studies) |
| Support | Ascano FMRP targets |
Gene in Data Sources
| Gene set name | Method of gene set | Description | Info |
|---|---|---|---|
| CV:GWASdb | Genome-wide Association Studies | GWASdb records for schizophrenia | |
| CV:PGCnp | Genome-wide Association Study | GWAS | |
| DMG:Jaffe_2016 | Genome-wide DNA methylation analysis | This dataset includes 2,104 probes/CpGs associated with SZ patients (n=108) compared to 136 controls at Bonferroni-adjusted P < 0.05. | 1 |
Section I. Genetics and epigenetics annotation
 Differentially methylated gene
| Probe | Chromosome | Position | Nearest gene | P (dis) | Beta (dis) | FDR (dis) | Study |
|---|---|---|---|---|---|---|---|
| cg26228569 | 9 | 134955334 | MED27 | 1.23E-8 | -0.011 | 5.01E-6 | DMG:Jaffe_2016 |
Section II. Transcriptome annotation
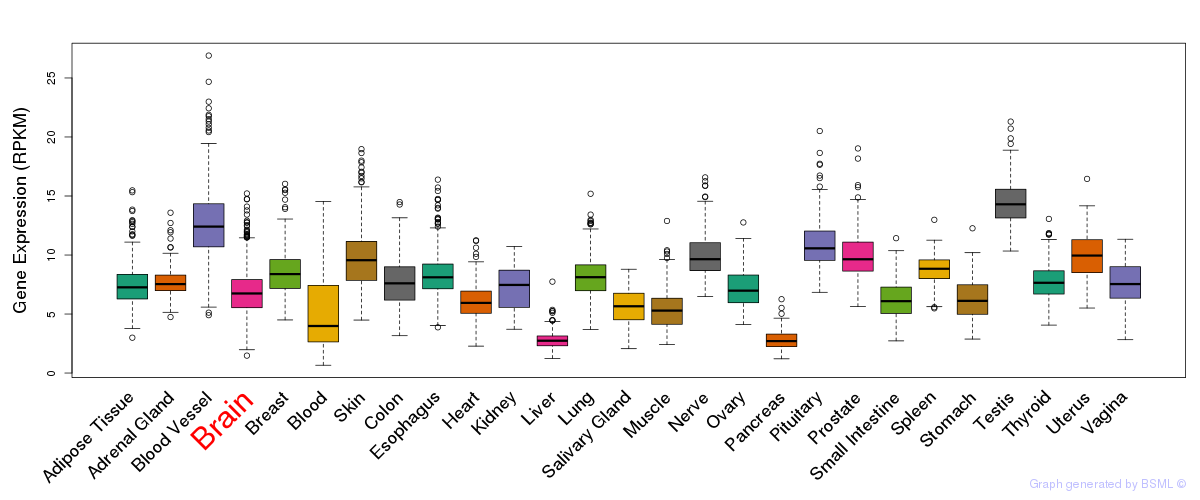
General gene expression (GTEx)

Gene expression during devlopment (BrainCloud)
Footnote:
A total of 269 time points ploted, with n=38 fetal samples (x=1:38). Each triangle represents one time point.
Gene expression of temporal and spatial changes (BrainSpan)
Footnote:
SC: sub-cortical regions; SM: sensory-motor regions; FC: frontal cortex; and TP: temporal-parietal cortex
ST1: fetal (13 - 26 postconception weeks), ST2: early infancy to late childhood (4 months to 11 years), and ST3: adolescence to adulthood (13 - 23 years)
The bar shown representes the lower 25% and upper 25% of the expression distribution.
Top co-expressed genes in brain regions
| Top 10 positively co-expressed genes | ||
| Gene | Pearson's Correlation | Spearman's Correlation |
| UHRF2 | 0.95 | 0.95 |
| ZNF227 | 0.95 | 0.96 |
| LUC7L2 | 0.95 | 0.96 |
| SF3B1 | 0.95 | 0.97 |
| SFRS11 | 0.94 | 0.95 |
| SNW1 | 0.94 | 0.95 |
| DHX15 | 0.94 | 0.95 |
| UIMC1 | 0.93 | 0.93 |
| KIAA0020 | 0.93 | 0.93 |
| ZCCHC7 | 0.93 | 0.93 |
| Top 10 negatively co-expressed genes | ||
| Gene | Pearson's Correlation | Spearman's Correlation |
| AF347015.31 | -0.70 | -0.88 |
| IFI27 | -0.70 | -0.89 |
| MT-CO2 | -0.69 | -0.87 |
| AF347015.27 | -0.69 | -0.86 |
| HLA-F | -0.69 | -0.79 |
| FXYD1 | -0.68 | -0.87 |
| AF347015.33 | -0.68 | -0.85 |
| AIFM3 | -0.67 | -0.78 |
| PTH1R | -0.67 | -0.78 |
| MT-CYB | -0.67 | -0.84 |
Section V. Pathway annotation
| Pathway name | Pathway size | # SZGR 2.0 genes in pathway | Info |
|---|---|---|---|
| REACTOME DEVELOPMENTAL BIOLOGY | 396 | 292 | All SZGR 2.0 genes in this pathway |
| REACTOME PPARA ACTIVATES GENE EXPRESSION | 104 | 72 | All SZGR 2.0 genes in this pathway |
| REACTOME GENERIC TRANSCRIPTION PATHWAY | 352 | 181 | All SZGR 2.0 genes in this pathway |
| REACTOME METABOLISM OF LIPIDS AND LIPOPROTEINS | 478 | 302 | All SZGR 2.0 genes in this pathway |
| REACTOME FATTY ACID TRIACYLGLYCEROL AND KETONE BODY METABOLISM | 168 | 115 | All SZGR 2.0 genes in this pathway |
| REACTOME TRANSCRIPTIONAL REGULATION OF WHITE ADIPOCYTE DIFFERENTIATION | 72 | 53 | All SZGR 2.0 genes in this pathway |
| NAKAMURA TUMOR ZONE PERIPHERAL VS CENTRAL UP | 285 | 181 | All SZGR 2.0 genes in this pathway |
| KIM RESPONSE TO TSA AND DECITABINE DN | 13 | 10 | All SZGR 2.0 genes in this pathway |
| DAVICIONI TARGETS OF PAX FOXO1 FUSIONS UP | 255 | 177 | All SZGR 2.0 genes in this pathway |
| LOPEZ MBD TARGETS | 957 | 597 | All SZGR 2.0 genes in this pathway |
| CHUNG BLISTER CYTOTOXICITY UP | 134 | 84 | All SZGR 2.0 genes in this pathway |
| WEST ADRENOCORTICAL TUMOR UP | 294 | 199 | All SZGR 2.0 genes in this pathway |
| WEST ADRENOCORTICAL CARCINOMA VS ADENOMA UP | 21 | 13 | All SZGR 2.0 genes in this pathway |
| JOHNSTONE PARVB TARGETS 3 DN | 918 | 550 | All SZGR 2.0 genes in this pathway |
| ZWANG TRANSIENTLY UP BY 1ST EGF PULSE ONLY | 1839 | 928 | All SZGR 2.0 genes in this pathway |