Gene Page: ZNF254
Summary ?
| GeneID | 9534 |
| Symbol | ZNF254 |
| Synonyms | BMZF-5|HD-ZNF1|ZNF539|ZNF91L |
| Description | zinc finger protein 254 |
| Reference | MIM:604768|HGNC:HGNC:13047|Ensembl:ENSG00000213096|HPRD:05304|HPRD:15826|Vega:OTTHUMG00000183394 |
| Gene type | protein-coding |
| Map location | 19p12 |
| Sherlock p-value | 0.624 |
| Fetal beta | 1.274 |
| DMG | 1 (# studies) |
Gene in Data Sources
| Gene set name | Method of gene set | Description | Info |
|---|---|---|---|
| DMG:Wockner_2014 | Genome-wide DNA methylation analysis | This dataset includes 4641 differentially methylated probes corresponding to 2929 unique genes between schizophrenia patients (n=24) and controls (n=24). | 1 |
Section I. Genetics and epigenetics annotation
 Differentially methylated gene
| Probe | Chromosome | Position | Nearest gene | P (dis) | Beta (dis) | FDR (dis) | Study |
|---|---|---|---|---|---|---|---|
| cg17268801 | 19 | 24269968 | ZNF254 | 3.264E-4 | -0.318 | 0.04 | DMG:Wockner_2014 |
Section II. Transcriptome annotation
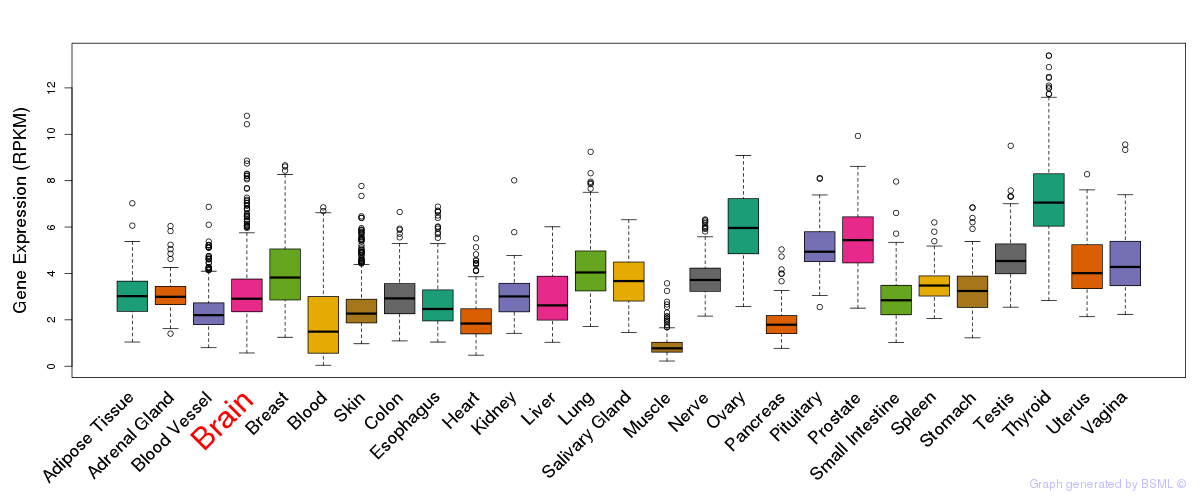
General gene expression (GTEx)
Gene expression during devlopment (BrainCloud)
Footnote:
A total of 269 time points ploted, with n=38 fetal samples (x=1:38). Each triangle represents one time point.
Gene expression of temporal and spatial changes (BrainSpan)
Footnote:
SC: sub-cortical regions; SM: sensory-motor regions; FC: frontal cortex; and TP: temporal-parietal cortex
ST1: fetal (13 - 26 postconception weeks), ST2: early infancy to late childhood (4 months to 11 years), and ST3: adolescence to adulthood (13 - 23 years)
The bar shown representes the lower 25% and upper 25% of the expression distribution.
Top co-expressed genes in brain regions
| Top 10 positively co-expressed genes | ||
| Gene | Pearson's Correlation | Spearman's Correlation |
| RTF1 | 0.88 | 0.92 |
| THOC2 | 0.86 | 0.89 |
| TRIM33 | 0.85 | 0.87 |
| RSBN1L | 0.85 | 0.91 |
| TOP2B | 0.84 | 0.88 |
| SMARCE1 | 0.84 | 0.85 |
| ZNF669 | 0.84 | 0.84 |
| SUPT16H | 0.84 | 0.86 |
| ZNF583 | 0.84 | 0.84 |
| CTR9 | 0.83 | 0.86 |
| Top 10 negatively co-expressed genes | ||
| Gene | Pearson's Correlation | Spearman's Correlation |
| TSC22D4 | -0.76 | -0.86 |
| ALDOC | -0.75 | -0.84 |
| AIFM3 | -0.74 | -0.83 |
| SNTA1 | -0.74 | -0.87 |
| TNFSF12 | -0.73 | -0.80 |
| HLA-F | -0.73 | -0.82 |
| SLC25A18 | -0.72 | -0.86 |
| CLU | -0.72 | -0.80 |
| HEPN1 | -0.72 | -0.81 |
| ROM1 | -0.71 | -0.84 |
Section V. Pathway annotation
| Pathway name | Pathway size | # SZGR 2.0 genes in pathway | Info |
|---|---|---|---|
| REACTOME GENERIC TRANSCRIPTION PATHWAY | 352 | 181 | All SZGR 2.0 genes in this pathway |
| AMUNDSON RESPONSE TO ARSENITE | 217 | 143 | All SZGR 2.0 genes in this pathway |
| BUYTAERT PHOTODYNAMIC THERAPY STRESS UP | 811 | 508 | All SZGR 2.0 genes in this pathway |
| BLALOCK ALZHEIMERS DISEASE INCIPIENT UP | 390 | 242 | All SZGR 2.0 genes in this pathway |
| DEBIASI APOPTOSIS BY REOVIRUS INFECTION UP | 314 | 201 | All SZGR 2.0 genes in this pathway |
| BLALOCK ALZHEIMERS DISEASE UP | 1691 | 1088 | All SZGR 2.0 genes in this pathway |
| TOYOTA TARGETS OF MIR34B AND MIR34C | 463 | 262 | All SZGR 2.0 genes in this pathway |
| SHEDDEN LUNG CANCER GOOD SURVIVAL A4 | 196 | 124 | All SZGR 2.0 genes in this pathway |
| YAGI AML WITH T 8 21 TRANSLOCATION | 368 | 247 | All SZGR 2.0 genes in this pathway |
| PURBEY TARGETS OF CTBP1 NOT SATB1 UP | 344 | 215 | All SZGR 2.0 genes in this pathway |