Gene Page: IGDCC3
Summary ?
| GeneID | 9543 |
| Symbol | IGDCC3 |
| Synonyms | HsT18880|PUNC |
| Description | immunoglobulin superfamily, DCC subclass, member 3 |
| Reference | MIM:604184|HGNC:HGNC:9700|Ensembl:ENSG00000174498|HPRD:09169|Vega:OTTHUMG00000133137 |
| Gene type | protein-coding |
| Map location | 15q22.3-q23 |
| Pascal p-value | 0.589 |
| Sherlock p-value | 0.944 |
| DMG | 1 (# studies) |
| eGene | Cerebellar Hemisphere Cerebellum |
Gene in Data Sources
| Gene set name | Method of gene set | Description | Info |
|---|---|---|---|
| CV:PGCnp | Genome-wide Association Study | GWAS | |
| DMG:Wockner_2014 | Genome-wide DNA methylation analysis | This dataset includes 4641 differentially methylated probes corresponding to 2929 unique genes between schizophrenia patients (n=24) and controls (n=24). | 1 |
Section I. Genetics and epigenetics annotation
 Differentially methylated gene
| Probe | Chromosome | Position | Nearest gene | P (dis) | Beta (dis) | FDR (dis) | Study |
|---|---|---|---|---|---|---|---|
| cg17148395 | 15 | 65654217 | IGDCC3 | 3.941E-4 | 0.516 | 0.043 | DMG:Wockner_2014 |
Section II. Transcriptome annotation
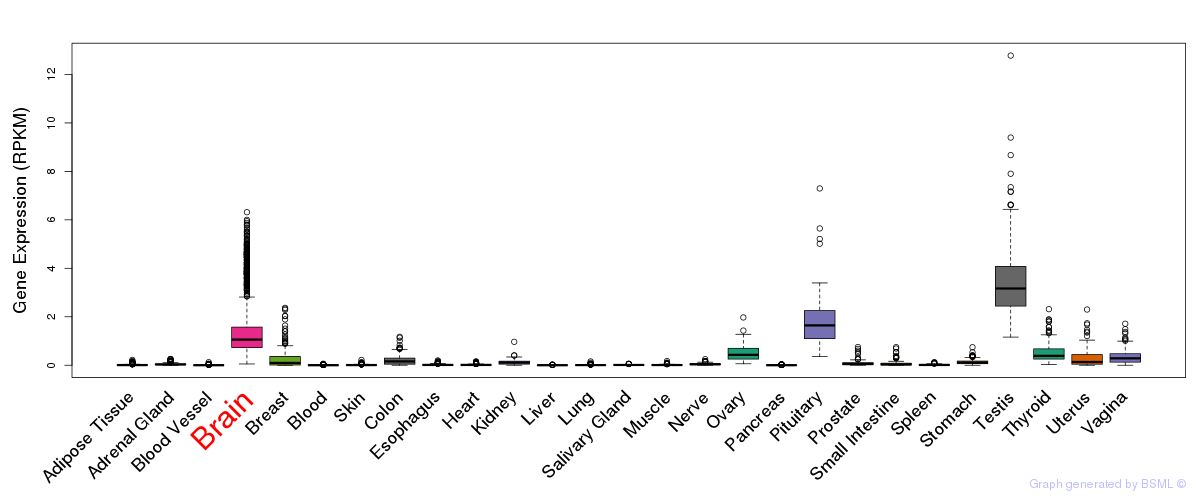
General gene expression (GTEx)
Gene expression of temporal and spatial changes (BrainSpan)
Footnote:
SC: sub-cortical regions; SM: sensory-motor regions; FC: frontal cortex; and TP: temporal-parietal cortex
ST1: fetal (13 - 26 postconception weeks), ST2: early infancy to late childhood (4 months to 11 years), and ST3: adolescence to adulthood (13 - 23 years)
The bar shown representes the lower 25% and upper 25% of the expression distribution.
Top co-expressed genes in brain regions
| Top 10 positively co-expressed genes | ||
| Gene | Pearson's Correlation | Spearman's Correlation |
| ZBTB4 | 0.81 | 0.80 |
| IQSEC1 | 0.81 | 0.84 |
| AC008449.1 | 0.79 | 0.78 |
| ETS2 | 0.79 | 0.85 |
| KCTD8 | 0.78 | 0.82 |
| MKL2 | 0.78 | 0.80 |
| SOD2 | 0.78 | 0.82 |
| MAST3 | 0.78 | 0.85 |
| AP006216.1 | 0.78 | 0.77 |
| MBNL1 | 0.77 | 0.81 |
| Top 10 negatively co-expressed genes | ||
| Gene | Pearson's Correlation | Spearman's Correlation |
| RPL31 | -0.46 | -0.56 |
| HEBP2 | -0.45 | -0.61 |
| RPL35 | -0.44 | -0.56 |
| RPL34 | -0.44 | -0.58 |
| RPL36 | -0.43 | -0.57 |
| RPS18 | -0.43 | -0.53 |
| RPL38 | -0.43 | -0.62 |
| RPL27 | -0.43 | -0.52 |
| PFDN5 | -0.43 | -0.48 |
| RPS20 | -0.43 | -0.58 |
Section V. Pathway annotation
| Pathway name | Pathway size | # SZGR 2.0 genes in pathway | Info |
|---|---|---|---|
| WANG LMO4 TARGETS UP | 372 | 227 | All SZGR 2.0 genes in this pathway |
| GAUSSMANN MLL AF4 FUSION TARGETS G UP | 238 | 135 | All SZGR 2.0 genes in this pathway |
| MARTORIATI MDM4 TARGETS FETAL LIVER DN | 514 | 319 | All SZGR 2.0 genes in this pathway |
| GROSS HYPOXIA VIA ELK3 UP | 209 | 139 | All SZGR 2.0 genes in this pathway |
| CERVERA SDHB TARGETS 2 | 114 | 76 | All SZGR 2.0 genes in this pathway |
| WANG CISPLATIN RESPONSE AND XPC UP | 202 | 115 | All SZGR 2.0 genes in this pathway |
| BHATI G2M ARREST BY 2METHOXYESTRADIOL DN | 127 | 75 | All SZGR 2.0 genes in this pathway |
| MEISSNER BRAIN HCP WITH H3K4ME3 AND H3K27ME3 | 1069 | 729 | All SZGR 2.0 genes in this pathway |
| VANDESLUIS COMMD1 TARGETS GROUP 3 DN | 39 | 21 | All SZGR 2.0 genes in this pathway |
| WANG TNF TARGETS | 24 | 17 | All SZGR 2.0 genes in this pathway |