Gene Page: CDC42BPB
Summary ?
| GeneID | 9578 |
| Symbol | CDC42BPB |
| Synonyms | MRCKB |
| Description | CDC42 binding protein kinase beta |
| Reference | MIM:614062|HGNC:HGNC:1738|Ensembl:ENSG00000198752|HPRD:08516|Vega:OTTHUMG00000171898 |
| Gene type | protein-coding |
| Map location | 14q32.3 |
| Pascal p-value | 0.087 |
| Sherlock p-value | 0.552 |
| Fetal beta | -1.885 |
| DMG | 1 (# studies) |
| eGene | Myers' cis & trans |
| Support | G2Cdb.human_BAYES-COLLINS-HUMAN-PSD-CONSENSUS G2Cdb.human_BAYES-COLLINS-HUMAN-PSD-FULL G2Cdb.human_BAYES-COLLINS-MOUSE-PSD-CONSENSUS G2Cdb.humanPSD G2Cdb.humanPSP CompositeSet Darnell FMRP targets Ascano FMRP targets |
Gene in Data Sources
| Gene set name | Method of gene set | Description | Info |
|---|---|---|---|
| CV:PGCnp | Genome-wide Association Study | GWAS | |
| DMG:Wockner_2014 | Genome-wide DNA methylation analysis | This dataset includes 4641 differentially methylated probes corresponding to 2929 unique genes between schizophrenia patients (n=24) and controls (n=24). | 2 |
| PMID:cooccur | High-throughput literature-search | Systematic search in PubMed for genes co-occurring with SCZ keywords. A total of 3027 genes were included. | |
| Literature | High-throughput literature-search | Co-occurance with Schizophrenia keywords: schizophrenia,schizophrenic,schizophrenias | Click to show details |
Section I. Genetics and epigenetics annotation
 Differentially methylated gene
| Probe | Chromosome | Position | Nearest gene | P (dis) | Beta (dis) | FDR (dis) | Study |
|---|---|---|---|---|---|---|---|
| cg19612114 | 14 | 103433138 | CDC42BPB | 1.724E-4 | 0.414 | 0.033 | DMG:Wockner_2014 |
| cg16283158 | 14 | 103433189 | CDC42BPB | 5.657E-4 | 0.371 | 0.049 | DMG:Wockner_2014 |
eQTL annotation
| SNP ID | Chromosome | Position | eGene | Gene Entrez ID | pvalue | qvalue | TSS distance | eQTL type |
|---|---|---|---|---|---|---|---|---|
| rs11622648 | chr14 | 58513059 | CDC42BPB | 9578 | 0.15 | trans |
Section II. Transcriptome annotation
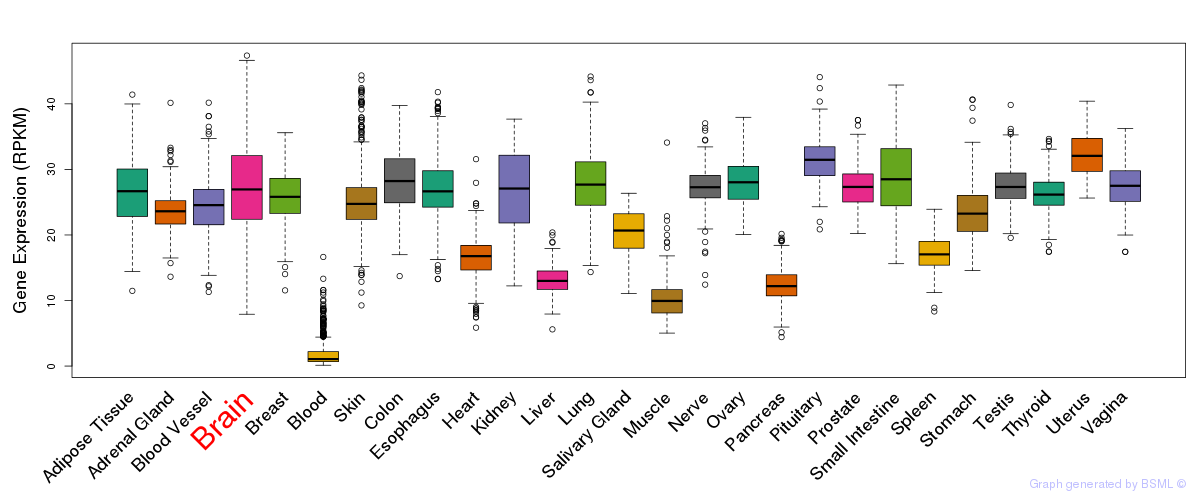
General gene expression (GTEx)
Gene expression during devlopment (BrainCloud)
Footnote:
A total of 269 time points ploted, with n=38 fetal samples (x=1:38). Each triangle represents one time point.
Gene expression of temporal and spatial changes (BrainSpan)
Footnote:
SC: sub-cortical regions; SM: sensory-motor regions; FC: frontal cortex; and TP: temporal-parietal cortex
ST1: fetal (13 - 26 postconception weeks), ST2: early infancy to late childhood (4 months to 11 years), and ST3: adolescence to adulthood (13 - 23 years)
The bar shown representes the lower 25% and upper 25% of the expression distribution.
Top co-expressed genes in brain regions
| Top 10 positively co-expressed genes | ||
| Gene | Pearson's Correlation | Spearman's Correlation |
| GRAMD1B | 0.89 | 0.92 |
| MADD | 0.88 | 0.87 |
| PHLPP2 | 0.88 | 0.88 |
| BTBD9 | 0.87 | 0.86 |
| HTT | 0.87 | 0.87 |
| NFE2L1 | 0.87 | 0.87 |
| PGBD5 | 0.86 | 0.87 |
| LRP11 | 0.86 | 0.85 |
| AMIGO1 | 0.86 | 0.86 |
| ABR | 0.86 | 0.87 |
| Top 10 negatively co-expressed genes | ||
| Gene | Pearson's Correlation | Spearman's Correlation |
| AF347015.21 | -0.55 | -0.54 |
| C1orf54 | -0.54 | -0.60 |
| GNG11 | -0.52 | -0.55 |
| PLA2G5 | -0.52 | -0.48 |
| HIGD1B | -0.51 | -0.51 |
| AF347015.31 | -0.51 | -0.51 |
| MT-CO2 | -0.50 | -0.51 |
| SAT1 | -0.49 | -0.52 |
| C1orf61 | -0.49 | -0.54 |
| S100A13 | -0.48 | -0.48 |
Section V. Pathway annotation
| Pathway name | Pathway size | # SZGR 2.0 genes in pathway | Info |
|---|---|---|---|
| ONKEN UVEAL MELANOMA UP | 783 | 507 | All SZGR 2.0 genes in this pathway |
| DODD NASOPHARYNGEAL CARCINOMA UP | 1821 | 933 | All SZGR 2.0 genes in this pathway |
| PASQUALUCCI LYMPHOMA BY GC STAGE UP | 283 | 177 | All SZGR 2.0 genes in this pathway |
| ALCALAY AML BY NPM1 LOCALIZATION UP | 140 | 83 | All SZGR 2.0 genes in this pathway |
| SANSOM APC MYC TARGETS | 217 | 138 | All SZGR 2.0 genes in this pathway |
| AMUNDSON POOR SURVIVAL AFTER GAMMA RADIATION 2G | 171 | 96 | All SZGR 2.0 genes in this pathway |
| MOOTHA MITOCHONDRIA | 447 | 277 | All SZGR 2.0 genes in this pathway |
| BOYLAN MULTIPLE MYELOMA PCA3 UP | 80 | 54 | All SZGR 2.0 genes in this pathway |
| FEVR CTNNB1 TARGETS UP | 682 | 433 | All SZGR 2.0 genes in this pathway |