Gene Page: CARTPT
Summary ?
| GeneID | 9607 |
| Symbol | CARTPT |
| Synonyms | CART |
| Description | CART prepropeptide |
| Reference | MIM:602606|HGNC:HGNC:24323|Ensembl:ENSG00000164326|HPRD:04006|Vega:OTTHUMG00000131261 |
| Gene type | protein-coding |
| Map location | 5q13.2 |
| Pascal p-value | 0.653 |
| Fetal beta | -4.48 |
| eGene | Myers' cis & trans |
Gene in Data Sources
| Gene set name | Method of gene set | Description | Info |
|---|---|---|---|
| CV:PGCnp | Genome-wide Association Study | GWAS | |
| PMID:cooccur | High-throughput literature-search | Systematic search in PubMed for genes co-occurring with SCZ keywords. A total of 3027 genes were included. | |
| Literature | High-throughput literature-search | Co-occurance with Schizophrenia keywords: schizophrenia,schizophrenias | Click to show details |
| GO_Annotation | Mapping neuro-related keywords to Gene Ontology annotations | Hits with neuro-related keywords: 3 |
Section I. Genetics and epigenetics annotation
 eQTL annotation
| SNP ID | Chromosome | Position | eGene | Gene Entrez ID | pvalue | qvalue | TSS distance | eQTL type |
|---|---|---|---|---|---|---|---|---|
| rs17472583 | chr1 | 18340024 | CARTPT | 9607 | 0.16 | trans | ||
| rs7550971 | chr1 | 244252164 | CARTPT | 9607 | 0 | trans | ||
| rs1371418 | chr2 | 35830333 | CARTPT | 9607 | 0.17 | trans | ||
| rs1867683 | chr5 | 53928375 | CARTPT | 9607 | 0.01 | trans | ||
| rs11063553 | chr12 | 5287380 | CARTPT | 9607 | 0.11 | trans | ||
| rs1562121 | chr13 | 43777113 | CARTPT | 9607 | 0.1 | trans | ||
| rs719089 | chr18 | 55053775 | CARTPT | 9607 | 0.03 | trans |
Section II. Transcriptome annotation
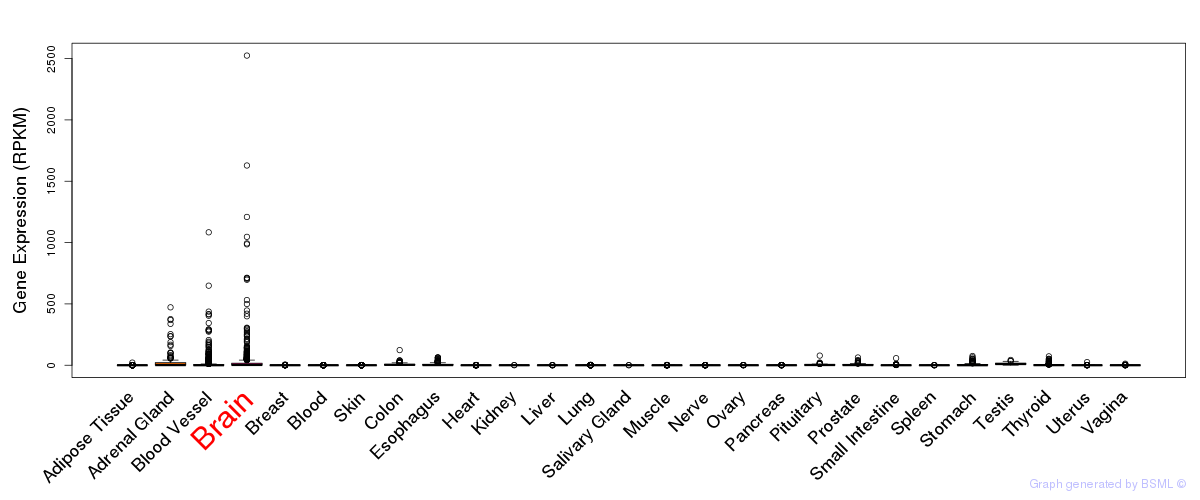
General gene expression (GTEx)
Gene expression during devlopment (BrainCloud)
Footnote:
A total of 269 time points ploted, with n=38 fetal samples (x=1:38). Each triangle represents one time point.
Gene expression of temporal and spatial changes (BrainSpan)
Footnote:
SC: sub-cortical regions; SM: sensory-motor regions; FC: frontal cortex; and TP: temporal-parietal cortex
ST1: fetal (13 - 26 postconception weeks), ST2: early infancy to late childhood (4 months to 11 years), and ST3: adolescence to adulthood (13 - 23 years)
The bar shown representes the lower 25% and upper 25% of the expression distribution.
Top co-expressed genes in brain regions
| Top 10 positively co-expressed genes | ||
| Gene | Pearson's Correlation | Spearman's Correlation |
| IQSEC3 | 0.95 | 0.95 |
| CAMTA2 | 0.93 | 0.93 |
| TOM1L2 | 0.93 | 0.90 |
| TTC7B | 0.93 | 0.93 |
| CNTNAP1 | 0.92 | 0.89 |
| MAP1A | 0.92 | 0.93 |
| PTPRN | 0.92 | 0.92 |
| GRIN1 | 0.92 | 0.91 |
| SYN1 | 0.92 | 0.92 |
| RAD21L1 | 0.92 | 0.92 |
| Top 10 negatively co-expressed genes | ||
| Gene | Pearson's Correlation | Spearman's Correlation |
| C9orf46 | -0.52 | -0.53 |
| EXOSC8 | -0.51 | -0.46 |
| BCL7C | -0.50 | -0.55 |
| C21orf57 | -0.50 | -0.50 |
| GTF3C6 | -0.49 | -0.48 |
| RBMX2 | -0.49 | -0.50 |
| RPL23A | -0.47 | -0.52 |
| RPS20 | -0.47 | -0.57 |
| RPS6 | -0.47 | -0.50 |
| RPS8 | -0.47 | -0.49 |
Section III. Gene Ontology annotation
| Molecular function | GO term | Evidence | Neuro keywords | PubMed ID |
|---|---|---|---|---|
| GO:0005515 | protein binding | IEA | - | |
| Biological process | GO term | Evidence | Neuro keywords | PubMed ID |
| GO:0051971 | positive regulation of transmission of nerve impulse | IDA | neuron (GO term level: 8) | 11711504 |
| GO:0007268 | synaptic transmission | IEA | neuron, Synap, Neurotransmitter (GO term level: 6) | - |
| GO:0007218 | neuropeptide signaling pathway | IEA | Neurotransmitter (GO term level: 8) | - |
| GO:0000186 | activation of MAPKK activity | ISS | 15908120 | |
| GO:0001678 | cellular glucose homeostasis | IDA | 11711504 | |
| GO:0007165 | signal transduction | TAS | 8647455 | |
| GO:0008343 | adult feeding behavior | ISS | - | |
| GO:0009267 | cellular response to starvation | ISS | 15680948 | |
| GO:0032812 | positive regulation of epinephrine secretion | IDA | 11711504 | |
| GO:0032099 | negative regulation of appetite | ISS | - | |
| GO:0032099 | negative regulation of appetite | TAS | 11478874 | |
| GO:0032922 | circadian regulation of gene expression | ISS | - | |
| GO:0045779 | negative regulation of bone resorption | IMP | 16614075 | |
| GO:0046850 | regulation of bone remodeling | IEA | - | |
| GO:0045671 | negative regulation of osteoclast differentiation | TAS | 16614075 | |
| GO:0045777 | positive regulation of blood pressure | IDA | 11711504 | |
| Cellular component | GO term | Evidence | Neuro keywords | PubMed ID |
| GO:0005576 | extracellular region | IEA | - | |
| GO:0005615 | extracellular space | IDA | 11711504 | |
| GO:0005615 | extracellular space | ISS | - |
Section V. Pathway annotation
| Pathway name | Pathway size | # SZGR 2.0 genes in pathway | Info |
|---|---|---|---|
| ONKEN UVEAL MELANOMA DN | 526 | 357 | All SZGR 2.0 genes in this pathway |
| NADERI BREAST CANCER PROGNOSIS UP | 50 | 26 | All SZGR 2.0 genes in this pathway |
| TSAI RESPONSE TO IONIZING RADIATION | 149 | 101 | All SZGR 2.0 genes in this pathway |
| KANNAN TP53 TARGETS UP | 58 | 40 | All SZGR 2.0 genes in this pathway |
| MA PITUITARY FETAL VS ADULT DN | 19 | 17 | All SZGR 2.0 genes in this pathway |
| IVANOVA HEMATOPOIESIS STEM CELL AND PROGENITOR | 681 | 420 | All SZGR 2.0 genes in this pathway |
| MARSON BOUND BY FOXP3 UNSTIMULATED | 1229 | 713 | All SZGR 2.0 genes in this pathway |
| YOSHIMURA MAPK8 TARGETS UP | 1305 | 895 | All SZGR 2.0 genes in this pathway |
| MEISSNER NPC HCP WITH H3K27ME3 | 79 | 59 | All SZGR 2.0 genes in this pathway |
| MEISSNER BRAIN HCP WITH H3K4ME3 AND H3K27ME3 | 1069 | 729 | All SZGR 2.0 genes in this pathway |
| MIKKELSEN MCV6 HCP WITH H3K27ME3 | 435 | 318 | All SZGR 2.0 genes in this pathway |
| MIKKELSEN NPC HCP WITH H3K27ME3 | 341 | 243 | All SZGR 2.0 genes in this pathway |
| MIKKELSEN MEF HCP WITH H3K27ME3 | 590 | 403 | All SZGR 2.0 genes in this pathway |
| WAKABAYASHI ADIPOGENESIS PPARG RXRA BOUND 8D | 882 | 506 | All SZGR 2.0 genes in this pathway |
Section VI. microRNA annotation
| miRNA family | Target position | miRNA ID | miRNA seq | ||
|---|---|---|---|---|---|
| UTR start | UTR end | Match method | |||
| miR-377 | 170 | 177 | 1A,m8 | hsa-miR-377 | AUCACACAAAGGCAACUUUUGU |
- SZ: miRNAs which differentially expressed in brain cortex of schizophrenia patients comparing with control samples using microarray. Click here to see the list of SZ related miRNAs.
- Brain: miRNAs which are expressed in brain based on miRNA microarray expression studies. Click here to see the list of brain related miRNAs.