Gene Page: KIAA0355
Summary ?
| GeneID | 9710 |
| Symbol | KIAA0355 |
| Synonyms | - |
| Description | KIAA0355 |
| Reference | HGNC:HGNC:29016|Ensembl:ENSG00000166398|HPRD:11077|Vega:OTTHUMG00000180505 |
| Gene type | protein-coding |
| Map location | 19q13.11 |
| Pascal p-value | 0.146 |
| Sherlock p-value | 0.762 |
| Fetal beta | 1.041 |
| DMG | 1 (# studies) |
| eGene | Myers' cis & trans |
Gene in Data Sources
| Gene set name | Method of gene set | Description | Info |
|---|---|---|---|
| CV:PGCnp | Genome-wide Association Study | GWAS | |
| DMG:Montano_2016 | Genome-wide DNA methylation analysis | This dataset includes 172 replicated associations between CpGs with schizophrenia. | 1 |
Section I. Genetics and epigenetics annotation
 Differentially methylated gene
| Probe | Chromosome | Position | Nearest gene | P (dis) | Beta (dis) | FDR (dis) | Study |
|---|---|---|---|---|---|---|---|
| cg07458272 | 19 | 34744396 | KIAA0355 | 5.39E-7 | 0.01 | 0.014 | DMG:Montano_2016 |
eQTL annotation
| SNP ID | Chromosome | Position | eGene | Gene Entrez ID | pvalue | qvalue | TSS distance | eQTL type |
|---|---|---|---|---|---|---|---|---|
| rs16829545 | chr2 | 151977407 | KIAA0355 | 9710 | 0.02 | trans | ||
| rs10965049 | chr9 | 21526525 | KIAA0355 | 9710 | 0.05 | trans | ||
| rs3118341 | chr9 | 25185518 | KIAA0355 | 9710 | 0.08 | trans | ||
| rs2393316 | chr10 | 59333070 | KIAA0355 | 9710 | 0.09 | trans | ||
| rs16955618 | chr15 | 29937543 | KIAA0355 | 9710 | 3.352E-4 | trans |
Section II. Transcriptome annotation
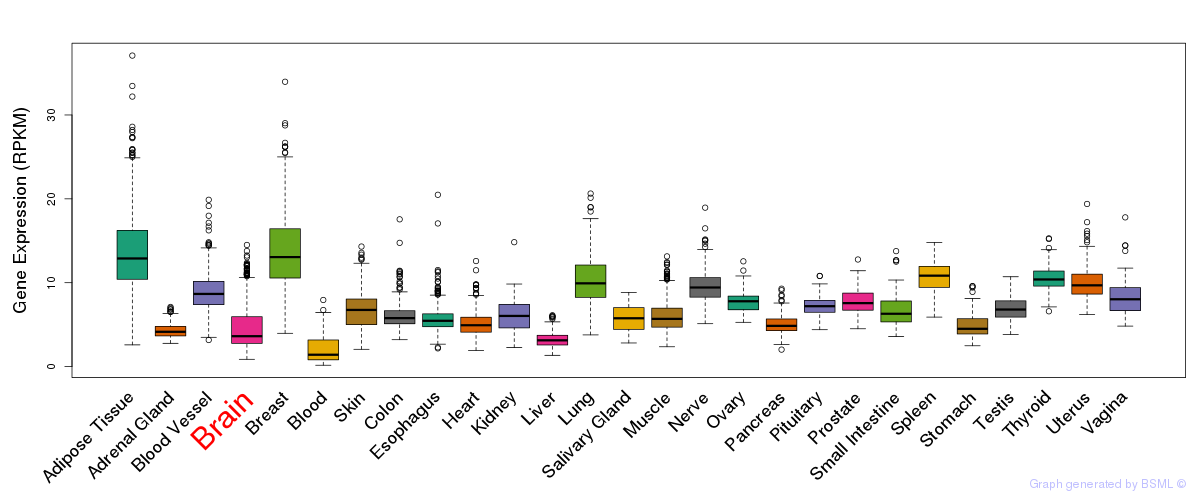
General gene expression (GTEx)
Gene expression during devlopment (BrainCloud)
Footnote:
A total of 269 time points ploted, with n=38 fetal samples (x=1:38). Each triangle represents one time point.
Gene expression of temporal and spatial changes (BrainSpan)
Footnote:
SC: sub-cortical regions; SM: sensory-motor regions; FC: frontal cortex; and TP: temporal-parietal cortex
ST1: fetal (13 - 26 postconception weeks), ST2: early infancy to late childhood (4 months to 11 years), and ST3: adolescence to adulthood (13 - 23 years)
The bar shown representes the lower 25% and upper 25% of the expression distribution.
Top co-expressed genes in brain regions
| Top 10 positively co-expressed genes | ||
| Gene | Pearson's Correlation | Spearman's Correlation |
| ENTPD6 | 0.91 | 0.91 |
| GRIN1 | 0.90 | 0.93 |
| MAN2B2 | 0.90 | 0.89 |
| DCTN1 | 0.89 | 0.92 |
| PLD3 | 0.89 | 0.90 |
| CLSTN3 | 0.88 | 0.90 |
| SLC25A22 | 0.88 | 0.90 |
| PTPRN | 0.88 | 0.90 |
| AP001107.1 | 0.88 | 0.89 |
| IGSF8 | 0.88 | 0.89 |
| Top 10 negatively co-expressed genes | ||
| Gene | Pearson's Correlation | Spearman's Correlation |
| GNG11 | -0.45 | -0.41 |
| AF347015.21 | -0.44 | -0.27 |
| AF347015.18 | -0.43 | -0.27 |
| AP002478.3 | -0.43 | -0.39 |
| FAM159B | -0.43 | -0.63 |
| RAB13 | -0.42 | -0.50 |
| NSBP1 | -0.42 | -0.41 |
| AL139819.3 | -0.41 | -0.39 |
| MYL12A | -0.41 | -0.44 |
| AL050337.1 | -0.40 | -0.39 |
Section V. Pathway annotation
| Pathway name | Pathway size | # SZGR 2.0 genes in pathway | Info |
|---|---|---|---|
| OSMAN BLADDER CANCER DN | 406 | 230 | All SZGR 2.0 genes in this pathway |
| PATIL LIVER CANCER | 747 | 453 | All SZGR 2.0 genes in this pathway |
| DACOSTA UV RESPONSE VIA ERCC3 DN | 855 | 609 | All SZGR 2.0 genes in this pathway |
| PUJANA ATM PCC NETWORK | 1442 | 892 | All SZGR 2.0 genes in this pathway |
| BUYTAERT PHOTODYNAMIC THERAPY STRESS UP | 811 | 508 | All SZGR 2.0 genes in this pathway |
| KOYAMA SEMA3B TARGETS UP | 292 | 168 | All SZGR 2.0 genes in this pathway |
| SHEN SMARCA2 TARGETS UP | 424 | 268 | All SZGR 2.0 genes in this pathway |
| CUI TCF21 TARGETS 2 DN | 830 | 547 | All SZGR 2.0 genes in this pathway |
| KRIGE RESPONSE TO TOSEDOSTAT 6HR UP | 953 | 554 | All SZGR 2.0 genes in this pathway |
| KRIGE RESPONSE TO TOSEDOSTAT 24HR UP | 783 | 442 | All SZGR 2.0 genes in this pathway |
| MITSIADES RESPONSE TO APLIDIN UP | 439 | 257 | All SZGR 2.0 genes in this pathway |
| BOQUEST STEM CELL DN | 216 | 143 | All SZGR 2.0 genes in this pathway |
| VERHAAK GLIOBLASTOMA CLASSICAL | 162 | 122 | All SZGR 2.0 genes in this pathway |
| PILON KLF1 TARGETS UP | 504 | 321 | All SZGR 2.0 genes in this pathway |
| PILON KLF1 TARGETS DN | 1972 | 1213 | All SZGR 2.0 genes in this pathway |