Gene Page: IFT140
Summary ?
| GeneID | 9742 |
| Symbol | IFT140 |
| Synonyms | MZSDS|SRTD9|WDTC2|c305C8.4|c380F5.1|gs114 |
| Description | intraflagellar transport 140 |
| Reference | MIM:614620|HGNC:HGNC:29077|Ensembl:ENSG00000187535|HPRD:11093|Vega:OTTHUMG00000128585 |
| Gene type | protein-coding |
| Map location | 16p13.3 |
| Pascal p-value | 0.864 |
| Fetal beta | 0.343 |
| Support | CompositeSet |
Gene in Data Sources
| Gene set name | Method of gene set | Description | Info |
|---|---|---|---|
| CV:PGCnp | Genome-wide Association Study | GWAS | |
| DMG:Wockner_2014 | Genome-wide DNA methylation analysis | This dataset includes 4641 differentially methylated probes corresponding to 2929 unique genes between schizophrenia patients (n=24) and controls (n=24). | 2 |
| DNM:Xu_2012 | Whole Exome Sequencing analysis | De novo mutations of 4 genes were identified by exome sequencing of 795 samples in this study |
Section I. Genetics and epigenetics annotation
 DNM table
| Gene | Chromosome | Position | Ref | Alt | Transcript | AA change | Mutation type | Sift | CG46 | Trait | Study |
|---|---|---|---|---|---|---|---|---|---|---|---|
| IFT140 | chr16 | 1607967 | C | T | NM_014714 | p.790E>K | missense | Schizophrenia | DNM:Xu_2012 |
Differentially methylated gene
| Probe | Chromosome | Position | Nearest gene | P (dis) | Beta (dis) | FDR (dis) | Study |
|---|---|---|---|---|---|---|---|
| cg10465839 | 16 | 1584050 | IFT140;TMEM204 | 1.313E-4 | 0.362 | 0.03 | DMG:Wockner_2014 |
| cg08006309 | 16 | 1587810 | IFT140;TMEM204 | 2.733E-4 | 0.409 | 0.038 | DMG:Wockner_2014 |
Section II. Transcriptome annotation
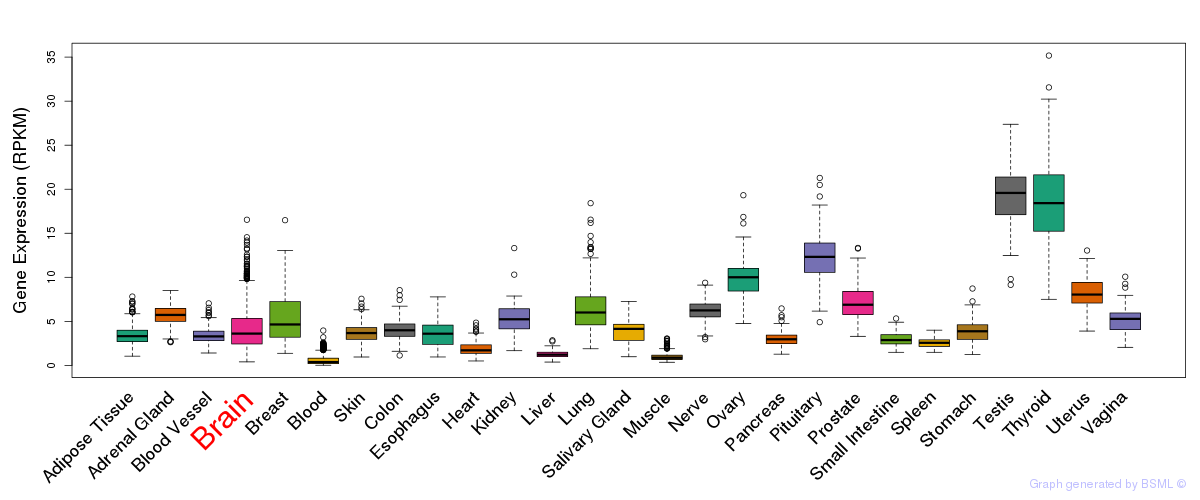
General gene expression (GTEx)
Gene expression during devlopment (BrainCloud)
Footnote:
A total of 269 time points ploted, with n=38 fetal samples (x=1:38). Each triangle represents one time point.
Gene expression of temporal and spatial changes (BrainSpan)
Footnote:
SC: sub-cortical regions; SM: sensory-motor regions; FC: frontal cortex; and TP: temporal-parietal cortex
ST1: fetal (13 - 26 postconception weeks), ST2: early infancy to late childhood (4 months to 11 years), and ST3: adolescence to adulthood (13 - 23 years)
The bar shown representes the lower 25% and upper 25% of the expression distribution.
Top co-expressed genes in brain regions
| Top 10 positively co-expressed genes | ||
| Gene | Pearson's Correlation | Spearman's Correlation |
| RP11-791G16.2 | 0.88 | 0.89 |
| L3MBTL3 | 0.87 | 0.89 |
| MGEA5 | 0.87 | 0.90 |
| KLF6 | 0.86 | 0.87 |
| SLC44A5 | 0.86 | 0.86 |
| ZBTB8B | 0.85 | 0.81 |
| HMGCS1 | 0.85 | 0.92 |
| GNE | 0.85 | 0.89 |
| HMGCR | 0.84 | 0.89 |
| RNF19A | 0.84 | 0.87 |
| Top 10 negatively co-expressed genes | ||
| Gene | Pearson's Correlation | Spearman's Correlation |
| AF347015.31 | -0.66 | -0.78 |
| FXYD1 | -0.65 | -0.76 |
| AF347015.27 | -0.64 | -0.75 |
| TSC22D4 | -0.64 | -0.70 |
| MT-CO2 | -0.64 | -0.77 |
| REEP6 | -0.63 | -0.57 |
| AF347015.33 | -0.63 | -0.73 |
| AIFM3 | -0.63 | -0.64 |
| S100B | -0.63 | -0.71 |
| HLA-F | -0.62 | -0.63 |
Section V. Pathway annotation
| Pathway name | Pathway size | # SZGR 2.0 genes in pathway | Info |
|---|---|---|---|
| PARENT MTOR SIGNALING UP | 567 | 375 | All SZGR 2.0 genes in this pathway |
| CHEMNITZ RESPONSE TO PROSTAGLANDIN E2 DN | 391 | 222 | All SZGR 2.0 genes in this pathway |
| DODD NASOPHARYNGEAL CARCINOMA UP | 1821 | 933 | All SZGR 2.0 genes in this pathway |
| GARCIA TARGETS OF FLI1 AND DAX1 UP | 57 | 34 | All SZGR 2.0 genes in this pathway |
| NIKOLSKY BREAST CANCER 16P13 AMPLICON | 120 | 49 | All SZGR 2.0 genes in this pathway |
| HELLER HDAC TARGETS UP | 317 | 208 | All SZGR 2.0 genes in this pathway |
| SMID BREAST CANCER BASAL DN | 701 | 446 | All SZGR 2.0 genes in this pathway |
| POOLA INVASIVE BREAST CANCER DN | 134 | 83 | All SZGR 2.0 genes in this pathway |
| PILON KLF1 TARGETS DN | 1972 | 1213 | All SZGR 2.0 genes in this pathway |
| WAKABAYASHI ADIPOGENESIS PPARG BOUND 8D | 658 | 397 | All SZGR 2.0 genes in this pathway |