Gene Page: RIMS3
Summary ?
| GeneID | 9783 |
| Symbol | RIMS3 |
| Synonyms | NIM3|RIM3 |
| Description | regulating synaptic membrane exocytosis 3 |
| Reference | MIM:611600|HGNC:HGNC:21292|Ensembl:ENSG00000117016|HPRD:17976|Vega:OTTHUMG00000007453 |
| Gene type | protein-coding |
| Map location | 1p34.2 |
| Pascal p-value | 0.02 |
| Sherlock p-value | 0.97 |
| Fetal beta | -2.045 |
| DMG | 1 (# studies) |
| Support | EXOCYTOSIS |
Gene in Data Sources
| Gene set name | Method of gene set | Description | Info |
|---|---|---|---|
| CV:PGCnp | Genome-wide Association Study | GWAS | |
| DMG:Wockner_2014 | Genome-wide DNA methylation analysis | This dataset includes 4641 differentially methylated probes corresponding to 2929 unique genes between schizophrenia patients (n=24) and controls (n=24). | 1 |
| PMID:cooccur | High-throughput literature-search | Systematic search in PubMed for genes co-occurring with SCZ keywords. A total of 3027 genes were included. | |
| Literature | High-throughput literature-search | Co-occurance with Schizophrenia keywords: schizophrenia,schizophrenias | Click to show details |
| GO_Annotation | Mapping neuro-related keywords to Gene Ontology annotations | Hits with neuro-related keywords: 1 |
Section I. Genetics and epigenetics annotation
 Differentially methylated gene
| Probe | Chromosome | Position | Nearest gene | P (dis) | Beta (dis) | FDR (dis) | Study |
|---|---|---|---|---|---|---|---|
| cg07244188 | 1 | 41114200 | RIMS3 | 2.046E-4 | 0.53 | 0.035 | DMG:Wockner_2014 |
Section II. Transcriptome annotation
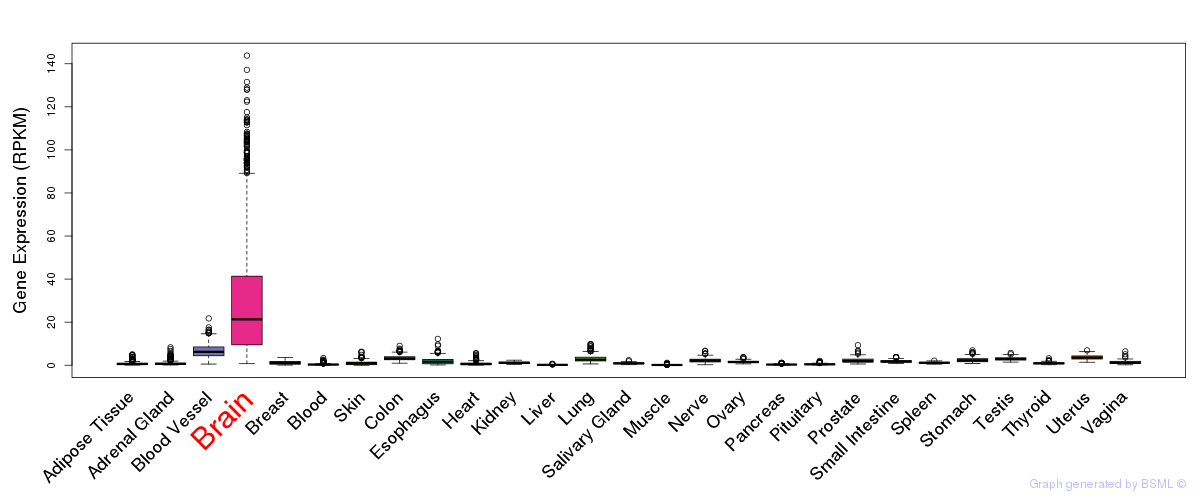
General gene expression (GTEx)
Gene expression during devlopment (BrainCloud)
Footnote:
A total of 269 time points ploted, with n=38 fetal samples (x=1:38). Each triangle represents one time point.
Gene expression of temporal and spatial changes (BrainSpan)
Footnote:
SC: sub-cortical regions; SM: sensory-motor regions; FC: frontal cortex; and TP: temporal-parietal cortex
ST1: fetal (13 - 26 postconception weeks), ST2: early infancy to late childhood (4 months to 11 years), and ST3: adolescence to adulthood (13 - 23 years)
The bar shown representes the lower 25% and upper 25% of the expression distribution.
Top co-expressed genes in brain regions
| Top 10 positively co-expressed genes | ||
| Gene | Pearson's Correlation | Spearman's Correlation |
| KIAA0100 | 0.91 | 0.90 |
| NPLOC4 | 0.90 | 0.88 |
| CLCN6 | 0.90 | 0.89 |
| TRAPPC10 | 0.90 | 0.90 |
| CYFIP2 | 0.90 | 0.92 |
| LONP2 | 0.90 | 0.87 |
| FBXW11 | 0.89 | 0.87 |
| RAB5B | 0.89 | 0.87 |
| NARS | 0.89 | 0.85 |
| CNNM2 | 0.89 | 0.88 |
| Top 10 negatively co-expressed genes | ||
| Gene | Pearson's Correlation | Spearman's Correlation |
| AF347015.21 | -0.71 | -0.58 |
| GNG11 | -0.64 | -0.56 |
| IL32 | -0.63 | -0.54 |
| VAMP5 | -0.63 | -0.53 |
| C1orf54 | -0.63 | -0.60 |
| FXYD1 | -0.63 | -0.53 |
| AP002478.3 | -0.63 | -0.57 |
| MT-CO2 | -0.62 | -0.52 |
| HIGD1B | -0.62 | -0.55 |
| AC098691.2 | -0.61 | -0.52 |
Section III. Gene Ontology annotation
| Molecular function | GO term | Evidence | Neuro keywords | PubMed ID |
|---|---|---|---|---|
| GO:0004553 | hydrolase activity, hydrolyzing O-glycosyl compounds | IEA | - | |
| Biological process | GO term | Evidence | Neuro keywords | PubMed ID |
| GO:0006836 | neurotransmitter transport | IEA | neuron, Neurotransmitter (GO term level: 5) | - |
| GO:0005975 | carbohydrate metabolic process | IEA | - | |
| GO:0006887 | exocytosis | IEA | - | |
| Cellular component | GO term | Evidence | Neuro keywords | PubMed ID |
| GO:0045202 | synapse | IEA | neuron, Synap, Neurotransmitter, Glial (GO term level: 2) | - |
| GO:0030054 | cell junction | IEA | - |
Section V. Pathway annotation
| Pathway name | Pathway size | # SZGR 2.0 genes in pathway | Info |
|---|---|---|---|
| GARY CD5 TARGETS UP | 473 | 314 | All SZGR 2.0 genes in this pathway |
| VECCHI GASTRIC CANCER EARLY DN | 367 | 220 | All SZGR 2.0 genes in this pathway |
| LASTOWSKA NEUROBLASTOMA COPY NUMBER DN | 800 | 473 | All SZGR 2.0 genes in this pathway |
| ONDER CDH1 TARGETS 2 DN | 464 | 276 | All SZGR 2.0 genes in this pathway |
| PENG LEUCINE DEPRIVATION UP | 142 | 93 | All SZGR 2.0 genes in this pathway |
| HADDAD B LYMPHOCYTE PROGENITOR | 293 | 193 | All SZGR 2.0 genes in this pathway |
| BASSO CD40 SIGNALING DN | 68 | 44 | All SZGR 2.0 genes in this pathway |
| DEBIASI APOPTOSIS BY REOVIRUS INFECTION DN | 287 | 208 | All SZGR 2.0 genes in this pathway |
| WANG LSD1 TARGETS DN | 39 | 30 | All SZGR 2.0 genes in this pathway |
| RAY TUMORIGENESIS BY ERBB2 CDC25A DN | 159 | 105 | All SZGR 2.0 genes in this pathway |
| LEE INTRATHYMIC T PROGENITOR | 21 | 14 | All SZGR 2.0 genes in this pathway |
| SHEDDEN LUNG CANCER GOOD SURVIVAL A4 | 196 | 124 | All SZGR 2.0 genes in this pathway |
| KIM ALL DISORDERS OLIGODENDROCYTE NUMBER CORR UP | 756 | 494 | All SZGR 2.0 genes in this pathway |
| KIM BIPOLAR DISORDER OLIGODENDROCYTE DENSITY CORR UP | 682 | 440 | All SZGR 2.0 genes in this pathway |
| ROLEF GLIS3 TARGETS | 37 | 29 | All SZGR 2.0 genes in this pathway |
Section VI. microRNA annotation
| miRNA family | Target position | miRNA ID | miRNA seq | ||
|---|---|---|---|---|---|
| UTR start | UTR end | Match method | |||
| miR-103/107 | 103 | 109 | 1A | hsa-miR-103brain | AGCAGCAUUGUACAGGGCUAUGA |
| hsa-miR-107brain | AGCAGCAUUGUACAGGGCUAUCA | ||||
| miR-128 | 3797 | 3803 | m8 | hsa-miR-128a | UCACAGUGAACCGGUCUCUUUU |
| hsa-miR-128b | UCACAGUGAACCGGUCUCUUUC | ||||
| miR-137 | 5618 | 5624 | m8 | hsa-miR-137 | UAUUGCUUAAGAAUACGCGUAG |
| hsa-miR-137 | UAUUGCUUAAGAAUACGCGUAG | ||||
| miR-138 | 1185 | 1191 | m8 | hsa-miR-138brain | AGCUGGUGUUGUGAAUC |
| miR-182 | 5745 | 5751 | m8 | hsa-miR-182 | UUUGGCAAUGGUAGAACUCACA |
| miR-214 | 101 | 107 | m8 | hsa-miR-214brain | ACAGCAGGCACAGACAGGCAG |
| miR-218 | 3594 | 3600 | 1A | hsa-miR-218brain | UUGUGCUUGAUCUAACCAUGU |
| hsa-miR-218brain | UUGUGCUUGAUCUAACCAUGU | ||||
| miR-221/222 | 613 | 620 | 1A,m8 | hsa-miR-221brain | AGCUACAUUGUCUGCUGGGUUUC |
| hsa-miR-222brain | AGCUACAUCUGGCUACUGGGUCUC | ||||
| hsa-miR-221brain | AGCUACAUUGUCUGCUGGGUUUC | ||||
| hsa-miR-222brain | AGCUACAUCUGGCUACUGGGUCUC | ||||
| hsa-miR-221brain | AGCUACAUUGUCUGCUGGGUUUC | ||||
| hsa-miR-222brain | AGCUACAUCUGGCUACUGGGUCUC | ||||
| hsa-miR-221brain | AGCUACAUUGUCUGCUGGGUUUC | ||||
| hsa-miR-222brain | AGCUACAUCUGGCUACUGGGUCUC | ||||
| miR-31 | 5743 | 5750 | 1A,m8 | hsa-miR-31 | AGGCAAGAUGCUGGCAUAGCUG |
| miR-324-3p | 140 | 146 | m8 | hsa-miR-324-3p | CCACUGCCCCAGGUGCUGCUGG |
| miR-34/449 | 3511 | 3517 | 1A | hsa-miR-34abrain | UGGCAGUGUCUUAGCUGGUUGUU |
| hsa-miR-34c | AGGCAGUGUAGUUAGCUGAUUGC | ||||
| hsa-miR-449 | UGGCAGUGUAUUGUUAGCUGGU | ||||
| hsa-miR-449b | AGGCAGUGUAUUGUUAGCUGGC | ||||
| miR-493-5p | 5788 | 5794 | m8 | hsa-miR-493-5p | UUGUACAUGGUAGGCUUUCAUU |
| miR-9 | 4295 | 4301 | 1A | hsa-miR-9SZ | UCUUUGGUUAUCUAGCUGUAUGA |
| hsa-miR-9SZ | UCUUUGGUUAUCUAGCUGUAUGA | ||||
- SZ: miRNAs which differentially expressed in brain cortex of schizophrenia patients comparing with control samples using microarray. Click here to see the list of SZ related miRNAs.
- Brain: miRNAs which are expressed in brain based on miRNA microarray expression studies. Click here to see the list of brain related miRNAs.