Gene Page: PJA2
Summary ?
| GeneID | 9867 |
| Symbol | PJA2 |
| Synonyms | Neurodap1|RNF131 |
| Description | praja ring finger ubiquitin ligase 2 |
| Reference | HGNC:HGNC:17481|Ensembl:ENSG00000198961|HPRD:11436|Vega:OTTHUMG00000128750 |
| Gene type | protein-coding |
| Map location | 5q21.3 |
| Pascal p-value | 0.002 |
| Sherlock p-value | 0.23 |
| Fetal beta | -0.74 |
| DMG | 1 (# studies) |
| eGene | Meta |
| Support | CompositeSet Darnell FMRP targets |
Gene in Data Sources
| Gene set name | Method of gene set | Description | Info |
|---|---|---|---|
| CV:PGCnp | Genome-wide Association Study | GWAS | |
| DMG:Jaffe_2016 | Genome-wide DNA methylation analysis | This dataset includes 2,104 probes/CpGs associated with SZ patients (n=108) compared to 136 controls at Bonferroni-adjusted P < 0.05. | 1 |
| GO_Annotation | Mapping neuro-related keywords to Gene Ontology annotations | Hits with neuro-related keywords: 1 |
Section I. Genetics and epigenetics annotation
 Differentially methylated gene
| Probe | Chromosome | Position | Nearest gene | P (dis) | Beta (dis) | FDR (dis) | Study |
|---|---|---|---|---|---|---|---|
| cg09725147 | 5 | 108745819 | PJA2 | 5.88E-8 | -0.012 | 1.49E-5 | DMG:Jaffe_2016 |
Section II. Transcriptome annotation
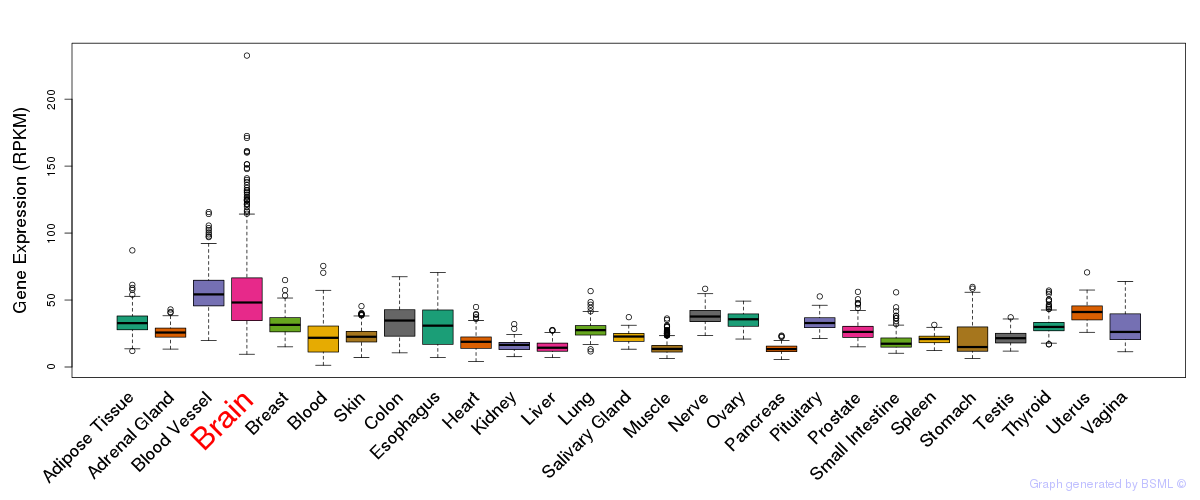
General gene expression (GTEx)
Gene expression during devlopment (BrainCloud)
Footnote:
A total of 269 time points ploted, with n=38 fetal samples (x=1:38). Each triangle represents one time point.
Gene expression of temporal and spatial changes (BrainSpan)
Footnote:
SC: sub-cortical regions; SM: sensory-motor regions; FC: frontal cortex; and TP: temporal-parietal cortex
ST1: fetal (13 - 26 postconception weeks), ST2: early infancy to late childhood (4 months to 11 years), and ST3: adolescence to adulthood (13 - 23 years)
The bar shown representes the lower 25% and upper 25% of the expression distribution.
Top co-expressed genes in brain regions
| Top 10 positively co-expressed genes | ||
| Gene | Pearson's Correlation | Spearman's Correlation |
| C7orf59 | 0.84 | 0.69 |
| NDUFV3 | 0.83 | 0.66 |
| C17orf90 | 0.83 | 0.63 |
| SNRNP25 | 0.82 | 0.63 |
| UCRC | 0.82 | 0.68 |
| AC040980.1 | 0.82 | 0.66 |
| ZFAND2A | 0.81 | 0.69 |
| TMEM141 | 0.81 | 0.57 |
| MDP1 | 0.81 | 0.66 |
| RPS19BP1 | 0.80 | 0.65 |
| Top 10 negatively co-expressed genes | ||
| Gene | Pearson's Correlation | Spearman's Correlation |
| KIF5B | -0.42 | -0.39 |
| ZNF652 | -0.39 | -0.38 |
| FAM107B | -0.38 | -0.37 |
| MAP4K4 | -0.38 | -0.36 |
| PICALM | -0.35 | -0.27 |
| CLIC4 | -0.35 | -0.35 |
| FMNL2 | -0.35 | -0.29 |
| TBC1D12 | -0.35 | -0.33 |
| LMAN1 | -0.34 | -0.29 |
| CWF19L2 | -0.34 | -0.39 |
Section III. Gene Ontology annotation
| Molecular function | GO term | Evidence | Neuro keywords | PubMed ID |
|---|---|---|---|---|
| GO:0005515 | protein binding | IEA | - | |
| GO:0016874 | ligase activity | IEA | - | |
| GO:0008270 | zinc ion binding | IEA | - | |
| GO:0046872 | metal ion binding | IEA | - | |
| Biological process | GO term | Evidence | Neuro keywords | PubMed ID |
| GO:0006511 | ubiquitin-dependent protein catabolic process | IEA | - | |
| Cellular component | GO term | Evidence | Neuro keywords | PubMed ID |
| GO:0045211 | postsynaptic membrane | IEA | Synap, Neurotransmitter (GO term level: 5) | - |
| GO:0045202 | synapse | IEA | neuron, Synap, Neurotransmitter, Glial (GO term level: 2) | - |
| GO:0000139 | Golgi membrane | IEA | - | |
| GO:0005794 | Golgi apparatus | IEA | - | |
| GO:0005789 | endoplasmic reticulum membrane | IEA | - | |
| GO:0005737 | cytoplasm | IEA | - | |
| GO:0005783 | endoplasmic reticulum | IEA | - | |
| GO:0005886 | plasma membrane | IEA | - | |
| GO:0030054 | cell junction | IEA | - |
Section V. Pathway annotation
| Pathway name | Pathway size | # SZGR 2.0 genes in pathway | Info |
|---|---|---|---|
| REACTOME IMMUNE SYSTEM | 933 | 616 | All SZGR 2.0 genes in this pathway |
| REACTOME ADAPTIVE IMMUNE SYSTEM | 539 | 350 | All SZGR 2.0 genes in this pathway |
| REACTOME CLASS I MHC MEDIATED ANTIGEN PROCESSING PRESENTATION | 251 | 156 | All SZGR 2.0 genes in this pathway |
| REACTOME ANTIGEN PROCESSING UBIQUITINATION PROTEASOME DEGRADATION | 212 | 129 | All SZGR 2.0 genes in this pathway |
| GARY CD5 TARGETS UP | 473 | 314 | All SZGR 2.0 genes in this pathway |
| DEURIG T CELL PROLYMPHOCYTIC LEUKEMIA DN | 320 | 184 | All SZGR 2.0 genes in this pathway |
| UDAYAKUMAR MED1 TARGETS UP | 135 | 82 | All SZGR 2.0 genes in this pathway |
| TIEN INTESTINE PROBIOTICS 24HR DN | 214 | 133 | All SZGR 2.0 genes in this pathway |
| KIM WT1 TARGETS 12HR UP | 162 | 116 | All SZGR 2.0 genes in this pathway |
| HAMAI APOPTOSIS VIA TRAIL UP | 584 | 356 | All SZGR 2.0 genes in this pathway |
| ABDULRAHMAN KIDNEY CANCER VHL DN | 14 | 9 | All SZGR 2.0 genes in this pathway |
| SCHLOSSER SERUM RESPONSE DN | 712 | 443 | All SZGR 2.0 genes in this pathway |
| DACOSTA UV RESPONSE VIA ERCC3 DN | 855 | 609 | All SZGR 2.0 genes in this pathway |
| DACOSTA UV RESPONSE VIA ERCC3 COMMON DN | 483 | 336 | All SZGR 2.0 genes in this pathway |
| MARTORIATI MDM4 TARGETS FETAL LIVER DN | 514 | 319 | All SZGR 2.0 genes in this pathway |
| NUYTTEN NIPP1 TARGETS DN | 848 | 527 | All SZGR 2.0 genes in this pathway |
| NUYTTEN EZH2 TARGETS DN | 1024 | 594 | All SZGR 2.0 genes in this pathway |
| BUYTAERT PHOTODYNAMIC THERAPY STRESS UP | 811 | 508 | All SZGR 2.0 genes in this pathway |
| SHEN SMARCA2 TARGETS UP | 424 | 268 | All SZGR 2.0 genes in this pathway |
| FLECHNER BIOPSY KIDNEY TRANSPLANT REJECTED VS OK DN | 546 | 351 | All SZGR 2.0 genes in this pathway |
| FLECHNER BIOPSY KIDNEY TRANSPLANT OK VS DONOR UP | 555 | 346 | All SZGR 2.0 genes in this pathway |
| JIANG HYPOXIA NORMAL | 311 | 205 | All SZGR 2.0 genes in this pathway |
| MARTINEZ RESPONSE TO TRABECTEDIN DN | 271 | 175 | All SZGR 2.0 genes in this pathway |
| DOUGLAS BMI1 TARGETS UP | 566 | 371 | All SZGR 2.0 genes in this pathway |
| BONOME OVARIAN CANCER SURVIVAL SUBOPTIMAL DEBULKING | 510 | 309 | All SZGR 2.0 genes in this pathway |
| MILI PSEUDOPODIA HAPTOTAXIS UP | 518 | 299 | All SZGR 2.0 genes in this pathway |
| KIM BIPOLAR DISORDER OLIGODENDROCYTE DENSITY CORR UP | 682 | 440 | All SZGR 2.0 genes in this pathway |
| KIM ALL DISORDERS CALB1 CORR UP | 548 | 370 | All SZGR 2.0 genes in this pathway |
Section VI. microRNA annotation
| miRNA family | Target position | miRNA ID | miRNA seq | ||
|---|---|---|---|---|---|
| UTR start | UTR end | Match method | |||
| miR-124.1 | 1455 | 1461 | 1A | hsa-miR-124a | UUAAGGCACGCGGUGAAUGCCA |
| miR-205 | 2152 | 2158 | m8 | hsa-miR-205 | UCCUUCAUUCCACCGGAGUCUG |
| miR-323 | 1387 | 1394 | 1A,m8 | hsa-miR-323brain | GCACAUUACACGGUCGACCUCU |
| miR-33 | 2396 | 2402 | 1A | hsa-miR-33 | GUGCAUUGUAGUUGCAUUG |
| hsa-miR-33b | GUGCAUUGCUGUUGCAUUGCA | ||||
| miR-363 | 65 | 71 | 1A | hsa-miR-363 | AUUGCACGGUAUCCAUCUGUAA |
| miR-380-5p | 1873 | 1879 | 1A | hsa-miR-380-5p | UGGUUGACCAUAGAACAUGCGC |
| hsa-miR-563 | AGGUUGACAUACGUUUCCC | ||||
| miR-410 | 75 | 81 | 1A | hsa-miR-410 | AAUAUAACACAGAUGGCCUGU |
| miR-455 | 1249 | 1256 | 1A,m8 | hsa-miR-455 | UAUGUGCCUUUGGACUACAUCG |
| miR-544 | 162 | 169 | 1A,m8 | hsa-miR-544 | AUUCUGCAUUUUUAGCAAGU |
| miR-9 | 1796 | 1802 | 1A | hsa-miR-9SZ | UCUUUGGUUAUCUAGCUGUAUGA |
- SZ: miRNAs which differentially expressed in brain cortex of schizophrenia patients comparing with control samples using microarray. Click here to see the list of SZ related miRNAs.
- Brain: miRNAs which are expressed in brain based on miRNA microarray expression studies. Click here to see the list of brain related miRNAs.