Gene Page: URB1
Summary ?
| GeneID | 9875 |
| Symbol | URB1 |
| Synonyms | C21orf108|NPA1 |
| Description | URB1 ribosome biogenesis 1 homolog (S. cerevisiae) |
| Reference | MIM:608865|HGNC:HGNC:17344|Ensembl:ENSG00000142207|Vega:OTTHUMG00000064919 |
| Gene type | protein-coding |
| Map location | 21q22.11 |
| Pascal p-value | 0.502 |
| Fetal beta | -0.757 |
| DMG | 1 (# studies) |
| eGene | Caudate basal ganglia Cortex |
| Support | CompositeSet Ascano FMRP targets |
Gene in Data Sources
| Gene set name | Method of gene set | Description | Info |
|---|---|---|---|
| DMG:Jaffe_2016 | Genome-wide DNA methylation analysis | This dataset includes 2,104 probes/CpGs associated with SZ patients (n=108) compared to 136 controls at Bonferroni-adjusted P < 0.05. | 1 |
| DNM:Fromer_2014 | Whole Exome Sequencing analysis | This study reported a WES study of 623 schizophrenia trios, reporting DNMs using genomic DNA. |
Section I. Genetics and epigenetics annotation
 DNM table
| Gene | Chromosome | Position | Ref | Alt | Transcript | AA change | Mutation type | Sift | CG46 | Trait | Study |
|---|---|---|---|---|---|---|---|---|---|---|---|
| URB1 | chr21 | 33688800 | C | T | NM_014825 | p.2204S>N | missense | Schizophrenia | DNM:Fromer_2014 |
Differentially methylated gene
| Probe | Chromosome | Position | Nearest gene | P (dis) | Beta (dis) | FDR (dis) | Study |
|---|---|---|---|---|---|---|---|
| cg08655493 | 21 | 33765248 | URB1 | 1.68E-8 | -0.013 | 6.13E-6 | DMG:Jaffe_2016 |
Section II. Transcriptome annotation
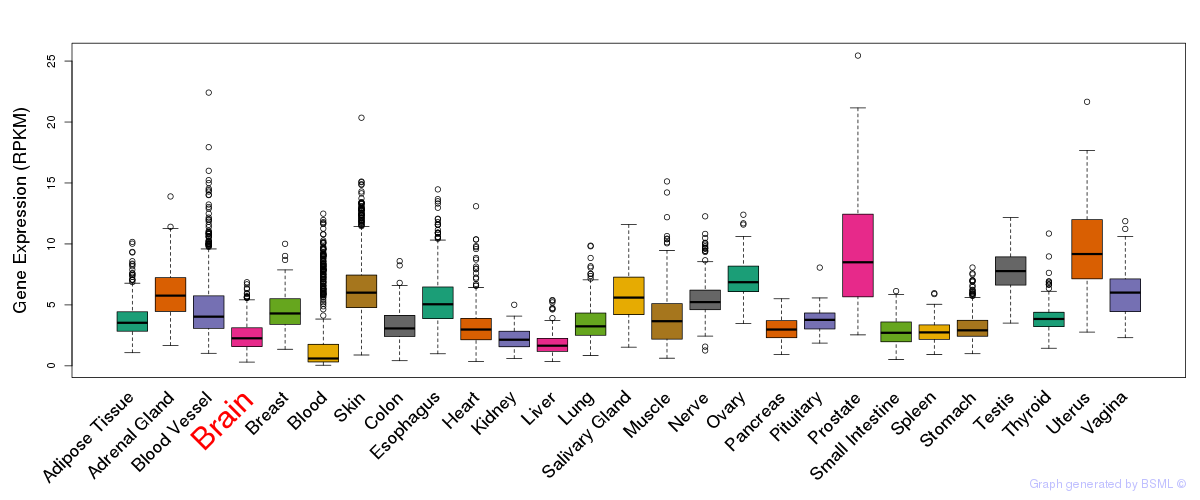
General gene expression (GTEx)
Gene expression during devlopment (BrainCloud)
Footnote:
A total of 269 time points ploted, with n=38 fetal samples (x=1:38). Each triangle represents one time point.
Gene expression of temporal and spatial changes (BrainSpan)
Footnote:
SC: sub-cortical regions; SM: sensory-motor regions; FC: frontal cortex; and TP: temporal-parietal cortex
ST1: fetal (13 - 26 postconception weeks), ST2: early infancy to late childhood (4 months to 11 years), and ST3: adolescence to adulthood (13 - 23 years)
The bar shown representes the lower 25% and upper 25% of the expression distribution.
Top co-expressed genes in brain regions
| Top 10 positively co-expressed genes | ||
| Gene | Pearson's Correlation | Spearman's Correlation |
| FBXL18 | 0.86 | 0.88 |
| BRI3BP | 0.85 | 0.86 |
| ABR | 0.84 | 0.85 |
| PIP5K1C | 0.84 | 0.84 |
| FMN2 | 0.84 | 0.85 |
| SPRY4 | 0.84 | 0.83 |
| TNFAIP8L1 | 0.83 | 0.81 |
| AC115090.1 | 0.83 | 0.84 |
| PER2 | 0.83 | 0.83 |
| DUSP7 | 0.83 | 0.84 |
| Top 10 negatively co-expressed genes | ||
| Gene | Pearson's Correlation | Spearman's Correlation |
| AF347015.21 | -0.53 | -0.50 |
| GNG11 | -0.51 | -0.52 |
| C1orf54 | -0.50 | -0.55 |
| DBI | -0.49 | -0.56 |
| AL050337.1 | -0.48 | -0.56 |
| AL139819.3 | -0.48 | -0.51 |
| SYCP3 | -0.48 | -0.53 |
| RPS27L | -0.47 | -0.51 |
| AP002478.3 | -0.46 | -0.47 |
| C8orf59 | -0.46 | -0.43 |
Section V. Pathway annotation
| Pathway name | Pathway size | # SZGR 2.0 genes in pathway | Info |
|---|---|---|---|
| ONKEN UVEAL MELANOMA UP | 783 | 507 | All SZGR 2.0 genes in this pathway |
| CHEMNITZ RESPONSE TO PROSTAGLANDIN E2 UP | 146 | 86 | All SZGR 2.0 genes in this pathway |
| PEREZ TP53 TARGETS | 1174 | 695 | All SZGR 2.0 genes in this pathway |
| PUJANA ATM PCC NETWORK | 1442 | 892 | All SZGR 2.0 genes in this pathway |
| MANALO HYPOXIA DN | 289 | 166 | All SZGR 2.0 genes in this pathway |
| BILD CTNNB1 ONCOGENIC SIGNATURE | 82 | 52 | All SZGR 2.0 genes in this pathway |
| KRIGE RESPONSE TO TOSEDOSTAT 6HR UP | 953 | 554 | All SZGR 2.0 genes in this pathway |
| KRIGE RESPONSE TO TOSEDOSTAT 24HR DN | 1011 | 592 | All SZGR 2.0 genes in this pathway |
| LEE BMP2 TARGETS DN | 882 | 538 | All SZGR 2.0 genes in this pathway |
| ZWANG TRANSIENTLY UP BY 2ND EGF PULSE ONLY | 1725 | 838 | All SZGR 2.0 genes in this pathway |