Gene Page: ZC3H11A
Summary ?
| GeneID | 9877 |
| Symbol | ZC3H11A |
| Synonyms | ZC3HDC11A |
| Description | zinc finger CCCH-type containing 11A |
| Reference | MIM:613513|HGNC:HGNC:29093|Ensembl:ENSG00000058673|HPRD:11100|Vega:OTTHUMG00000035909 |
| Gene type | protein-coding |
| Map location | 1q32.1 |
| Sherlock p-value | 0.149 |
| Fetal beta | 0.846 |
| DMG | 1 (# studies) |
Gene in Data Sources
| Gene set name | Method of gene set | Description | Info |
|---|---|---|---|
| CV:PGCnp | Genome-wide Association Study | GWAS | |
| DMG:Wockner_2014 | Genome-wide DNA methylation analysis | This dataset includes 4641 differentially methylated probes corresponding to 2929 unique genes between schizophrenia patients (n=24) and controls (n=24). | 1 |
Section I. Genetics and epigenetics annotation
 Differentially methylated gene
| Probe | Chromosome | Position | Nearest gene | P (dis) | Beta (dis) | FDR (dis) | Study |
|---|---|---|---|---|---|---|---|
| cg19751406 | 1 | 203764676 | ZC3H11A | 3.84E-4 | 0.554 | 0.043 | DMG:Wockner_2014 |
Section II. Transcriptome annotation
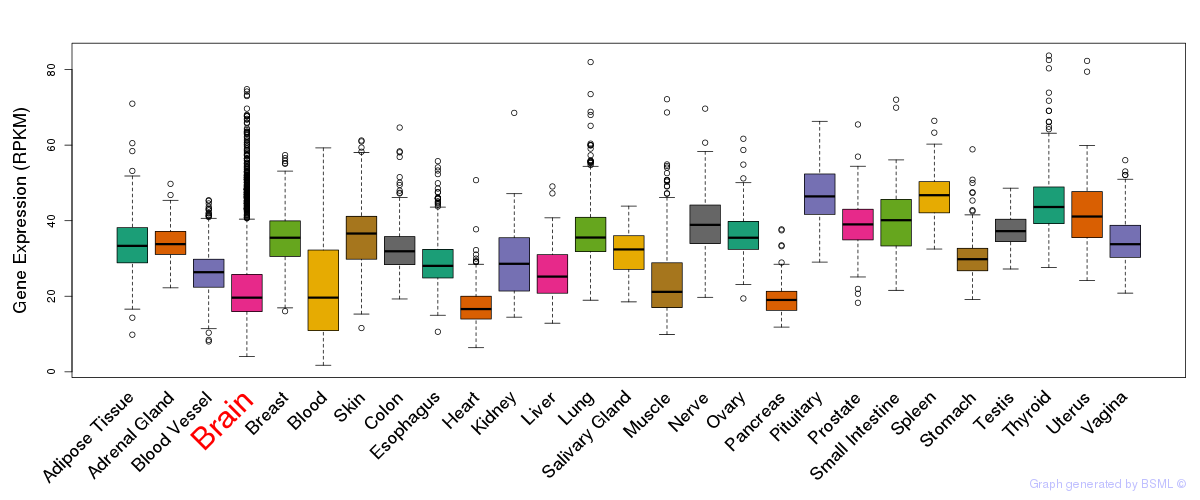
General gene expression (GTEx)
Gene expression during devlopment (BrainCloud)
Footnote:
A total of 269 time points ploted, with n=38 fetal samples (x=1:38). Each triangle represents one time point.
Gene expression of temporal and spatial changes (BrainSpan)
Footnote:
SC: sub-cortical regions; SM: sensory-motor regions; FC: frontal cortex; and TP: temporal-parietal cortex
ST1: fetal (13 - 26 postconception weeks), ST2: early infancy to late childhood (4 months to 11 years), and ST3: adolescence to adulthood (13 - 23 years)
The bar shown representes the lower 25% and upper 25% of the expression distribution.
Top co-expressed genes in brain regions
| Top 10 positively co-expressed genes | ||
| Gene | Pearson's Correlation | Spearman's Correlation |
| SEMA4G | 0.89 | 0.92 |
| FASN | 0.89 | 0.92 |
| DPYSL5 | 0.89 | 0.92 |
| FRMD4A | 0.87 | 0.89 |
| MMP24 | 0.87 | 0.92 |
| TRIM67 | 0.87 | 0.92 |
| MAPT | 0.87 | 0.91 |
| OSBPL5 | 0.87 | 0.92 |
| ZCCHC14 | 0.86 | 0.90 |
| PACS1 | 0.86 | 0.92 |
| Top 10 negatively co-expressed genes | ||
| Gene | Pearson's Correlation | Spearman's Correlation |
| HLA-F | -0.65 | -0.74 |
| C5orf53 | -0.65 | -0.75 |
| AF347015.31 | -0.65 | -0.86 |
| HEPN1 | -0.63 | -0.71 |
| TSC22D4 | -0.63 | -0.74 |
| AF347015.27 | -0.62 | -0.82 |
| MT-CO2 | -0.62 | -0.85 |
| COPZ2 | -0.62 | -0.79 |
| FXYD1 | -0.62 | -0.81 |
| AF347015.33 | -0.62 | -0.82 |
Section V. Pathway annotation
| Pathway name | Pathway size | # SZGR 2.0 genes in pathway | Info |
|---|---|---|---|
| ONKEN UVEAL MELANOMA UP | 783 | 507 | All SZGR 2.0 genes in this pathway |
| GARY CD5 TARGETS UP | 473 | 314 | All SZGR 2.0 genes in this pathway |
| BASAKI YBX1 TARGETS DN | 384 | 230 | All SZGR 2.0 genes in this pathway |
| SENESE HDAC3 TARGETS UP | 501 | 327 | All SZGR 2.0 genes in this pathway |
| DODD NASOPHARYNGEAL CARCINOMA DN | 1375 | 806 | All SZGR 2.0 genes in this pathway |
| GAUSSMANN MLL AF4 FUSION TARGETS C UP | 170 | 114 | All SZGR 2.0 genes in this pathway |
| STARK PREFRONTAL CORTEX 22Q11 DELETION UP | 195 | 138 | All SZGR 2.0 genes in this pathway |
| BYSTRYKH HEMATOPOIESIS STEM CELL QTL CIS | 128 | 77 | All SZGR 2.0 genes in this pathway |
| MARTINEZ RB1 TARGETS UP | 673 | 430 | All SZGR 2.0 genes in this pathway |
| MARTINEZ TP53 TARGETS UP | 602 | 364 | All SZGR 2.0 genes in this pathway |
| MARTINEZ RB1 AND TP53 TARGETS UP | 601 | 369 | All SZGR 2.0 genes in this pathway |
| ZHANG BREAST CANCER PROGENITORS DN | 145 | 93 | All SZGR 2.0 genes in this pathway |
| KASLER HDAC7 TARGETS 1 UP | 194 | 133 | All SZGR 2.0 genes in this pathway |