Gene Page: THRAP3
Summary ?
| GeneID | 9967 |
| Symbol | THRAP3 |
| Synonyms | TRAP150 |
| Description | thyroid hormone receptor associated protein 3 |
| Reference | MIM:603809|HGNC:HGNC:22964|Ensembl:ENSG00000054118|HPRD:07543|Vega:OTTHUMG00000007866 |
| Gene type | protein-coding |
| Map location | 1p34.3 |
| Pascal p-value | 0.182 |
| Fetal beta | -0.28 |
| Support | CompositeSet Ascano FMRP targets |
Gene in Data Sources
| Gene set name | Method of gene set | Description | Info |
|---|---|---|---|
| CV:PGCnp | Genome-wide Association Study | GWAS | |
| DNM:Fromer_2014 | Whole Exome Sequencing analysis | This study reported a WES study of 623 schizophrenia trios, reporting DNMs using genomic DNA. |
Section I. Genetics and epigenetics annotation
 DNM table
| Gene | Chromosome | Position | Ref | Alt | Transcript | AA change | Mutation type | Sift | CG46 | Trait | Study |
|---|---|---|---|---|---|---|---|---|---|---|---|
| THRAP3 | chr1 | 36752639 | G | A | NM_005119 | p.270V>M | missense | Schizophrenia | DNM:Fromer_2014 |
Section II. Transcriptome annotation
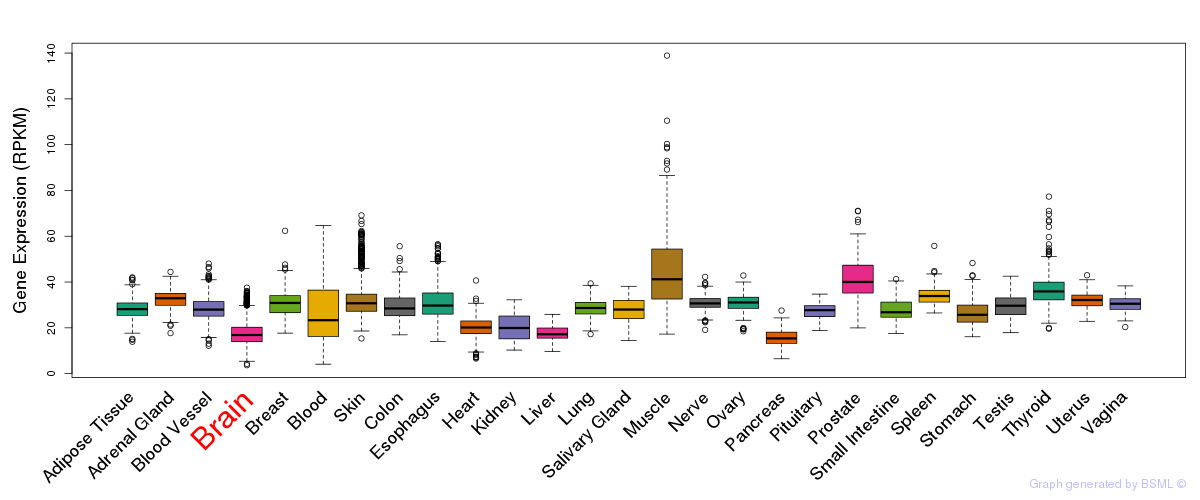
General gene expression (GTEx)
Gene expression during devlopment (BrainCloud)
Footnote:
A total of 269 time points ploted, with n=38 fetal samples (x=1:38). Each triangle represents one time point.
Gene expression of temporal and spatial changes (BrainSpan)
Footnote:
SC: sub-cortical regions; SM: sensory-motor regions; FC: frontal cortex; and TP: temporal-parietal cortex
ST1: fetal (13 - 26 postconception weeks), ST2: early infancy to late childhood (4 months to 11 years), and ST3: adolescence to adulthood (13 - 23 years)
The bar shown representes the lower 25% and upper 25% of the expression distribution.
Top co-expressed genes in brain regions
| Top 10 positively co-expressed genes | ||
| Gene | Pearson's Correlation | Spearman's Correlation |
| KIF2C | 0.99 | 0.79 |
| GTSE1 | 0.98 | 0.83 |
| NUSAP1 | 0.98 | 0.86 |
| HJURP | 0.98 | 0.86 |
| BUB1 | 0.98 | 0.86 |
| NCAPH | 0.98 | 0.80 |
| AURKB | 0.98 | 0.86 |
| GSG2 | 0.98 | 0.79 |
| TACC3 | 0.98 | 0.68 |
| KIF4A | 0.98 | 0.85 |
| Top 10 negatively co-expressed genes | ||
| Gene | Pearson's Correlation | Spearman's Correlation |
| FBXO2 | -0.39 | -0.71 |
| SLC9A3R2 | -0.39 | -0.48 |
| C5orf53 | -0.39 | -0.71 |
| HLA-F | -0.39 | -0.74 |
| PTH1R | -0.38 | -0.68 |
| ASPHD1 | -0.37 | -0.61 |
| ALDOC | -0.37 | -0.72 |
| LHPP | -0.37 | -0.63 |
| TNFSF12 | -0.37 | -0.68 |
| AIFM3 | -0.37 | -0.69 |
Section V. Pathway annotation
| Pathway name | Pathway size | # SZGR 2.0 genes in pathway | Info |
|---|---|---|---|
| SENGUPTA NASOPHARYNGEAL CARCINOMA WITH LMP1 UP | 408 | 247 | All SZGR 2.0 genes in this pathway |
| DOANE RESPONSE TO ANDROGEN UP | 184 | 125 | All SZGR 2.0 genes in this pathway |
| GRAESSMANN APOPTOSIS BY DOXORUBICIN DN | 1781 | 1082 | All SZGR 2.0 genes in this pathway |
| MCBRYAN PUBERTAL BREAST 5 6WK DN | 137 | 97 | All SZGR 2.0 genes in this pathway |
| LASTOWSKA NEUROBLASTOMA COPY NUMBER DN | 800 | 473 | All SZGR 2.0 genes in this pathway |
| MARTORIATI MDM4 TARGETS FETAL LIVER DN | 514 | 319 | All SZGR 2.0 genes in this pathway |
| SCHAEFFER PROSTATE DEVELOPMENT 6HR DN | 514 | 330 | All SZGR 2.0 genes in this pathway |
| BENPORATH MYC MAX TARGETS | 775 | 494 | All SZGR 2.0 genes in this pathway |
| BENPORATH CYCLING GENES | 648 | 385 | All SZGR 2.0 genes in this pathway |
| UEDA CENTRAL CLOCK | 88 | 62 | All SZGR 2.0 genes in this pathway |
| UEDA PERIFERAL CLOCK | 169 | 111 | All SZGR 2.0 genes in this pathway |
| NOUZOVA TRETINOIN AND H4 ACETYLATION | 143 | 85 | All SZGR 2.0 genes in this pathway |
| MARTINEZ RESPONSE TO TRABECTEDIN DN | 271 | 175 | All SZGR 2.0 genes in this pathway |
| MARTINEZ RB1 TARGETS UP | 673 | 430 | All SZGR 2.0 genes in this pathway |
| MARTINEZ TP53 TARGETS DN | 593 | 372 | All SZGR 2.0 genes in this pathway |
| MARTINEZ RB1 AND TP53 TARGETS DN | 591 | 366 | All SZGR 2.0 genes in this pathway |
| GRESHOCK CANCER COPY NUMBER UP | 323 | 240 | All SZGR 2.0 genes in this pathway |
| LEE RECENT THYMIC EMIGRANT | 227 | 128 | All SZGR 2.0 genes in this pathway |
| ZHANG TLX TARGETS 60HR DN | 277 | 166 | All SZGR 2.0 genes in this pathway |
| MILI PSEUDOPODIA CHEMOTAXIS DN | 457 | 302 | All SZGR 2.0 genes in this pathway |
| ROME INSULIN TARGETS IN MUSCLE UP | 442 | 263 | All SZGR 2.0 genes in this pathway |
| DANG BOUND BY MYC | 1103 | 714 | All SZGR 2.0 genes in this pathway |
| WHITFIELD CELL CYCLE G2 M | 216 | 124 | All SZGR 2.0 genes in this pathway |
| CHICAS RB1 TARGETS SENESCENT | 572 | 352 | All SZGR 2.0 genes in this pathway |
| PILON KLF1 TARGETS DN | 1972 | 1213 | All SZGR 2.0 genes in this pathway |