Gene Page: MYT1L
Summary ?
| GeneID | 23040 |
| Symbol | MYT1L |
| Synonyms | MRD39|NZF1|ZC2HC4B |
| Description | myelin transcription factor 1 like |
| Reference | MIM:613084|HGNC:HGNC:7623|Ensembl:ENSG00000186487|HPRD:14797|Vega:OTTHUMG00000151407 |
| Gene type | protein-coding |
| Map location | 2p25.3 |
| Pascal p-value | 0.027 |
| Fetal beta | 1.11 |
| DMG | 1 (# studies) |
| Support | CompositeSet Darnell FMRP targets |
Gene in Data Sources
| Gene set name | Method of gene set | Description | Info |
|---|---|---|---|
| CV:PGCnp | Genome-wide Association Study | GWAS | |
| CV:PheWAS | Phenome-wide association studies (PheWAS) | 157 SNPs associated with schizophrenia | 1 |
| DMG:Wockner_2014 | Genome-wide DNA methylation analysis | This dataset includes 4641 differentially methylated probes corresponding to 2929 unique genes between schizophrenia patients (n=24) and controls (n=24). | 2 |
| PMID:cooccur | High-throughput literature-search | Systematic search in PubMed for genes co-occurring with SCZ keywords. A total of 3027 genes were included. | |
| Literature | High-throughput literature-search | Co-occurance with Schizophrenia keywords: schizophrenia,schizophrenic,schizophrenias | Click to show details |
| GO_Annotation | Mapping neuro-related keywords to Gene Ontology annotations | Hits with neuro-related keywords: 1 |
Section I. Genetics and epigenetics annotation
 CV:PheWAS
| SNP ID | Chromosome | Position | Allele | P | Function | Gene | Up/Down Distance |
|---|---|---|---|---|---|---|---|
| rs2241685 | 2 | 1925993 | null | 1.785 | MYT1L | null |
Differentially methylated gene
| Probe | Chromosome | Position | Nearest gene | P (dis) | Beta (dis) | FDR (dis) | Study |
|---|---|---|---|---|---|---|---|
| cg10259427 | 2 | 1828377 | MYT1L | 8.78E-5 | 0.455 | 0.027 | DMG:Wockner_2014 |
| cg04369651 | 2 | 1821101 | MYT1L | 4.509E-4 | 0.386 | 0.045 | DMG:Wockner_2014 |
Section II. Transcriptome annotation
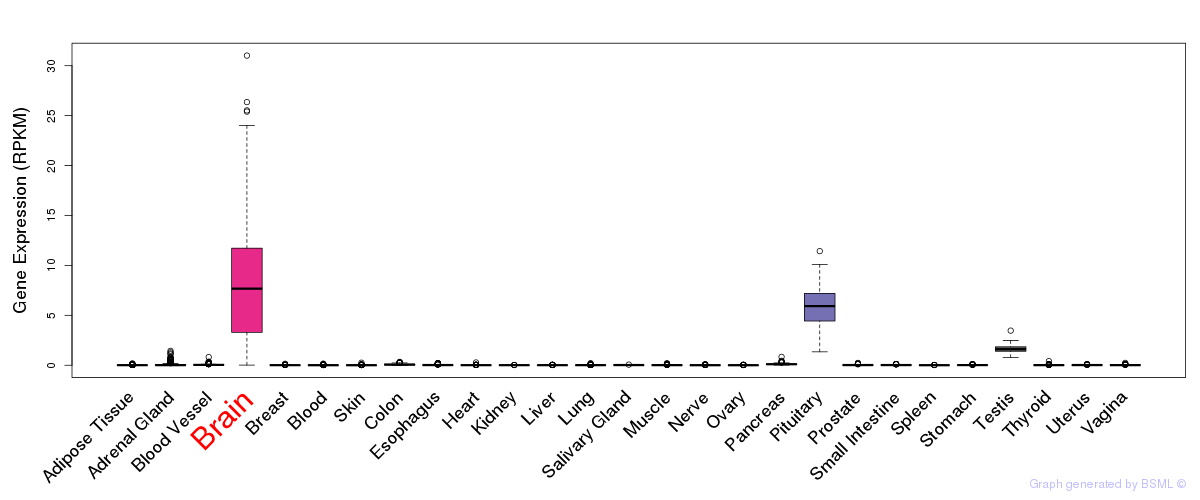
General gene expression (GTEx)
Gene expression during devlopment (BrainCloud)
Footnote:
A total of 269 time points ploted, with n=38 fetal samples (x=1:38). Each triangle represents one time point.
Gene expression of temporal and spatial changes (BrainSpan)
Footnote:
SC: sub-cortical regions; SM: sensory-motor regions; FC: frontal cortex; and TP: temporal-parietal cortex
ST1: fetal (13 - 26 postconception weeks), ST2: early infancy to late childhood (4 months to 11 years), and ST3: adolescence to adulthood (13 - 23 years)
The bar shown representes the lower 25% and upper 25% of the expression distribution.
Top co-expressed genes in brain regions
| Top 10 positively co-expressed genes | ||
| Gene | Pearson's Correlation | Spearman's Correlation |
| OSBPL1A | 0.90 | 0.87 |
| GABRA1 | 0.89 | 0.89 |
| GCNT4 | 0.89 | 0.77 |
| B4GALT6 | 0.89 | 0.85 |
| ATP6V1C1 | 0.89 | 0.88 |
| MAPK9 | 0.88 | 0.87 |
| PRKCB | 0.88 | 0.90 |
| IQWD1 | 0.88 | 0.88 |
| EPS15 | 0.88 | 0.82 |
| OXR1 | 0.88 | 0.88 |
| Top 10 negatively co-expressed genes | ||
| Gene | Pearson's Correlation | Spearman's Correlation |
| BCL7C | -0.53 | -0.58 |
| FADS2 | -0.51 | -0.44 |
| NME4 | -0.51 | -0.61 |
| HYAL2 | -0.49 | -0.52 |
| SEMA4B | -0.49 | -0.45 |
| GPR125 | -0.48 | -0.43 |
| FAM59B | -0.46 | -0.45 |
| TRAF4 | -0.46 | -0.47 |
| SH3BP2 | -0.46 | -0.50 |
| SH2D2A | -0.46 | -0.51 |
Section III. Gene Ontology annotation
| Molecular function | GO term | Evidence | Neuro keywords | PubMed ID |
|---|---|---|---|---|
| GO:0003700 | transcription factor activity | IEA | - | |
| GO:0008270 | zinc ion binding | IEA | - | |
| GO:0046872 | metal ion binding | IEA | - | |
| Biological process | GO term | Evidence | Neuro keywords | PubMed ID |
| GO:0007399 | nervous system development | IEA | neurite (GO term level: 5) | - |
| GO:0006355 | regulation of transcription, DNA-dependent | IEA | - | |
| GO:0006350 | transcription | IEA | - | |
| GO:0007275 | multicellular organismal development | IEA | - | |
| GO:0030154 | cell differentiation | IEA | - | |
| Cellular component | GO term | Evidence | Neuro keywords | PubMed ID |
| GO:0005634 | nucleus | IEA | - |
Section V. Pathway annotation
| Pathway name | Pathway size | # SZGR 2.0 genes in pathway | Info |
|---|---|---|---|
| HATADA METHYLATED IN LUNG CANCER DN | 38 | 13 | All SZGR 2.0 genes in this pathway |
| CHEN NEUROBLASTOMA COPY NUMBER GAINS | 50 | 35 | All SZGR 2.0 genes in this pathway |
| SANSOM APC TARGETS DN | 366 | 238 | All SZGR 2.0 genes in this pathway |
| BLALOCK ALZHEIMERS DISEASE DN | 1237 | 837 | All SZGR 2.0 genes in this pathway |
| PAL PRMT5 TARGETS DN | 29 | 16 | All SZGR 2.0 genes in this pathway |
| IWANAGA CARCINOGENESIS BY KRAS PTEN DN | 353 | 226 | All SZGR 2.0 genes in this pathway |
| ACEVEDO METHYLATED IN LIVER CANCER DN | 940 | 425 | All SZGR 2.0 genes in this pathway |
| YOSHIMURA MAPK8 TARGETS UP | 1305 | 895 | All SZGR 2.0 genes in this pathway |
| BRUINS UVC RESPONSE VIA TP53 GROUP A | 898 | 516 | All SZGR 2.0 genes in this pathway |
| ZWANG TRANSIENTLY UP BY 1ST EGF PULSE ONLY | 1839 | 928 | All SZGR 2.0 genes in this pathway |
Section VI. microRNA annotation
| miRNA family | Target position | miRNA ID | miRNA seq | ||
|---|---|---|---|---|---|
| UTR start | UTR end | Match method | |||
| miR-1/206 | 645 | 651 | 1A | hsa-miR-1 | UGGAAUGUAAAGAAGUAUGUA |
| hsa-miR-206SZ | UGGAAUGUAAGGAAGUGUGUGG | ||||
| hsa-miR-613 | AGGAAUGUUCCUUCUUUGCC | ||||
| miR-129-5p | 538 | 544 | m8 | hsa-miR-129brain | CUUUUUGCGGUCUGGGCUUGC |
| hsa-miR-129-5p | CUUUUUGCGGUCUGGGCUUGCU | ||||
| miR-135 | 714 | 720 | m8 | hsa-miR-135a | UAUGGCUUUUUAUUCCUAUGUGA |
| hsa-miR-135b | UAUGGCUUUUCAUUCCUAUGUG | ||||
| miR-141/200a | 108 | 115 | 1A,m8 | hsa-miR-141 | UAACACUGUCUGGUAAAGAUGG |
| hsa-miR-200a | UAACACUGUCUGGUAACGAUGU | ||||
| miR-15/16/195/424/497 | 53 | 59 | m8 | hsa-miR-15abrain | UAGCAGCACAUAAUGGUUUGUG |
| hsa-miR-16brain | UAGCAGCACGUAAAUAUUGGCG | ||||
| hsa-miR-15bbrain | UAGCAGCACAUCAUGGUUUACA | ||||
| hsa-miR-195SZ | UAGCAGCACAGAAAUAUUGGC | ||||
| hsa-miR-424 | CAGCAGCAAUUCAUGUUUUGAA | ||||
| hsa-miR-497 | CAGCAGCACACUGUGGUUUGU | ||||
| miR-17-5p/20/93.mr/106/519.d | 756 | 762 | m8 | hsa-miR-17-5p | CAAAGUGCUUACAGUGCAGGUAGU |
| hsa-miR-20abrain | UAAAGUGCUUAUAGUGCAGGUAG | ||||
| hsa-miR-106a | AAAAGUGCUUACAGUGCAGGUAGC | ||||
| hsa-miR-106bSZ | UAAAGUGCUGACAGUGCAGAU | ||||
| hsa-miR-20bSZ | CAAAGUGCUCAUAGUGCAGGUAG | ||||
| hsa-miR-519d | CAAAGUGCCUCCCUUUAGAGUGU | ||||
| miR-186 | 321 | 327 | m8 | hsa-miR-186 | CAAAGAAUUCUCCUUUUGGGCUU |
| miR-30-3p | 364 | 370 | m8 | hsa-miR-30a-3p | CUUUCAGUCGGAUGUUUGCAGC |
| hsa-miR-30e-3p | CUUUCAGUCGGAUGUUUACAGC | ||||
| miR-450 | 538 | 544 | 1A | hsa-miR-450 | UUUUUGCGAUGUGUUCCUAAUA |
| miR-494 | 516 | 522 | 1A | hsa-miR-494brain | UGAAACAUACACGGGAAACCUCUU |
| miR-495 | 594 | 600 | m8 | hsa-miR-495brain | AAACAAACAUGGUGCACUUCUUU |
| hsa-miR-495brain | AAACAAACAUGGUGCACUUCUUU | ||||
| miR-496 | 232 | 238 | m8 | hsa-miR-496 | AUUACAUGGCCAAUCUC |
| miR-93.hd/291-3p/294/295/302/372/373/520 | 755 | 761 | m8 | hsa-miR-93brain | AAAGUGCUGUUCGUGCAGGUAG |
| hsa-miR-302a | UAAGUGCUUCCAUGUUUUGGUGA | ||||
| hsa-miR-302b | UAAGUGCUUCCAUGUUUUAGUAG | ||||
| hsa-miR-302c | UAAGUGCUUCCAUGUUUCAGUGG | ||||
| hsa-miR-302d | UAAGUGCUUCCAUGUUUGAGUGU | ||||
| hsa-miR-372 | AAAGUGCUGCGACAUUUGAGCGU | ||||
| hsa-miR-373 | GAAGUGCUUCGAUUUUGGGGUGU | ||||
| hsa-miR-520e | AAAGUGCUUCCUUUUUGAGGG | ||||
| hsa-miR-520a | AAAGUGCUUCCCUUUGGACUGU | ||||
| hsa-miR-520b | AAAGUGCUUCCUUUUAGAGGG | ||||
| hsa-miR-520c | AAAGUGCUUCCUUUUAGAGGGUU | ||||
| hsa-miR-520d | AAAGUGCUUCUCUUUGGUGGGUU | ||||
- SZ: miRNAs which differentially expressed in brain cortex of schizophrenia patients comparing with control samples using microarray. Click here to see the list of SZ related miRNAs.
- Brain: miRNAs which are expressed in brain based on miRNA microarray expression studies. Click here to see the list of brain related miRNAs.