 |
| |
| |
| |
| |
| |
| |
|

| TissGeneSummary for APC2 |
 Gene summary Gene summary |
| Basic gene information | Gene symbol | APC2 |
| Gene name | adenomatosis polyposis coli 2 | |
| Synonyms | APCL | |
| Cytomap | UCSC genome browser: 19p13.3 | |
| Type of gene | protein-coding | |
| RefGenes | NM_005883.2, | |
| Description | adenomatous polyposis coli likeadenomatous polyposis coli protein 2 | |
| Modification date | 20141207 | |
| dbXrefs | MIM : 612034 | |
| HGNC : HGNC | ||
| Ensembl : ENSG00000115266 | ||
| HPRD : 09802 | ||
| Vega : OTTHUMG00000180059 | ||
| Protein | UniProt: go to UniProt's Cross Reference DB Table | |
| Expression | CleanEX: HS_APC2 | |
| BioGPS: 10297 | ||
| Pathway | NCI Pathway Interaction Database: APC2 | |
| KEGG: APC2 | ||
| REACTOME: APC2 | ||
| Pathway Commons: APC2 | ||
| Context | iHOP: APC2 | |
| ligand binding site mutation search in PubMed: APC2 | ||
| UCL Cancer Institute: APC2 | ||
| Assigned class in TissGDB* | C | |
| Included tissue-specific gene expression resources | HPA,TiGER | |
| Specific-tissues in normal samples (assigned by TissGDB using HPA, TiGER, and GTEx) | Brain | |
| Cancer types related to the specific-tissues in cancer samples (assigned by TissGDB using TCGA) | GBM,LGG | |
| Reference showing the relevant tissue of APC2 | ||
| Description by TissGene annotations | Protective TissGene in OS Protective TissGene in RFS Cancer gene Have significant anti-correlated miRNA Fused withTSGene | |
| * Class A consists of genes with literature evidence and is part of the cTissGenes. Class B consists of only cTissGenes without additional evidence. The remaining genes belong to Class C. |
| Gene ontology having evidence of Inferred from Direct Assay (IDA) from Entrez |
| GO ID | GO term | PubMed ID | GO:0035414 | negative regulation of catenin import into nucleus | 10021369 | GO:0090090 | negative regulation of canonical Wnt signaling pathway | 10021369 | GO:0035414 | negative regulation of catenin import into nucleus | 10021369 | GO:0090090 | negative regulation of canonical Wnt signaling pathway | 10021369 |
| Top |
| TissGeneExp for APC2 |
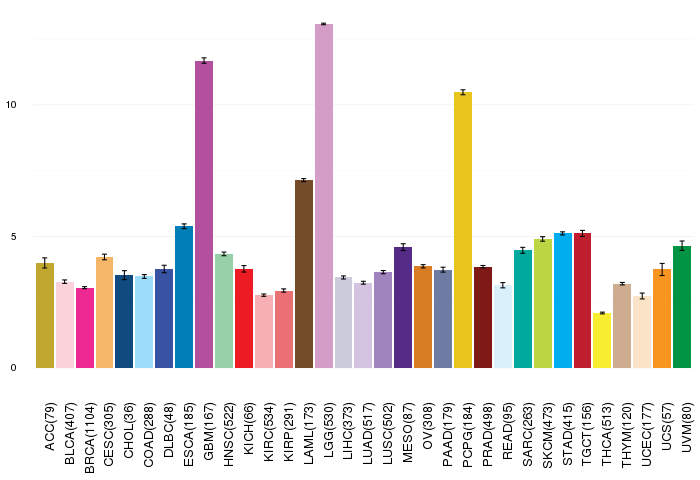
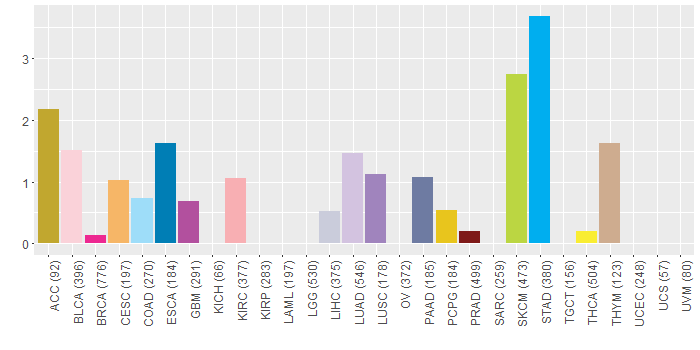
| Gene expressions across 28 cancer types (X-axis: cancer type and Y-axis: log2(norm_counts+1)) (TCGA IlluminaHiSeq_RNASeqV2, pan-cancer normalized log2(norm_counts+1) data, version 2016-08-16) |
 |
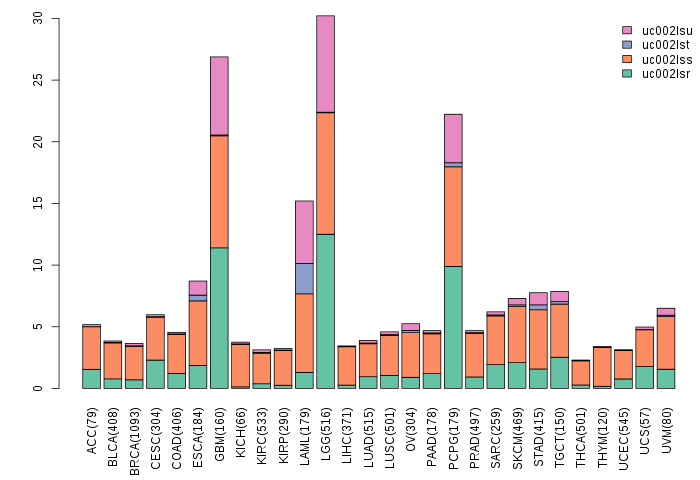
| Gene isoform expressions across 28 cancer types (X-axis: cancer type and Y-axis: log2(norm_counts+1)) (TCGA pan-cancer tcga_rsem_isoform_tpm, version 2016-09-01) |
 |
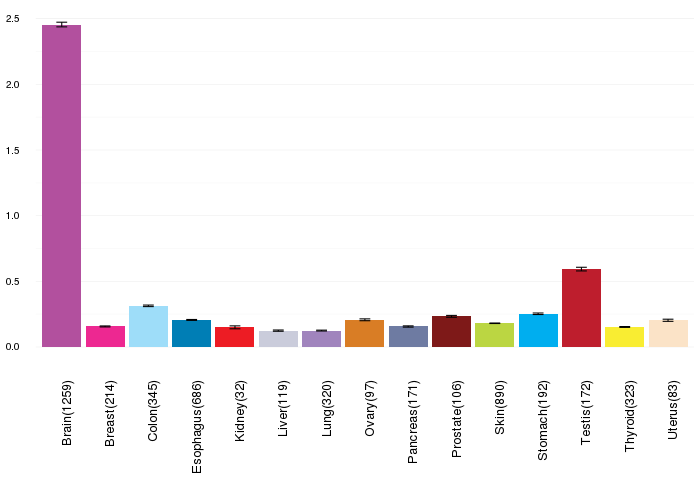
| Gene expressions across normal tissues of GTEx data (GTEx GTEx_Analysis_v6_RNA-seq_RNA-SeQCv1.1.8_gene_rpkm.gct) - Here, we shows the matched tissue types only among our 28 cancer types. |
 |
| Different expressions across 14 cancer types with more than 10 samples between matched tumors and normals (X-axis: cancer type and Y-axis: log2(norm_counts+1)) (TCGA IlluminaHiSeq_RNASeqV2, pan-cancer normalized log2(norm_counts+1) data, version 2016-08-16) |
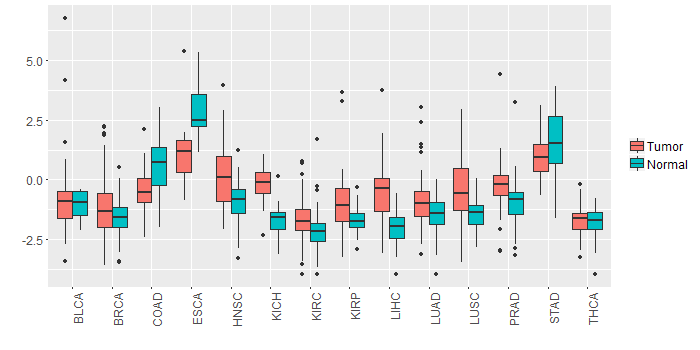 |
| - Significantly differentially expressed cancer types and information. (|Fold change|>1 and FDR<0.05) |
| Cancer type | Mean(exp) in tumor | Mean(exp) in matched normal | Log2FC | P-val. | FDR |
| KICH | -0.174873052 | -1.715897052 | 1.541024 | 6.81E-10 | 4.43E-09 |
| LUSC | -0.381708268 | -1.458706307 | 1.076998039 | 1.47E-06 | 3.60E-06 |
| LIHC | -0.583901052 | -2.080985052 | 1.497084 | 1.40E-09 | 1.49E-08 |
| COAD | -0.458149821 | 0.718223256 | -1.176373077 | 0.000333 | 0.00107137 |
| HNSC | 0.208823971 | -0.919227191 | 1.128051163 | 4.53E-05 | 0.000221576 |
| Top |
| TissGene-miRNA for APC2 |
| Significantly anti-correlated miRNAs of TissGene across 28 cancer types (Gene-miRNA relations from TargetScanHuman Relsease 7.1, Conserved_Site_Context_Scores.txt.zip, 06.01.2016) (TCGA IlluminaHiSeq_miRNASeq, log2(RPM+1) data, version 2016-11-21) (TCGA IlluminaHiSeq_RNASeqV2, log2(normalized_count+1) data, version 2016-08-16) (Spearman’s Rank Correlation (p-value<0.05 and coefficient<-0.25)) |
| Cancer type | miRNA id | miRNA accession | P-val. | Coeff. | # samples |
| UCS | hsa-let-7a-5p | MIMAT0000062 | 0.023 | -0.31 | 56 |
| Top |
| TissGeneMut for APC2 |
| TissGeneSNV for APC2 |
| nsSNV counts per each loci. Different colors of circles represent different cancer types. Circle size denotes number of samples. (TCGA somatic mutation (SNPs and small INDELs) data, version 2016-04-25) * Click on the image to enlarge it in a new window. |
 |
 |
| Somatic nucleotide variants of TissGene across 28 cancer types (X-axis: cancer type and Y-axis: % of mutated samples) The numbers in parentheses are numbers of samples with mutation (nsSNVs). (TCGA somatic mutation (SNPs and small INDELs) data, version 2016-04-25) |
 |
| - nsSNVs sorted by frequency. |
| AAchange | Cancer type | # samples |
| p.S561F | SKCM | 1 |
| p.H1527Q | KIRC | 1 |
| p.G323R | ACC | 1 |
| p.A595T | PRAD | 1 |
| p.I522T | PRAD | 1 |
| p.E1062Q | BLCA | 1 |
| p.T324I | THCA | 1 |
| p.R463H | COAD | 1 |
| p.P404L | THYM | 1 |
| p.R125W | KIRC | 1 |
| p.S217W | ESCA | 1 |
| p.G1723R | STAD | 1 |
| p.L159V | HNSC | 1 |
| p.A1044T | STAD | 1 |
| p.R201H | STAD | 1 |
| p.R1026W | STAD | 1 |
| p.E859K | SKCM | 1 |
| p.I512V | KIRC | 1 |
| p.V534L | BLCA | 1 |
| p.E1107K | SKCM | 1 |
| p.G1169C | STAD | 1 |
| p.H697Y | GBM | 1 |
| p.P1047L | SKCM | 1 |
| p.R655S | LUAD | 1 |
| p.A690T | STAD | 1 |
| p.A569T | CESC | 1 |
| p.G1783R | GBM | 1 |
| p.L1231M | STAD | 1 |
| p.S1873F | LUAD | 1 |
| p.V49I | LUSC | 1 |
| p.R908Q | STAD | 1 |
| p.L581M | LUAD | 1 |
| p.Y999* | SKCM | 1 |
| p.S952L | BLCA | 1 |
| p.K1760T | SKCM | 1 |
| p.G1763E | SKCM | 1 |
| p.T324I | ACC | 1 |
| p.D477E | HNSC | 1 |
| p.R1251Q | LUAD | 1 |
| p.V1124I | PAAD | 1 |
| p.Q1920R | LIHC | 1 |
| p.E367K | SKCM | 1 |
| p.G1306R | HNSC | 1 |
| p.Y999X | SKCM | 1 |
| p.A243V | MESO | 1 |
| p.R824Q | BRCA | 1 |
| p.G776S | SKCM | 1 |
| p.H506Q | LIHC | 1 |
| p.Q590* | LUAD | 1 |
| p.R369G | ESCA | 1 |
| p.R1249H | BLCA | 1 |
| p.R939H | STAD | 1 |
| p.R658C | SKCM | 1 |
| p.V63L | LUAD | 1 |
| p.K846T | SKCM | 1 |
| p.P253T | KIRC | 1 |
| p.A466V | STAD | 1 |
| p.K19E | PCPG | 1 |
| p.P884S | HNSC | 1 |
| p.P1208A | BLCA | 1 |
| p.C572Y | LUAD | 1 |
| p.D287N | BLCA | 1 |
| p.S2267L | LUSC | 1 |
| p.R823H | STAD | 1 |
| p.S119R | STAD | 1 |
| p.R1026Q | SKCM | 1 |
| p.D782G | STAD | 1 |
| p.L1788I | STAD | 1 |
| p.A297T | THYM | 1 |
| p.V1002M | COAD | 1 |
| p.A1219T | ESCA | 1 |
| p.T613I | STAD | 1 |
| p.V478I | STAD | 1 |
| p.N459S | SKCM | 1 |
| p.R1529H | PAAD | 1 |
| p.S1066L | HNSC | 1 |
| p.A657T | PAAD | 1 |
| p.S1767F | SKCM | 1 |
| p.N651T | STAD | 1 |
| p.Q267* | CESC | 1 |
| p.E882Q | HNSC | 1 |
| p.V709L | LUAD | 1 |
| Top |
| TissGeneCNV for APC2 |
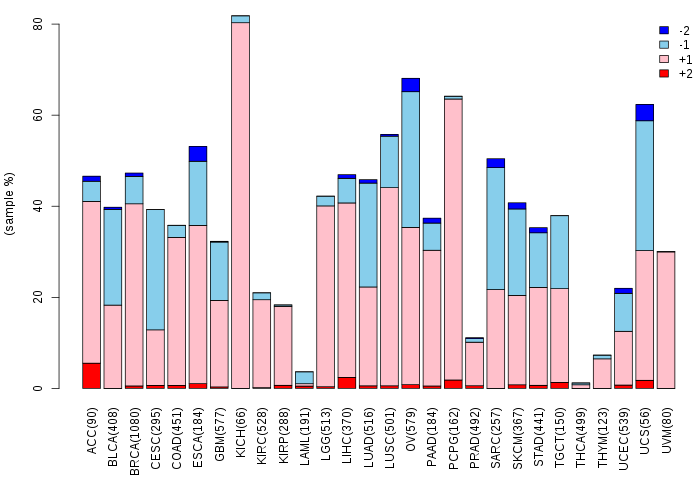
| Copy number variations of TissGene across 28 cancer types (X-axis: cancer type and Y-axis: % of CNV samples) (TCGA Gistic2_CopyNumber_Gistic2_all_data_by_genes, Gistic2 copy number data, version 2016-08-16) |
 |
| Top |
| TissGeneFusions for APC2 |
| Fusion genes including TissGene (ChimerDB 3.0, 2016-12-01 and TCGA fusion Portal 2015-12-01) |
| Database | Src | Cancer type | Sample | Fusion gene | ORF | 5'-gene BP | 3'-gene BP |
| TCGAfusionPortal | PRADA | LGG | TCGA-DH-5144-01A | APC2-GIGYF2 | NA | Chr19:1473237 | Chr2:233632812 |
| TCGAfusionPortal | PRADA | PRAD | TCGA-HC-7744-01A | TCF3-APC2 | CDS-5UTR | Chr19:1619110 | Chr19:1452983 |
| Top |
| TissGeneNet for APC2 |
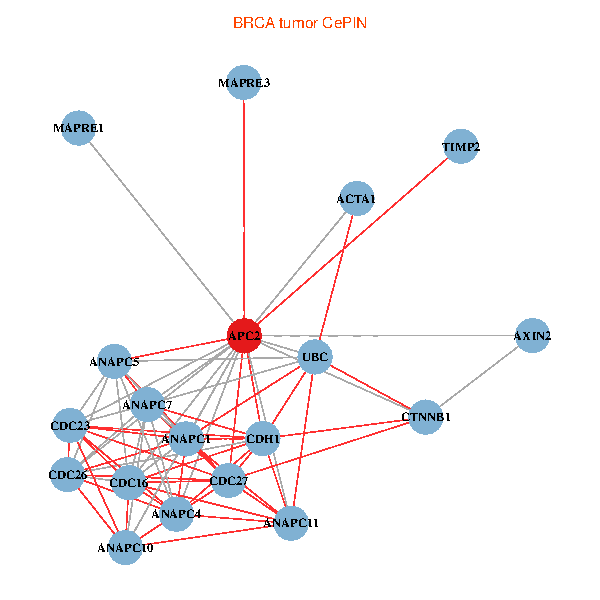
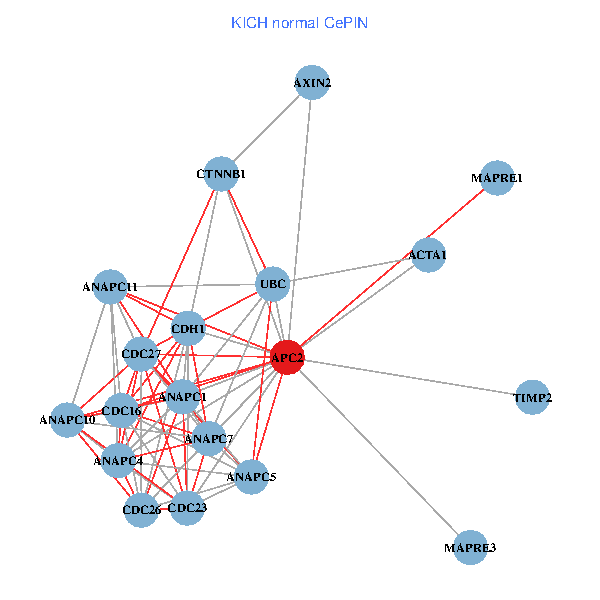
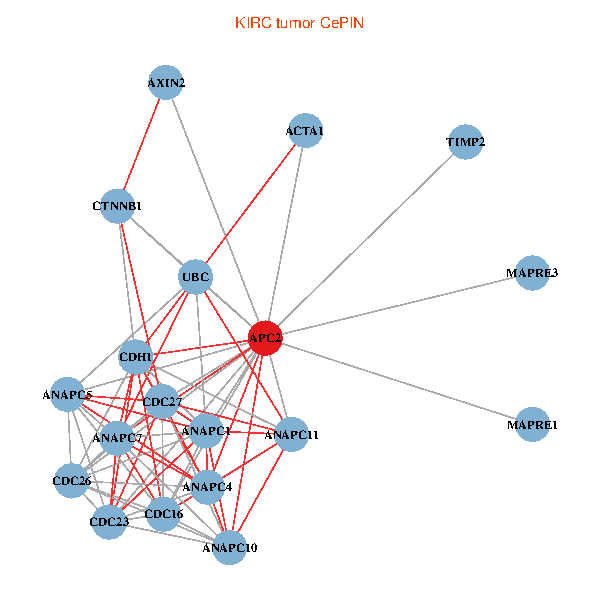
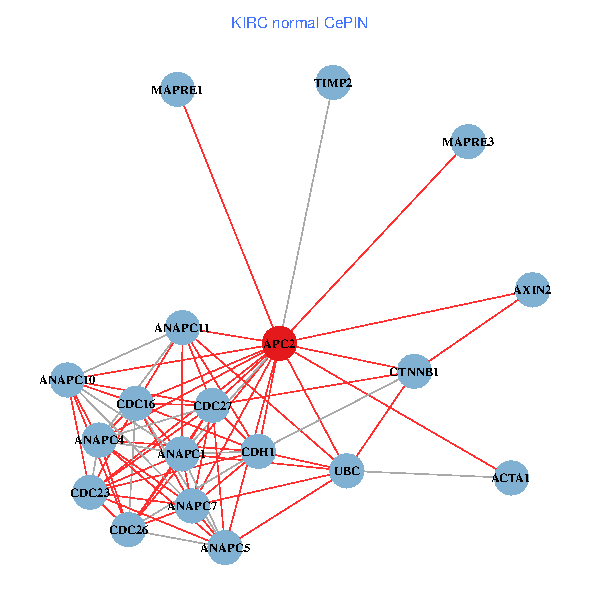
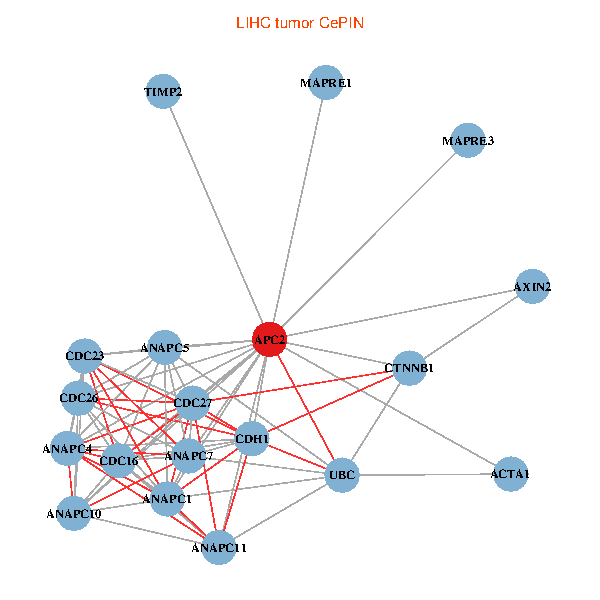
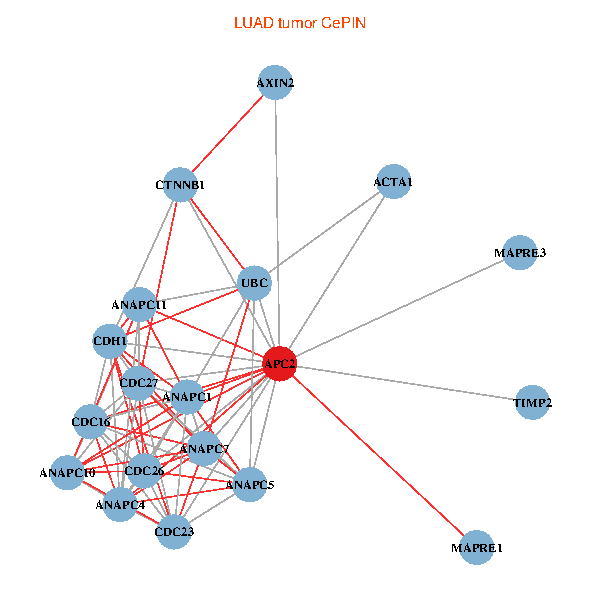
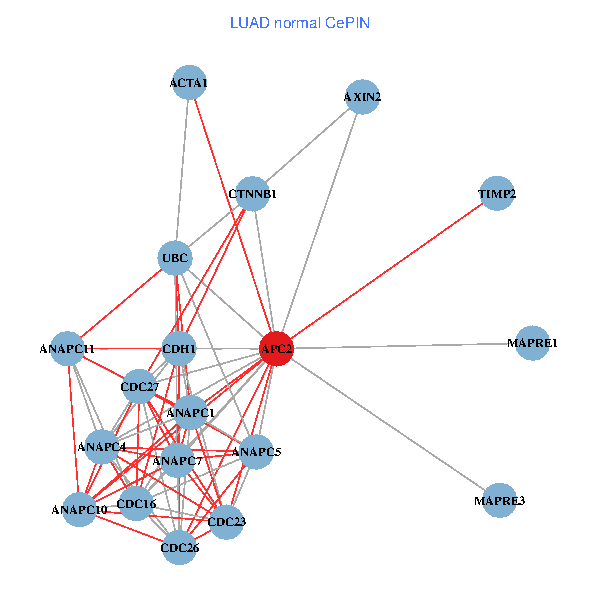
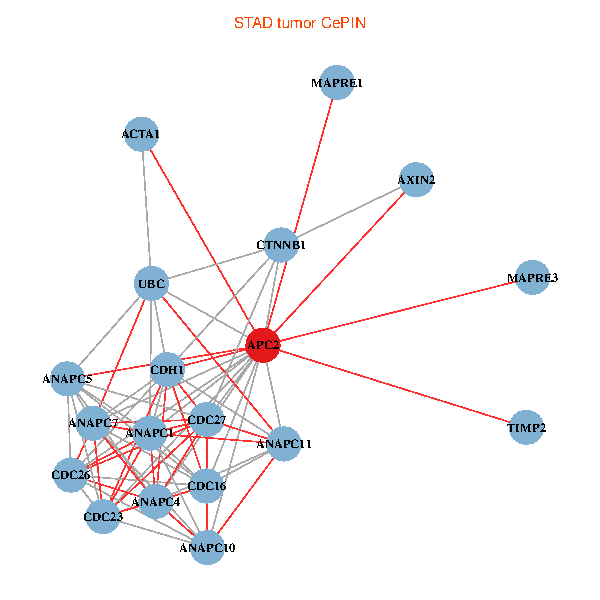
| Co-expressed gene networks based on protein-protein interaction data (CePIN) (TCGA IlluminaHiSeq_RNASeqV2, pan-cancer normalized log2(norm_counts+1) data, version 2016-08-16) (PINA2 ppi data) |
| BRCA (tumor) | BRCA (normal) |
| APC2, UBC, CDH1, CTNNB1, CDC16, CDC27, ACTA1, AXIN2, TIMP2, ANAPC11, CDC26, ANAPC4, ANAPC5, CDC23, ANAPC1, MAPRE1, MAPRE3, ANAPC7, ANAPC10 (tumor) | APC2, UBC, CDH1, CTNNB1, CDC16, CDC27, ACTA1, AXIN2, TIMP2, ANAPC11, CDC26, ANAPC4, ANAPC5, CDC23, ANAPC1, MAPRE1, MAPRE3, ANAPC7, ANAPC10 (normal) |
 |  |
| COAD (tumor) | COAD (normal) |
| APC2, UBC, CDH1, CTNNB1, CDC16, CDC27, ACTA1, AXIN2, TIMP2, ANAPC11, CDC26, ANAPC4, ANAPC5, CDC23, ANAPC1, MAPRE1, MAPRE3, ANAPC7, ANAPC10 (tumor) | APC2, UBC, CDH1, CTNNB1, CDC16, CDC27, ACTA1, AXIN2, TIMP2, ANAPC11, CDC26, ANAPC4, ANAPC5, CDC23, ANAPC1, MAPRE1, MAPRE3, ANAPC7, ANAPC10 (normal) |
 |  |
| HNSC (tumor) | HNSC (normal) |
| APC2, UBC, CDH1, CTNNB1, CDC16, CDC27, ACTA1, AXIN2, TIMP2, ANAPC11, CDC26, ANAPC4, ANAPC5, CDC23, ANAPC1, MAPRE1, MAPRE3, ANAPC7, ANAPC10 (tumor) | APC2, UBC, CDH1, CTNNB1, CDC16, CDC27, ACTA1, AXIN2, TIMP2, ANAPC11, CDC26, ANAPC4, ANAPC5, CDC23, ANAPC1, MAPRE1, MAPRE3, ANAPC7, ANAPC10 (normal) |
 |  |
| KICH (tumor) | KICH (normal) |
| APC2, UBC, CDH1, CTNNB1, CDC16, CDC27, ACTA1, AXIN2, TIMP2, ANAPC11, CDC26, ANAPC4, ANAPC5, CDC23, ANAPC1, MAPRE1, MAPRE3, ANAPC7, ANAPC10 (tumor) | APC2, UBC, CDH1, CTNNB1, CDC16, CDC27, ACTA1, AXIN2, TIMP2, ANAPC11, CDC26, ANAPC4, ANAPC5, CDC23, ANAPC1, MAPRE1, MAPRE3, ANAPC7, ANAPC10 (normal) |
 |  |
| KIRC (tumor) | KIRC (normal) |
| APC2, UBC, CDH1, CTNNB1, CDC16, CDC27, ACTA1, AXIN2, TIMP2, ANAPC11, CDC26, ANAPC4, ANAPC5, CDC23, ANAPC1, MAPRE1, MAPRE3, ANAPC7, ANAPC10 (tumor) | APC2, UBC, CDH1, CTNNB1, CDC16, CDC27, ACTA1, AXIN2, TIMP2, ANAPC11, CDC26, ANAPC4, ANAPC5, CDC23, ANAPC1, MAPRE1, MAPRE3, ANAPC7, ANAPC10 (normal) |
 |  |
| KIRP (tumor) | KIRP (normal) |
| APC2, UBC, CDH1, CTNNB1, CDC16, CDC27, ACTA1, AXIN2, TIMP2, ANAPC11, CDC26, ANAPC4, ANAPC5, CDC23, ANAPC1, MAPRE1, MAPRE3, ANAPC7, ANAPC10 (tumor) | APC2, UBC, CDH1, CTNNB1, CDC16, CDC27, ACTA1, AXIN2, TIMP2, ANAPC11, CDC26, ANAPC4, ANAPC5, CDC23, ANAPC1, MAPRE1, MAPRE3, ANAPC7, ANAPC10 (normal) |
 |  |
| LIHC (tumor) | LIHC (normal) |
| APC2, UBC, CDH1, CTNNB1, CDC16, CDC27, ACTA1, AXIN2, TIMP2, ANAPC11, CDC26, ANAPC4, ANAPC5, CDC23, ANAPC1, MAPRE1, MAPRE3, ANAPC7, ANAPC10 (tumor) | APC2, UBC, CDH1, CTNNB1, CDC16, CDC27, ACTA1, AXIN2, TIMP2, ANAPC11, CDC26, ANAPC4, ANAPC5, CDC23, ANAPC1, MAPRE1, MAPRE3, ANAPC7, ANAPC10 (normal) |
 |  |
| LUAD (tumor) | LUAD (normal) |
| APC2, UBC, CDH1, CTNNB1, CDC16, CDC27, ACTA1, AXIN2, TIMP2, ANAPC11, CDC26, ANAPC4, ANAPC5, CDC23, ANAPC1, MAPRE1, MAPRE3, ANAPC7, ANAPC10 (tumor) | APC2, UBC, CDH1, CTNNB1, CDC16, CDC27, ACTA1, AXIN2, TIMP2, ANAPC11, CDC26, ANAPC4, ANAPC5, CDC23, ANAPC1, MAPRE1, MAPRE3, ANAPC7, ANAPC10 (normal) |
 |  |
| LUSC (tumor) | LUSC (normal) |
| APC2, UBC, CDH1, CTNNB1, CDC16, CDC27, ACTA1, AXIN2, TIMP2, ANAPC11, CDC26, ANAPC4, ANAPC5, CDC23, ANAPC1, MAPRE1, MAPRE3, ANAPC7, ANAPC10 (tumor) | APC2, UBC, CDH1, CTNNB1, CDC16, CDC27, ACTA1, AXIN2, TIMP2, ANAPC11, CDC26, ANAPC4, ANAPC5, CDC23, ANAPC1, MAPRE1, MAPRE3, ANAPC7, ANAPC10 (normal) |
 |  |
| PRAD (tumor) | PRAD (normal) |
| APC2, UBC, CDH1, CTNNB1, CDC16, CDC27, ACTA1, AXIN2, TIMP2, ANAPC11, CDC26, ANAPC4, ANAPC5, CDC23, ANAPC1, MAPRE1, MAPRE3, ANAPC7, ANAPC10 (tumor) | APC2, UBC, CDH1, CTNNB1, CDC16, CDC27, ACTA1, AXIN2, TIMP2, ANAPC11, CDC26, ANAPC4, ANAPC5, CDC23, ANAPC1, MAPRE1, MAPRE3, ANAPC7, ANAPC10 (normal) |
 |  |
| STAD (tumor) | STAD (normal) |
| APC2, UBC, CDH1, CTNNB1, CDC16, CDC27, ACTA1, AXIN2, TIMP2, ANAPC11, CDC26, ANAPC4, ANAPC5, CDC23, ANAPC1, MAPRE1, MAPRE3, ANAPC7, ANAPC10 (tumor) | APC2, UBC, CDH1, CTNNB1, CDC16, CDC27, ACTA1, AXIN2, TIMP2, ANAPC11, CDC26, ANAPC4, ANAPC5, CDC23, ANAPC1, MAPRE1, MAPRE3, ANAPC7, ANAPC10 (normal) |
 |  |
| THCA (tumor) | THCA (normal) |
| APC2, UBC, CDH1, CTNNB1, CDC16, CDC27, ACTA1, AXIN2, TIMP2, ANAPC11, CDC26, ANAPC4, ANAPC5, CDC23, ANAPC1, MAPRE1, MAPRE3, ANAPC7, ANAPC10 (tumor) | APC2, UBC, CDH1, CTNNB1, CDC16, CDC27, ACTA1, AXIN2, TIMP2, ANAPC11, CDC26, ANAPC4, ANAPC5, CDC23, ANAPC1, MAPRE1, MAPRE3, ANAPC7, ANAPC10 (normal) |
 |  |
| Top |
| TissGeneProg for APC2 |
| Kaplan-Meier plots with logrank tests of overall survival (OS) using 28 cancer types (TCGA IlluminaHiSeq_RNASeqV2, pan-cancer normalized log2(norm_counts+1) data, version 2016-08-16) (TCGA clinicalMatrix, phenotype data, version 2016-04-27) * Click on the image to enlarge it in a new window. |
 |
| Kaplan-Meier plots with logrank test of relapse free survival (RFS) using 28 cancer types (TCGA IlluminaHiSeq_RNASeqV2, pan-cancer normalized log2(norm_counts+1) data, version 2016-08-16) (TCGA clinicalMatrix, phenotype data, version 2016-04-27) * Click on the image enlarge it in a new window. |
 |
| Forest plot of Cox proportional hazard ratio (HR) and 95% CI of overall survival (OS) using 28 cancer types (TCGA IlluminaHiSeq_RNASeqV2, pan-cancer normalized log2(norm_counts+1) data, version 2016-08-16) (TCGA clinicalMatrix, phenotype data, version 2016-04-27) * Click on the image enlarge it in a new window. |
 |
| Forest plot of Cox proportional hazard ratio (HR) and 95% CI of relapse free survival (RFS) using 28 cancer types (TCGA IlluminaHiSeq_RNASeqV2, pan-cancer normalized log2(norm_counts+1) data, version 2016-08-16) (TCGA clinicalMatrix, phenotype data, version 2016-04-27) * Click on the image enlarge it in a new window. |
 |
| Top |
| TissGeneClin for APC2 |
| TissGeneDrug for APC2 |
| Drug information targeting TissGene (DrugBank Version 5.0.6, 2017-04-01) |
| DrugBank ID | Drug name | Drug activity | Drug type | Drug status |
| Top |
| TissGeneDisease for APC2 |
| Disease information associated with TissGene (DisGeNet, 2016-06-01) |
| Disease ID | Disease name | # pubmeds | Source |
| umls:C0032580 | Adenomatous Polyposis Coli | 9 | BeFree,LHGDN |
| umls:C0009404 | Colorectal Neoplasms | 3 | CTD_human |
| umls:C0007102 | Malignant tumor of colon | 2 | BeFree |
| umls:C0699790 | Colon Carcinoma | 2 | BeFree |
| umls:C0001418 | Adenocarcinoma | 1 | BeFree |
| umls:C0021390 | Inflammatory Bowel Diseases | 1 | CTD_human |
| umls:C0029925 | Ovarian Carcinoma | 1 | BeFree |
| umls:C0035335 | Retinoblastoma | 1 | BeFree |
| umls:C0152013 | Adenocarcinoma of lung (disorder) | 1 | BeFree |
| umls:C0178874 | Tumor Progression | 1 | BeFree |
| umls:C0206664 | Teratocarcinoma | 1 | BeFree |
| umls:C0494463 | Alzheimer Disease, Late Onset | 1 | BeFree |
| umls:C1140680 | Malignant neoplasm of ovary | 1 | BeFree |
| umls:C1458155 | Mammary Neoplasms | 1 | CTD_human |
| umls:C0175695 | Sotos' syndrome | 0 | ORPHANET |
|
Copyright 2016-Present - The University of Texas Health Science Center at Houston (UTHealth) Web File Viewing | How to Report, Fraud, Waste and Abuse | State of Texas | Statewide Search | Texas Homeland Security | Site Policies |