 |
| |
| |
| |
| |
| |
| |
|

| TissGeneSummary for CSPG5 |
 Gene summary Gene summary |
| Basic gene information | Gene symbol | CSPG5 |
| Gene name | chondroitin sulfate proteoglycan 5 (neuroglycan C) | |
| Synonyms | NGC | |
| Cytomap | UCSC genome browser: 3p21.3 | |
| Type of gene | protein-coding | |
| RefGenes | NM_001206942.1, NM_001206943.1,NM_001206944.1,NM_001206945.1,NM_006574.3, | |
| Description | acidic leucine-rich EGF-like domain-containing brain proteinchondroitin sulfate proteoglycan 5 | |
| Modification date | 20141207 | |
| dbXrefs | MIM : 606775 | |
| HGNC : HGNC | ||
| Ensembl : ENSG00000114646 | ||
| Protein | UniProt: go to UniProt's Cross Reference DB Table | |
| Expression | CleanEX: HS_CSPG5 | |
| BioGPS: 10675 | ||
| Pathway | NCI Pathway Interaction Database: CSPG5 | |
| KEGG: CSPG5 | ||
| REACTOME: CSPG5 | ||
| Pathway Commons: CSPG5 | ||
| Context | iHOP: CSPG5 | |
| ligand binding site mutation search in PubMed: CSPG5 | ||
| UCL Cancer Institute: CSPG5 | ||
| Assigned class in TissGDB* | C | |
| Included tissue-specific gene expression resources | HPA,TiGER | |
| Specific-tissues in normal samples (assigned by TissGDB using HPA, TiGER, and GTEx) | Brain | |
| Cancer types related to the specific-tissues in cancer samples (assigned by TissGDB using TCGA) | GBM,LGG | |
| Reference showing the relevant tissue of CSPG5 | ||
| Description by TissGene annotations | ||
| * Class A consists of genes with literature evidence and is part of the cTissGenes. Class B consists of only cTissGenes without additional evidence. The remaining genes belong to Class C. |
| Gene ontology having evidence of Inferred from Direct Assay (IDA) from Entrez |
| GO ID | GO term | PubMed ID |
| Top |
| TissGeneExp for CSPG5 |
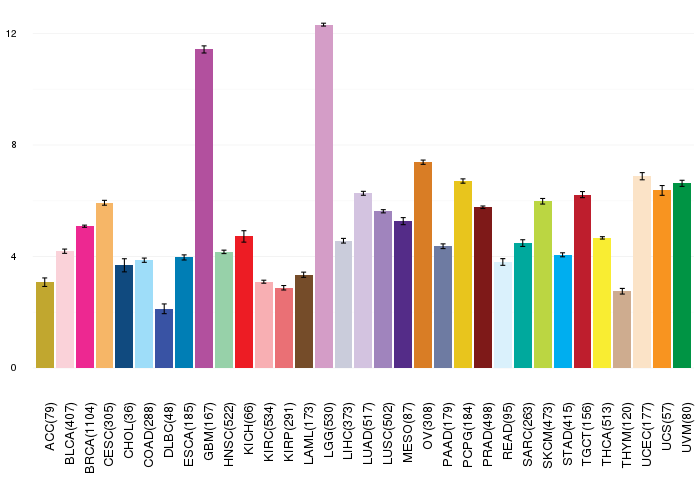
| Gene expressions across 28 cancer types (X-axis: cancer type and Y-axis: log2(norm_counts+1)) (TCGA IlluminaHiSeq_RNASeqV2, pan-cancer normalized log2(norm_counts+1) data, version 2016-08-16) |
 |
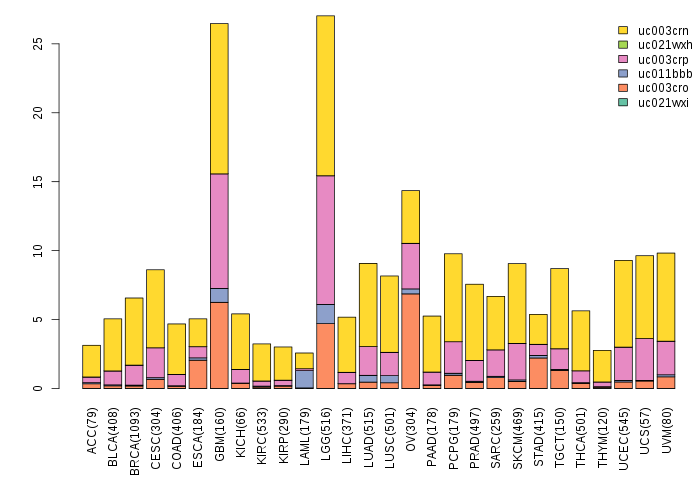
| Gene isoform expressions across 28 cancer types (X-axis: cancer type and Y-axis: log2(norm_counts+1)) (TCGA pan-cancer tcga_rsem_isoform_tpm, version 2016-09-01) |
 |
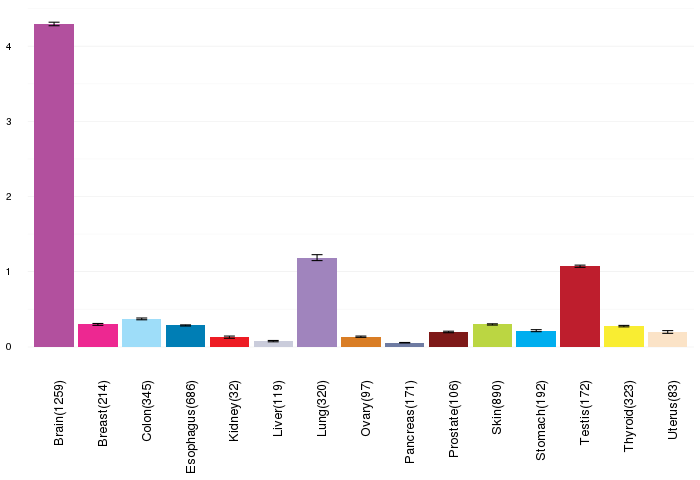
| Gene expressions across normal tissues of GTEx data (GTEx GTEx_Analysis_v6_RNA-seq_RNA-SeQCv1.1.8_gene_rpkm.gct) - Here, we shows the matched tissue types only among our 28 cancer types. |
 |
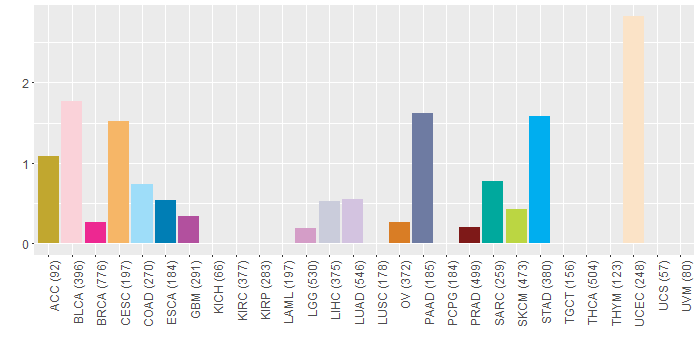
| Different expressions across 14 cancer types with more than 10 samples between matched tumors and normals (X-axis: cancer type and Y-axis: log2(norm_counts+1)) (TCGA IlluminaHiSeq_RNASeqV2, pan-cancer normalized log2(norm_counts+1) data, version 2016-08-16) |
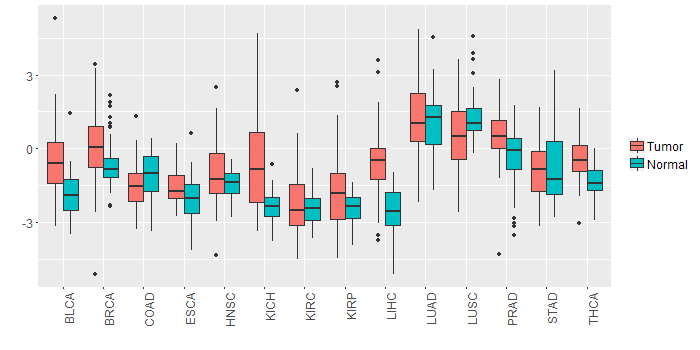 |
| - Significantly differentially expressed cancer types and information. (|Fold change|>1 and FDR<0.05) |
| Cancer type | Mean(exp) in tumor | Mean(exp) in matched normal | Log2FC | P-val. | FDR |
| LIHC | -0.508777666 | -2.613787666 | 2.10501 | 6.38E-13 | 1.32E-11 |
| BLCA | -0.342404298 | -1.843920087 | 1.501515789 | 0.00607 | 0.030681091 |
| KICH | -0.547439666 | -2.308547666 | 1.761108 | 0.000119 | 0.000306397 |
| Top |
| TissGene-miRNA for CSPG5 |
| Significantly anti-correlated miRNAs of TissGene across 28 cancer types (Gene-miRNA relations from TargetScanHuman Relsease 7.1, Conserved_Site_Context_Scores.txt.zip, 06.01.2016) (TCGA IlluminaHiSeq_miRNASeq, log2(RPM+1) data, version 2016-11-21) (TCGA IlluminaHiSeq_RNASeqV2, log2(normalized_count+1) data, version 2016-08-16) (Spearman’s Rank Correlation (p-value<0.05 and coefficient<-0.25)) |
| Cancer type | miRNA id | miRNA accession | P-val. | Coeff. | # samples |
| Top |
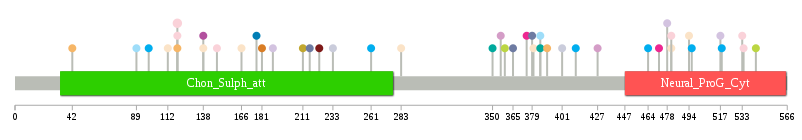
| TissGeneMut for CSPG5 |
| TissGeneSNV for CSPG5 |
| nsSNV counts per each loci. Different colors of circles represent different cancer types. Circle size denotes number of samples. (TCGA somatic mutation (SNPs and small INDELs) data, version 2016-04-25) * Click on the image to enlarge it in a new window. |
 |
 |
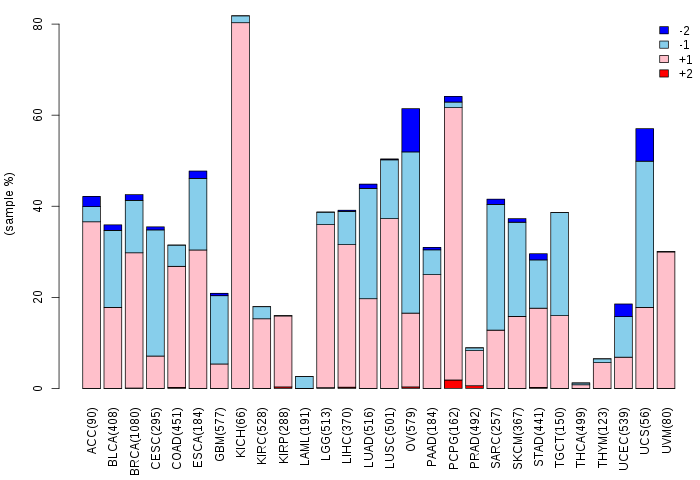
| Somatic nucleotide variants of TissGene across 28 cancer types (X-axis: cancer type and Y-axis: % of mutated samples) The numbers in parentheses are numbers of samples with mutation (nsSNVs). (TCGA somatic mutation (SNPs and small INDELs) data, version 2016-04-25) |
 |
| - nsSNVs sorted by frequency. |
| AAchange | Cancer type | # samples |
| p.D119N | BLCA | 2 |
| p.E534Q | BLCA | 1 |
| p.S470F | READ | 1 |
| p.K494N | UCEC | 1 |
| p.T98A | STAD | 1 |
| p.T452M | READ | 1 |
| p.A164G | DLBC | 1 |
| p.A42T | CESC | 1 |
| p.P189T | LUAD | 1 |
| p.T478A | LUAD | 1 |
| p.I138M | UCEC | 1 |
| p.L177Q | ESCA | 1 |
| p.G356D | LGG | 1 |
| p.R464W | STAD | 1 |
| p.E481K | BLCA | 1 |
| p.G385S | SARC | 1 |
| p.G385D | COAD | 1 |
| p.D211E | ACC | 1 |
| p.Y380H | UCEC | 1 |
| p.E148K | BLCA | 1 |
| p.S379C | PAAD | 1 |
| p.T496I | STAD | 1 |
| p.E214K | HNSC | 1 |
| p.S543L | SKCM | 1 |
| p.E283K | UCEC | 1 |
| p.D375N | BRCA | 1 |
| p.D261N | STAD | 1 |
| p.E533* | BLCA | 1 |
| p.R458H | READ | 1 |
| p.E166D | UCEC | 1 |
| p.R411C | STAD | 1 |
| p.I138V | GBM | 1 |
| p.C359G | SKCM | 1 |
| p.D119Y | BLCA | 1 |
| p.L89M | COAD | 1 |
| p.D472V | BRCA | 1 |
| p.V390L | CESC | 1 |
| p.L350* | SARC | 1 |
| p.A518D | STAD | 1 |
| p.D119N | CESC | 1 |
| p.G181D | OV | 1 |
| p.G107S | HNSC | 1 |
| p.G427S | LGG | 1 |
| p.T112A | UCEC | 1 |
| p.R365W | PAAD | 1 |
| p.I208N | HNSC | 1 |
| p.G233R | LIHC | 1 |
| p.L216P | PAAD | 1 |
| p.T401M | LIHC | 1 |
| p.E481K | UCEC | 1 |
| p.S517N | LUAD | 1 |
| p.E297K | HNSC | 1 |
| p.A223T | PRAD | 1 |
| Top |
| TissGeneCNV for CSPG5 |
| Copy number variations of TissGene across 28 cancer types (X-axis: cancer type and Y-axis: % of CNV samples) (TCGA Gistic2_CopyNumber_Gistic2_all_data_by_genes, Gistic2 copy number data, version 2016-08-16) |
 |
| Top |
| TissGeneFusions for CSPG5 |
| Fusion genes including TissGene (ChimerDB 3.0, 2016-12-01 and TCGA fusion Portal 2015-12-01) |
| Database | Src | Cancer type | Sample | Fusion gene | ORF | 5'-gene BP | 3'-gene BP |
| Chimerdb3.0 | ChiTaRs | NA | BF364648 | CSPG5-MAG | chr3:47614359 | chr19:35800990 |
| Top |
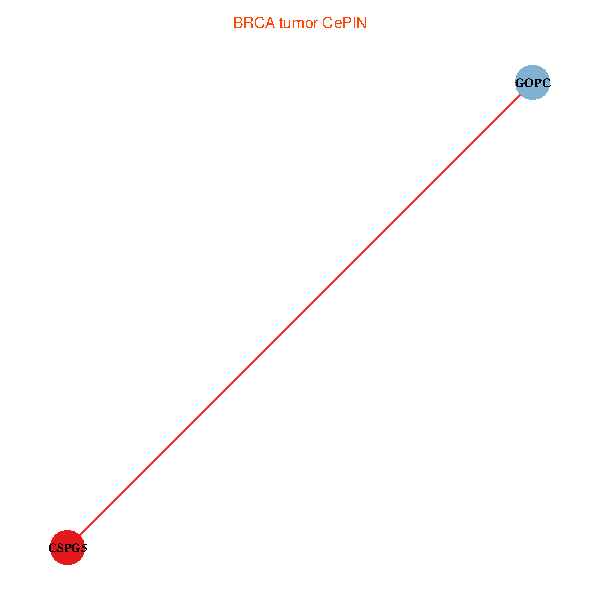
| TissGeneNet for CSPG5 |
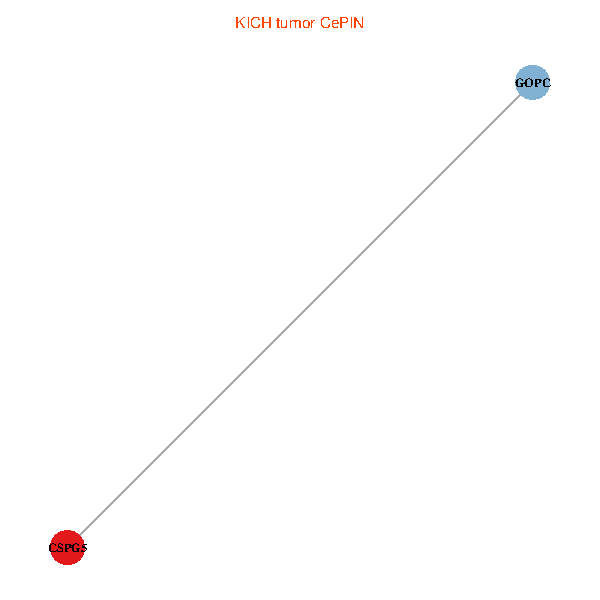
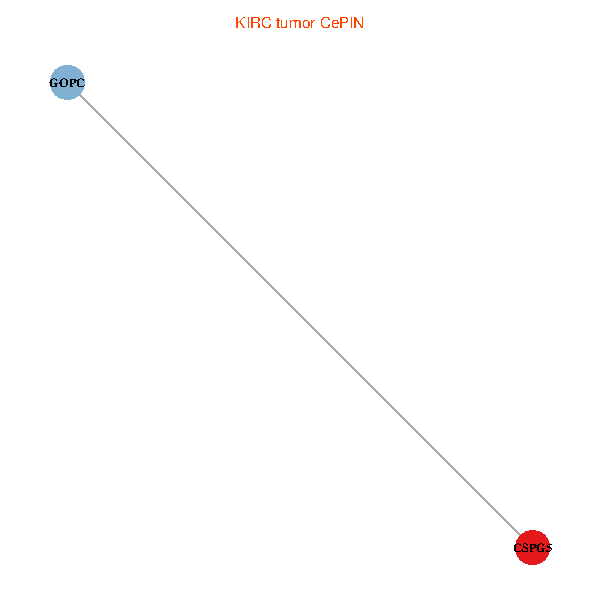
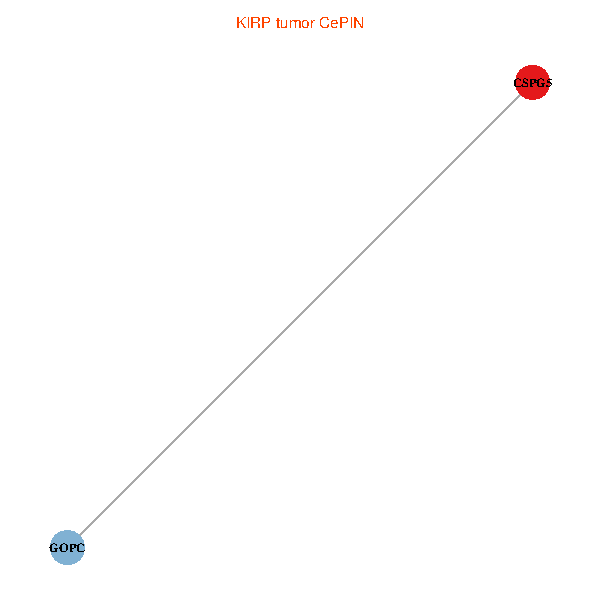
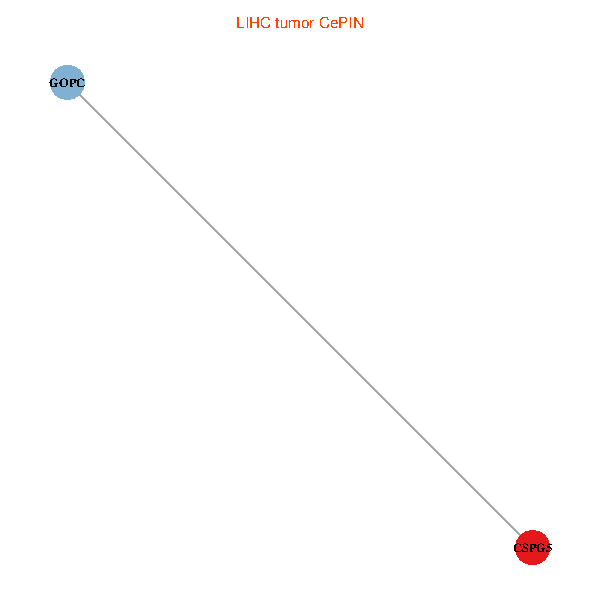
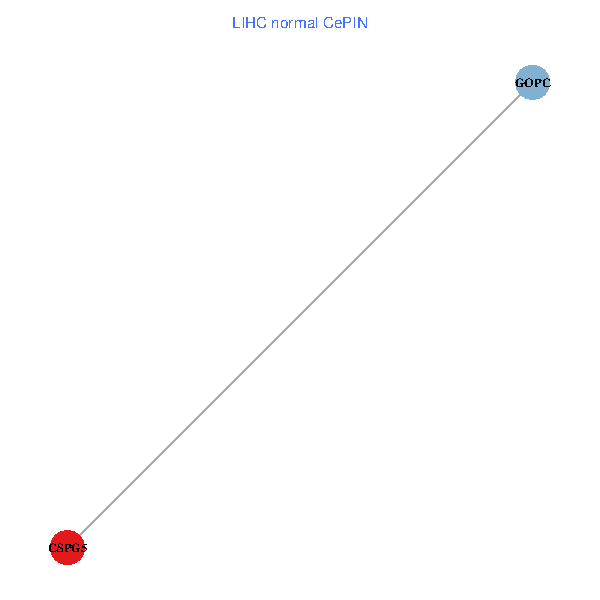
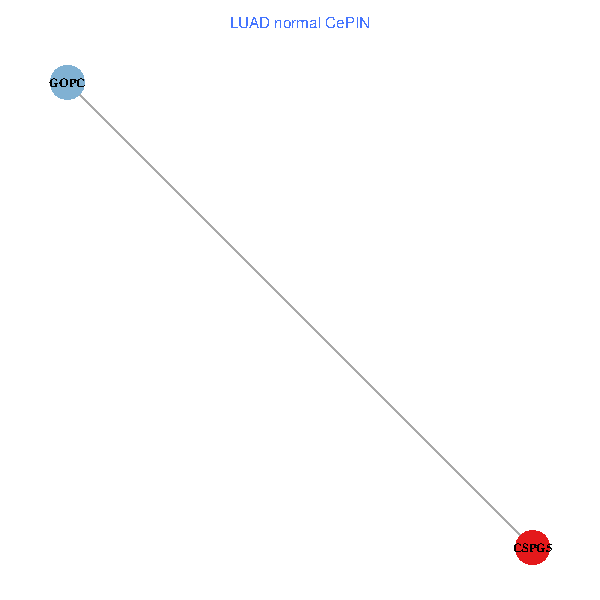
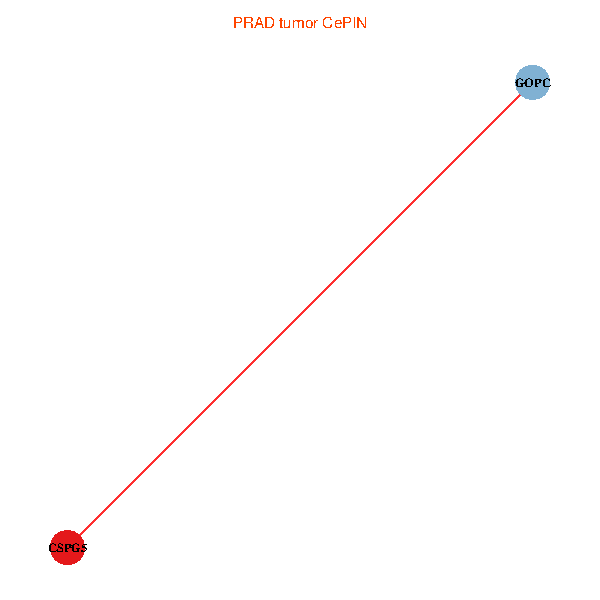
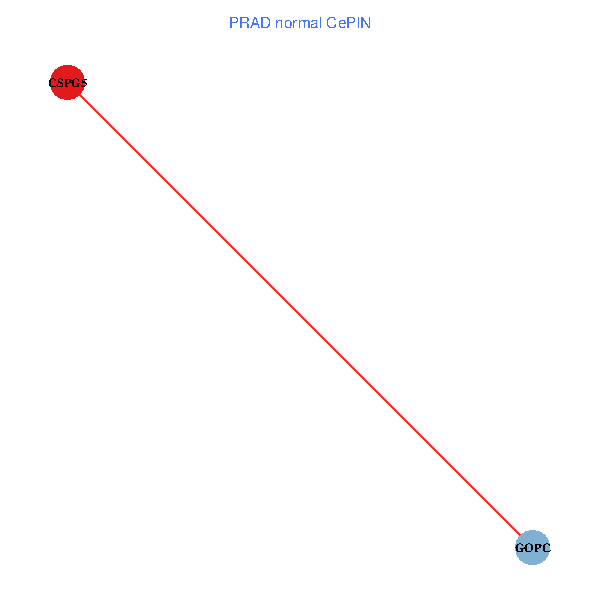
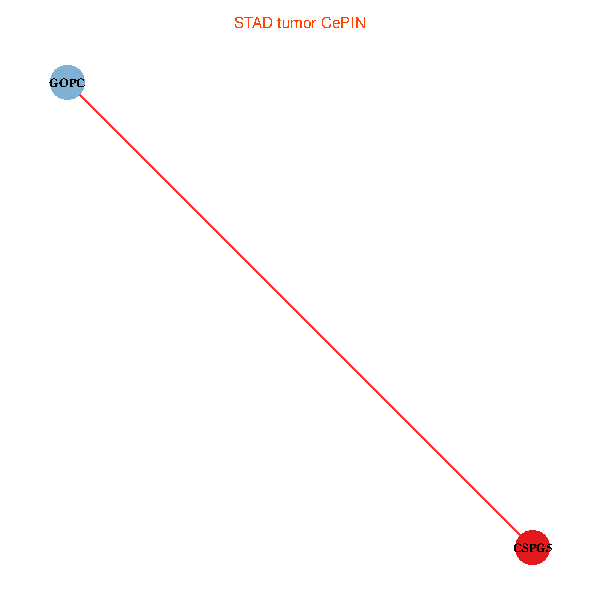
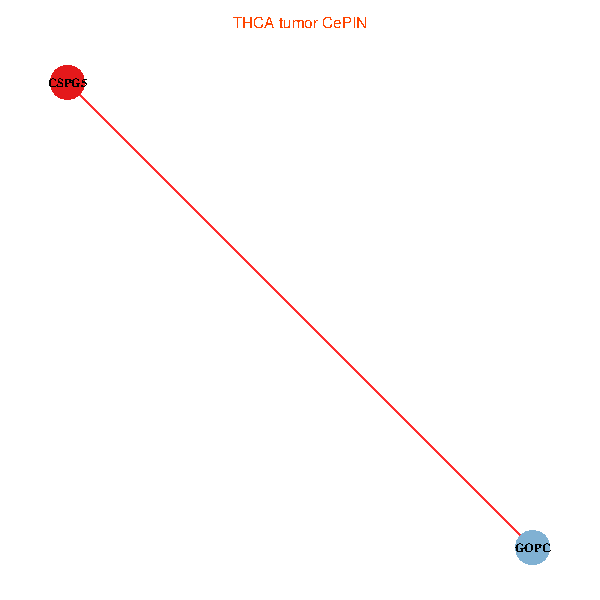
| Co-expressed gene networks based on protein-protein interaction data (CePIN) (TCGA IlluminaHiSeq_RNASeqV2, pan-cancer normalized log2(norm_counts+1) data, version 2016-08-16) (PINA2 ppi data) |
| BRCA (tumor) | BRCA (normal) |
| CSPG5, GOPC (tumor) | CSPG5, GOPC (normal) |
 |  |
| COAD (tumor) | COAD (normal) |
| CSPG5, GOPC (tumor) | CSPG5, GOPC (normal) |
 |  |
| HNSC (tumor) | HNSC (normal) |
| CSPG5, GOPC (tumor) | CSPG5, GOPC (normal) |
 |  |
| KICH (tumor) | KICH (normal) |
| CSPG5, GOPC (tumor) | CSPG5, GOPC (normal) |
 |  |
| KIRC (tumor) | KIRC (normal) |
| CSPG5, GOPC (tumor) | CSPG5, GOPC (normal) |
 |  |
| KIRP (tumor) | KIRP (normal) |
| CSPG5, GOPC (tumor) | CSPG5, GOPC (normal) |
 |  |
| LIHC (tumor) | LIHC (normal) |
| CSPG5, GOPC (tumor) | CSPG5, GOPC (normal) |
 |  |
| LUAD (tumor) | LUAD (normal) |
| CSPG5, GOPC (tumor) | CSPG5, GOPC (normal) |
 |  |
| LUSC (tumor) | LUSC (normal) |
| CSPG5, GOPC (tumor) | CSPG5, GOPC (normal) |
 |  |
| PRAD (tumor) | PRAD (normal) |
| CSPG5, GOPC (tumor) | CSPG5, GOPC (normal) |
 |  |
| STAD (tumor) | STAD (normal) |
| CSPG5, GOPC (tumor) | CSPG5, GOPC (normal) |
 |  |
| THCA (tumor) | THCA (normal) |
| CSPG5, GOPC (tumor) | CSPG5, GOPC (normal) |
 |  |
| Top |
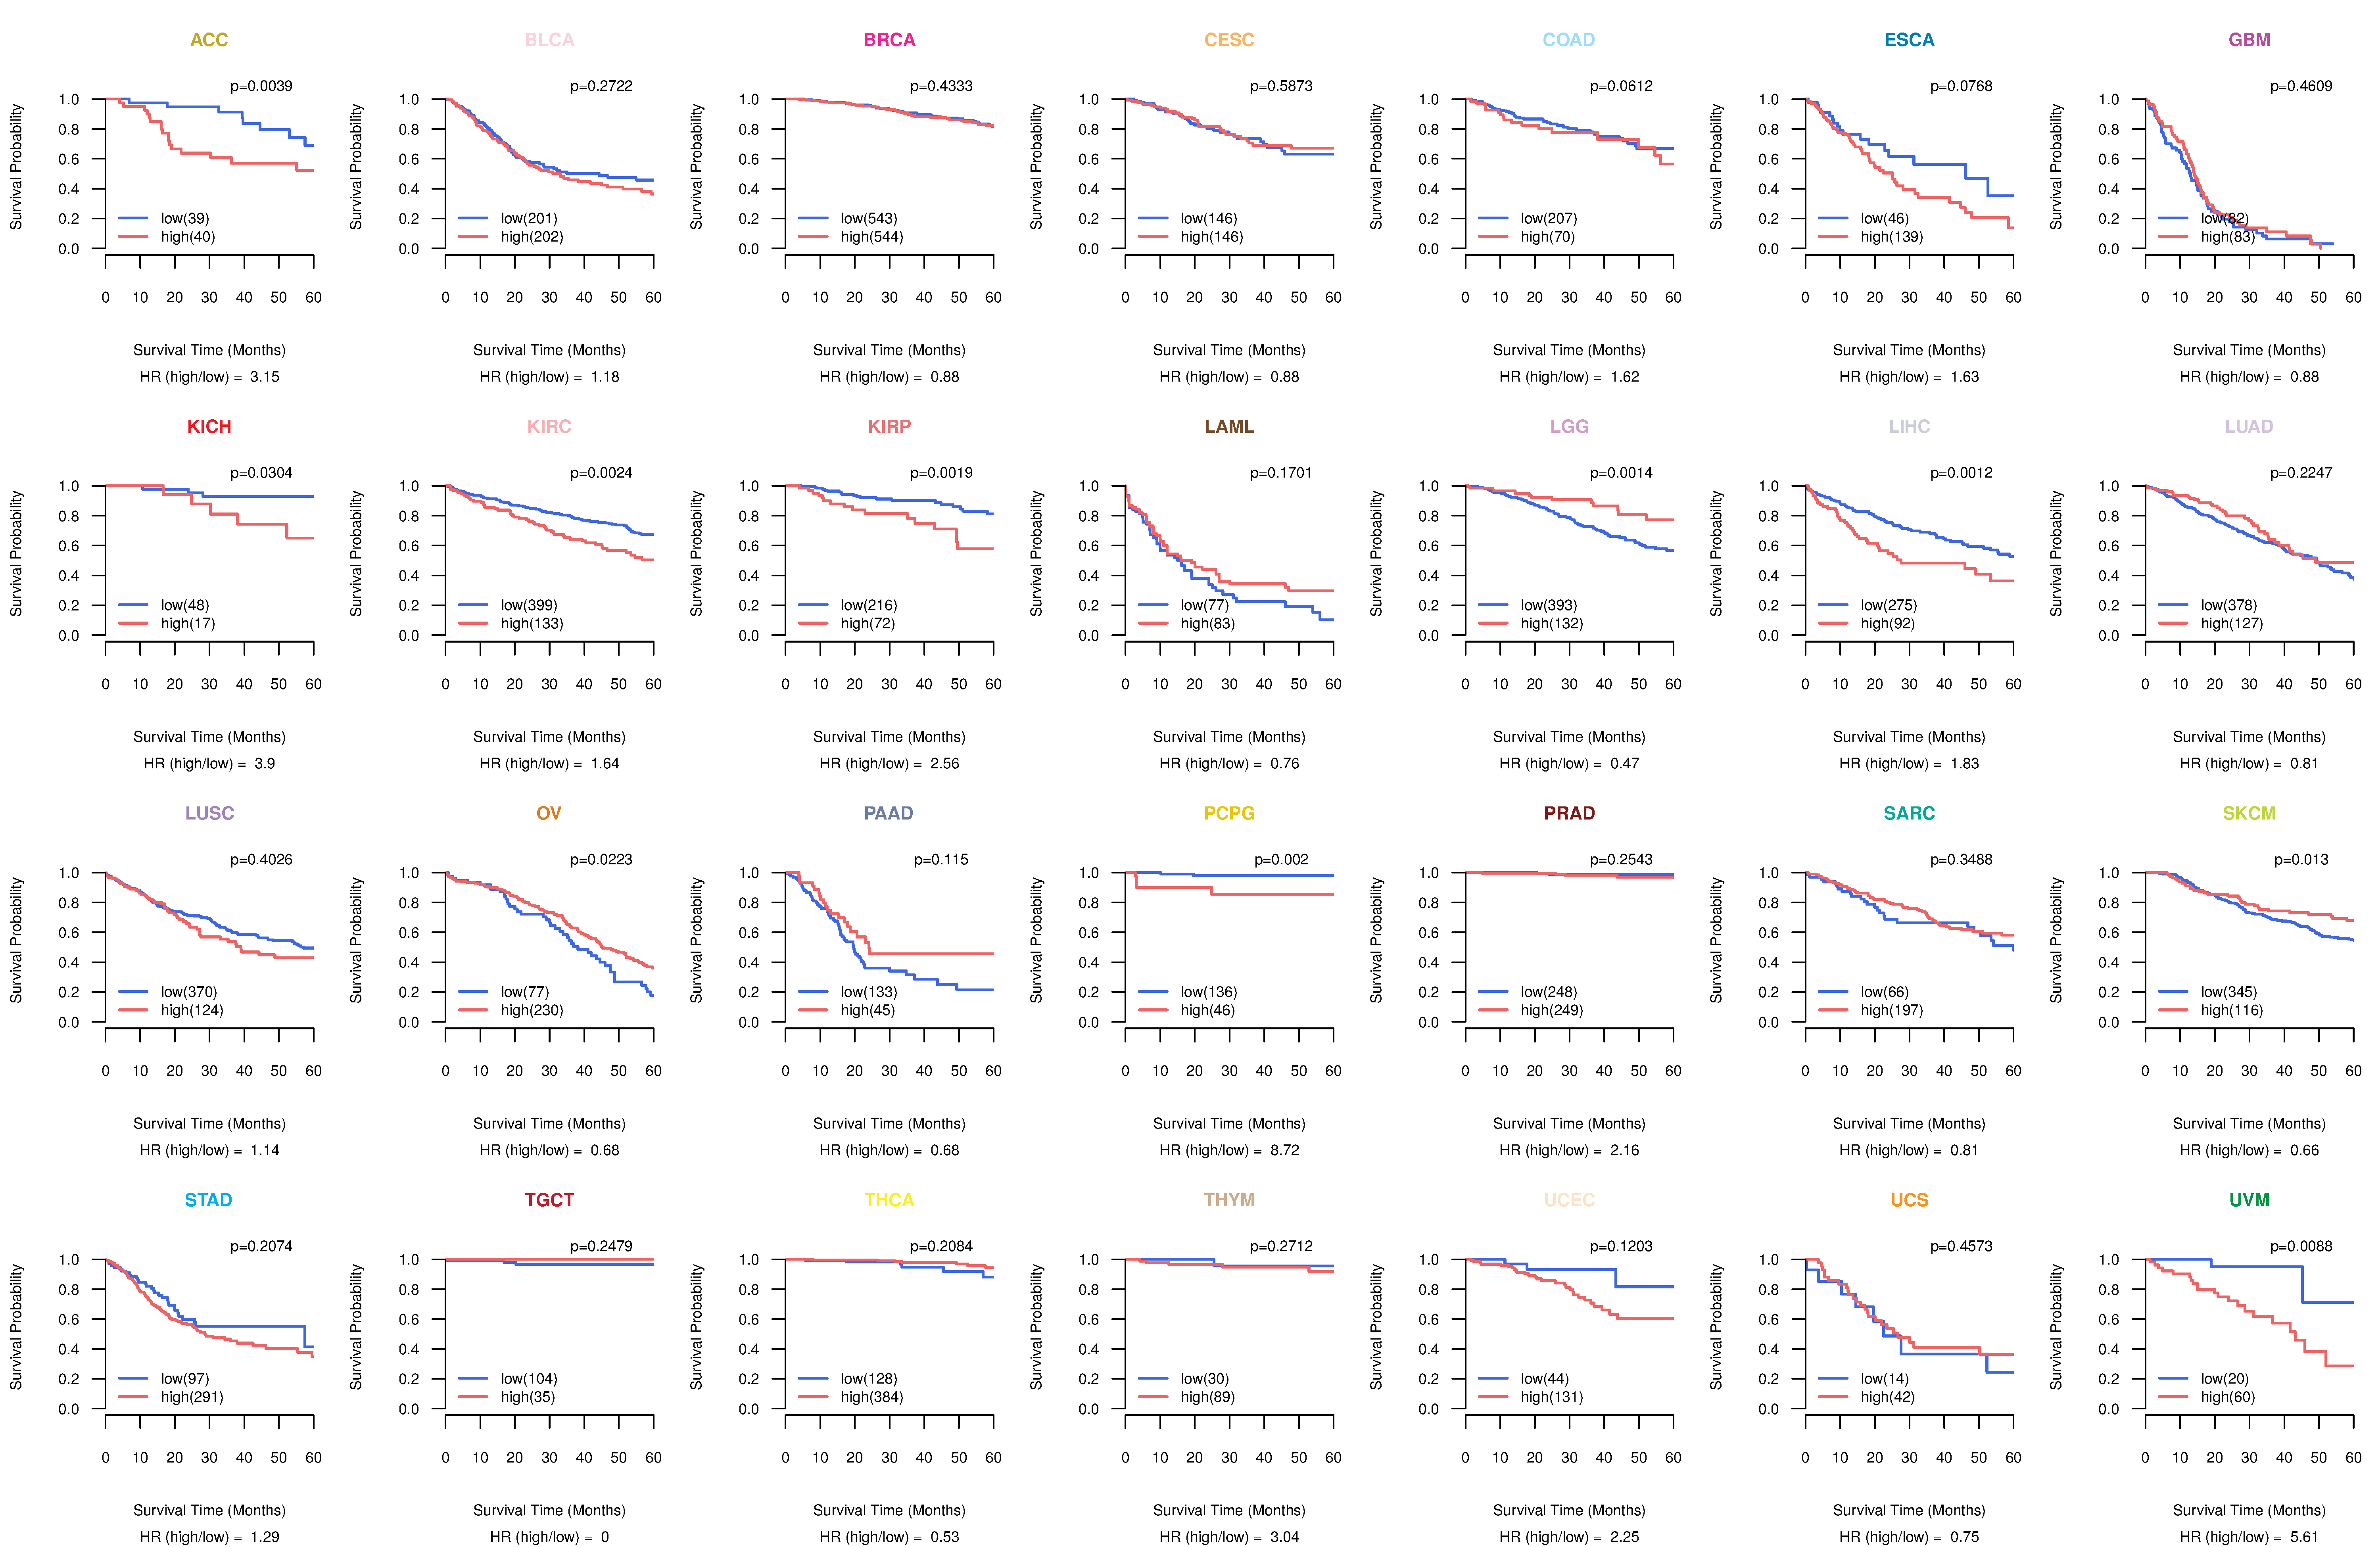
| TissGeneProg for CSPG5 |
| Kaplan-Meier plots with logrank tests of overall survival (OS) using 28 cancer types (TCGA IlluminaHiSeq_RNASeqV2, pan-cancer normalized log2(norm_counts+1) data, version 2016-08-16) (TCGA clinicalMatrix, phenotype data, version 2016-04-27) * Click on the image to enlarge it in a new window. |
 |
| Kaplan-Meier plots with logrank test of relapse free survival (RFS) using 28 cancer types (TCGA IlluminaHiSeq_RNASeqV2, pan-cancer normalized log2(norm_counts+1) data, version 2016-08-16) (TCGA clinicalMatrix, phenotype data, version 2016-04-27) * Click on the image enlarge it in a new window. |
 |
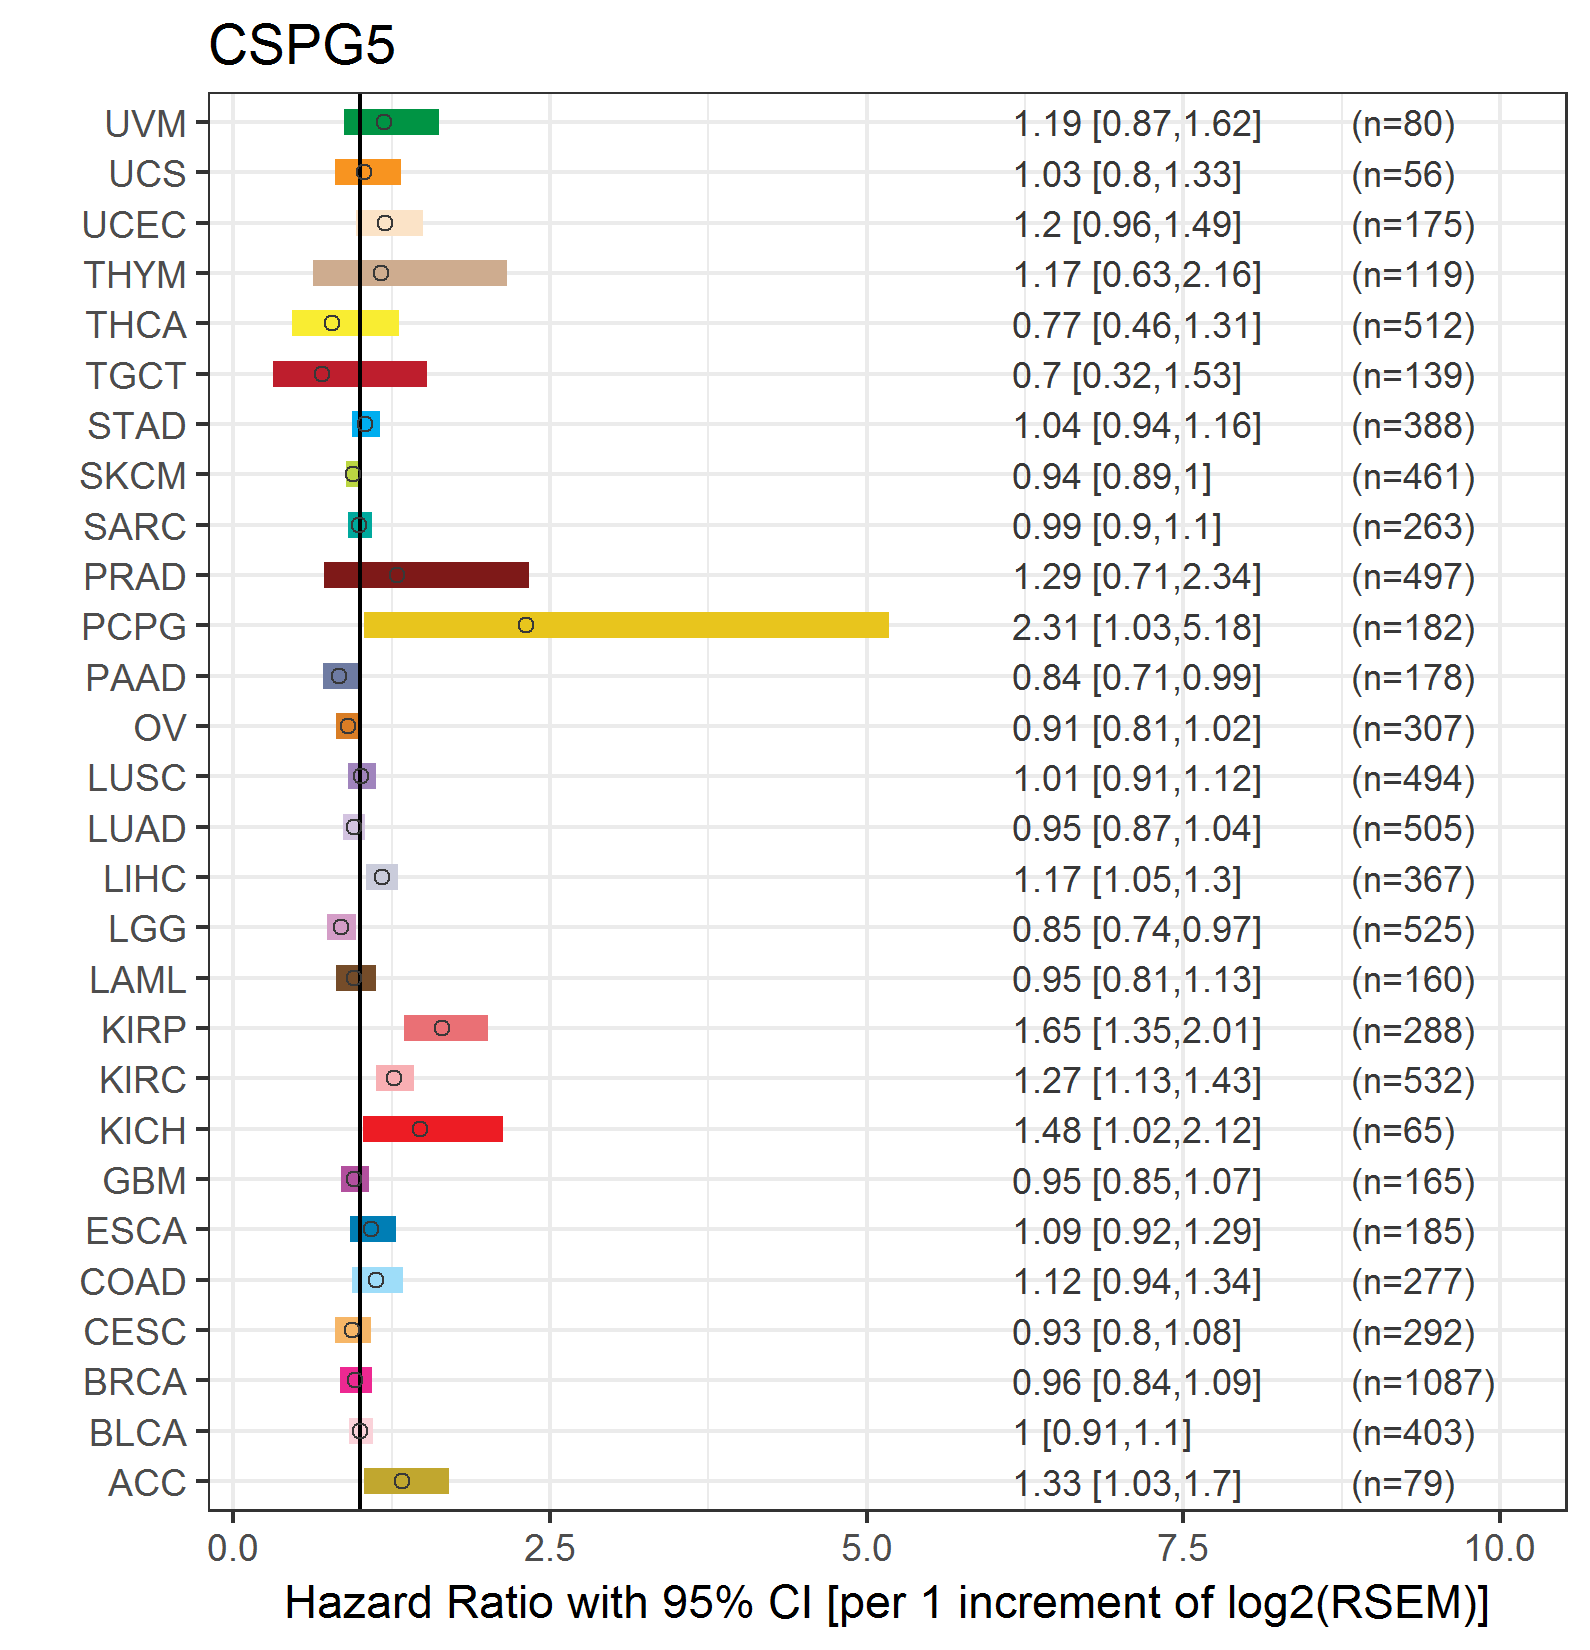
| Forest plot of Cox proportional hazard ratio (HR) and 95% CI of overall survival (OS) using 28 cancer types (TCGA IlluminaHiSeq_RNASeqV2, pan-cancer normalized log2(norm_counts+1) data, version 2016-08-16) (TCGA clinicalMatrix, phenotype data, version 2016-04-27) * Click on the image enlarge it in a new window. |
 |
| Forest plot of Cox proportional hazard ratio (HR) and 95% CI of relapse free survival (RFS) using 28 cancer types (TCGA IlluminaHiSeq_RNASeqV2, pan-cancer normalized log2(norm_counts+1) data, version 2016-08-16) (TCGA clinicalMatrix, phenotype data, version 2016-04-27) * Click on the image enlarge it in a new window. |
 |
| Top |
| TissGeneClin for CSPG5 |
| TissGeneDrug for CSPG5 |
| Drug information targeting TissGene (DrugBank Version 5.0.6, 2017-04-01) |
| DrugBank ID | Drug name | Drug activity | Drug type | Drug status |
| Top |
| TissGeneDisease for CSPG5 |
| Disease information associated with TissGene (DisGeNet, 2016-06-01) |
| Disease ID | Disease name | # pubmeds | Source |
| umls:C0011311 | Dengue Fever | 1 | BeFree |
| umls:C0036341 | Schizophrenia | 1 | BeFree,GAD |
| umls:C0871189 | Psychotic symptom | 1 | BeFree |
|
Copyright 2016-Present - The University of Texas Health Science Center at Houston (UTHealth) Web File Viewing | How to Report, Fraud, Waste and Abuse | State of Texas | Statewide Search | Texas Homeland Security | Site Policies |