 |
| |
| |
| |
| |
| |
| |
|

| TissGeneSummary for CCT6B |
 Gene summary Gene summary |
| Basic gene information | Gene symbol | CCT6B |
| Gene name | chaperonin containing TCP1, subunit 6B (zeta 2) | |
| Synonyms | CCT-zeta-2|CCTZ-2|Cctz2|TCP-1-zeta-2|TSA303 | |
| Cytomap | UCSC genome browser: 17q12 | |
| Type of gene | protein-coding | |
| RefGenes | NM_001193529.1, NM_001193530.1,NM_006584.3, | |
| Description | T-complex protein 1 subunit zeta-2T-complex protein 1, zeta-2 subunittestis-specific Tcp20testis-specific protein TSA303 | |
| Modification date | 20141207 | |
| dbXrefs | MIM : 610730 | |
| HGNC : HGNC | ||
| Ensembl : ENSG00000132141 | ||
| HPRD : 09873 | ||
| Vega : OTTHUMG00000179770 | ||
| Protein | UniProt: go to UniProt's Cross Reference DB Table | |
| Expression | CleanEX: HS_CCT6B | |
| BioGPS: 10693 | ||
| Pathway | NCI Pathway Interaction Database: CCT6B | |
| KEGG: CCT6B | ||
| REACTOME: CCT6B | ||
| Pathway Commons: CCT6B | ||
| Context | iHOP: CCT6B | |
| ligand binding site mutation search in PubMed: CCT6B | ||
| UCL Cancer Institute: CCT6B | ||
| Assigned class in TissGDB* | B | |
| Included tissue-specific gene expression resources | HPA,TiGER,GTEx | |
| Specific-tissues in normal samples (assigned by TissGDB using HPA, TiGER, and GTEx) | Testis | |
| Cancer types related to the specific-tissues in cancer samples (assigned by TissGDB using TCGA) | TGCT | |
| Reference showing the relevant tissue of CCT6B | ||
| Description by TissGene annotations | TissgsLTS | |
| * Class A consists of genes with literature evidence and is part of the cTissGenes. Class B consists of only cTissGenes without additional evidence. The remaining genes belong to Class C. |
| Gene ontology having evidence of Inferred from Direct Assay (IDA) from Entrez |
| GO ID | GO term | PubMed ID |
| Top |
| TissGeneExp for CCT6B |
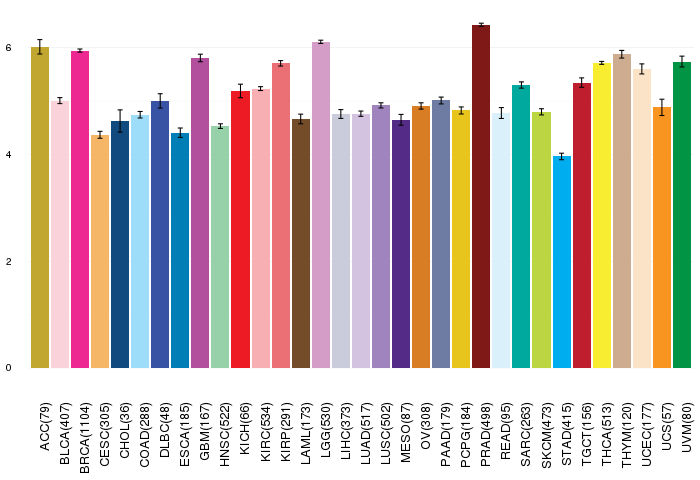
| Gene expressions across 28 cancer types (X-axis: cancer type and Y-axis: log2(norm_counts+1)) (TCGA IlluminaHiSeq_RNASeqV2, pan-cancer normalized log2(norm_counts+1) data, version 2016-08-16) |
 |
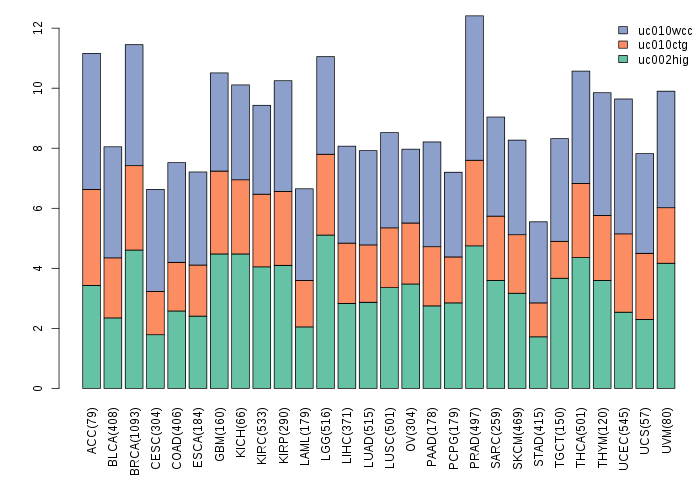
| Gene isoform expressions across 28 cancer types (X-axis: cancer type and Y-axis: log2(norm_counts+1)) (TCGA pan-cancer tcga_rsem_isoform_tpm, version 2016-09-01) |
 |
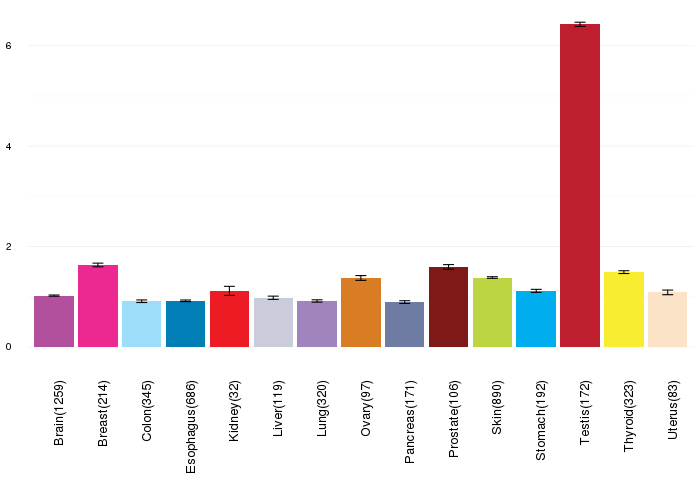
| Gene expressions across normal tissues of GTEx data (GTEx GTEx_Analysis_v6_RNA-seq_RNA-SeQCv1.1.8_gene_rpkm.gct) - Here, we shows the matched tissue types only among our 28 cancer types. |
 |
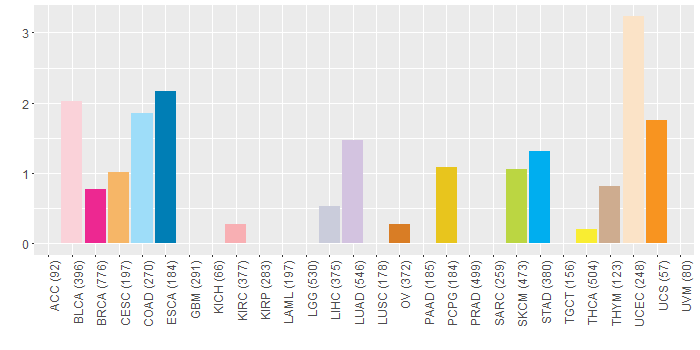
| Different expressions across 14 cancer types with more than 10 samples between matched tumors and normals (X-axis: cancer type and Y-axis: log2(norm_counts+1)) (TCGA IlluminaHiSeq_RNASeqV2, pan-cancer normalized log2(norm_counts+1) data, version 2016-08-16) |
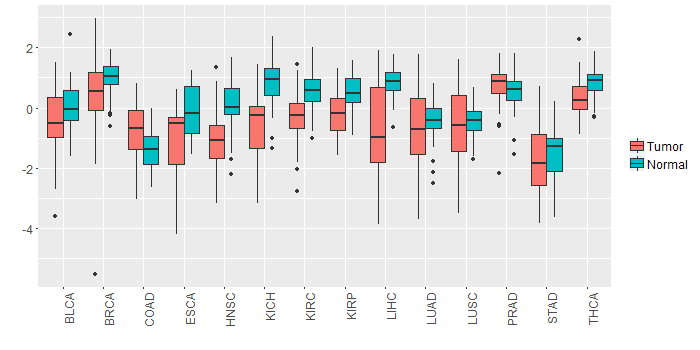 |
| - Significantly differentially expressed cancer types and information. (|Fold change|>1 and FDR<0.05) |
| Cancer type | Mean(exp) in tumor | Mean(exp) in matched normal | Log2FC | P-val. | FDR |
| LIHC | -0.801953636 | 0.856798364 | -1.658752 | 5.38E-10 | 6.16E-09 |
| HNSC | -1.059099915 | 0.122125666 | -1.181225581 | 4.41E-08 | 4.64E-07 |
| KICH | -0.579403636 | 0.809732364 | -1.389136 | 4.38E-06 | 1.47E-05 |
| Top |
| TissGene-miRNA for CCT6B |
| Significantly anti-correlated miRNAs of TissGene across 28 cancer types (Gene-miRNA relations from TargetScanHuman Relsease 7.1, Conserved_Site_Context_Scores.txt.zip, 06.01.2016) (TCGA IlluminaHiSeq_miRNASeq, log2(RPM+1) data, version 2016-11-21) (TCGA IlluminaHiSeq_RNASeqV2, log2(normalized_count+1) data, version 2016-08-16) (Spearman’s Rank Correlation (p-value<0.05 and coefficient<-0.25)) |
| Cancer type | miRNA id | miRNA accession | P-val. | Coeff. | # samples |
| Top |
| TissGeneMut for CCT6B |
| TissGeneSNV for CCT6B |
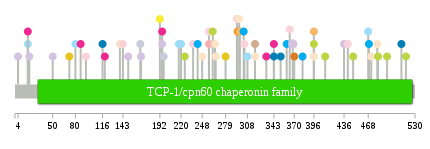
| nsSNV counts per each loci. Different colors of circles represent different cancer types. Circle size denotes number of samples. (TCGA somatic mutation (SNPs and small INDELs) data, version 2016-04-25) * Click on the image to enlarge it in a new window. |
 |
 |
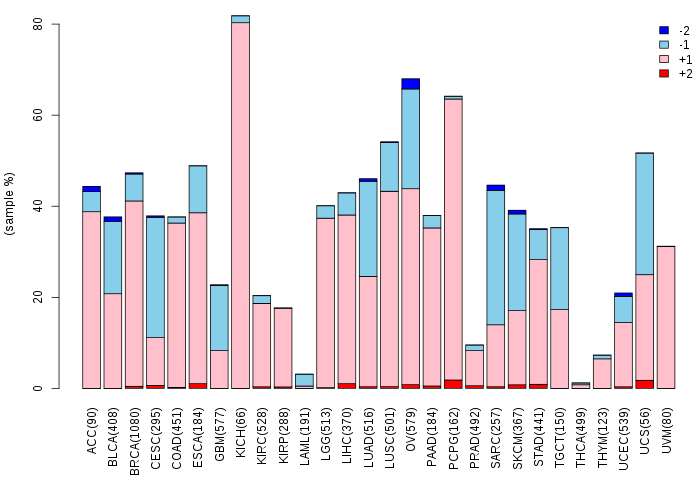
| Somatic nucleotide variants of TissGene across 28 cancer types (X-axis: cancer type and Y-axis: % of mutated samples) The numbers in parentheses are numbers of samples with mutation (nsSNVs). (TCGA somatic mutation (SNPs and small INDELs) data, version 2016-04-25) |
 |
| - nsSNVs sorted by frequency. |
| AAchange | Cancer type | # samples |
| p.N368Y | LUAD | 2 |
| p.S304F | BLCA | 1 |
| p.V481A | SKCM | 1 |
| p.R396C | CESC | 1 |
| p.E364K | BLCA | 1 |
| p.F266C | UCEC | 1 |
| p.A441D | BLCA | 1 |
| p.P116T | ESCA | 1 |
| p.I398M | HNSC | 1 |
| p.V167F | LUAD | 1 |
| p.S94L | BLCA | 1 |
| p.R396C | SKCM | 1 |
| p.A162D | HNSC | 1 |
| p.R17Q | COAD | 1 |
| p.G493R | SKCM | 1 |
| p.V333L | BRCA | 1 |
| p.C343F | ESCA | 1 |
| p.P448L | SKCM | 1 |
| p.H469N | READ | 1 |
| p.V139A | UCEC | 1 |
| p.R318I | UCEC | 1 |
| p.P411L | SKCM | 1 |
| p.V518A | SKCM | 1 |
| p.E469K | STAD | 1 |
| p.R318K | THYM | 1 |
| p.M143I | BLCA | 1 |
| p.C370S | OV | 1 |
| p.A19S | LUAD | 1 |
| p.I297L | UCEC | 1 |
| p.A225V | SKCM | 1 |
| p.E472K | UCEC | 1 |
| p.E195D | BRCA | 1 |
| p.D303N | STAD | 1 |
| p.G436V | LUAD | 1 |
| p.K295N | UCS | 1 |
| p.G50V | LUAD | 1 |
| p.I4V | LUAD | 1 |
| p.V87I | BRCA | 1 |
| p.C343Y | BRCA | 1 |
| p.F248L | UCEC | 1 |
| p.D480Y | UCEC | 1 |
| p.A512V | ESCA | 1 |
| p.E192K | THCA | 1 |
| p.D279G | PCPG | 1 |
| p.D261G | READ | 1 |
| p.V80I | COAD | 1 |
| p.E170X | READ | 1 |
| p.I119T | BRCA | 1 |
| p.F360L | STAD | 1 |
| p.A262V | SKCM | 1 |
| p.E257V | KIRC | 1 |
| p.S236L | BLCA | 1 |
| p.K197R | LIHC | 1 |
| p.D166N | LIHC | 1 |
| p.T242P | STAD | 1 |
| p.E195D | LUAD | 1 |
| p.D298H | CESC | 1 |
| p.G308E | COAD | 1 |
| p.P72Q | PCPG | 1 |
| p.E220D | COAD | 1 |
| p.E352K | ESCA | 1 |
| p.R17Q | BRCA | 1 |
| p.K381N | STAD | 1 |
| p.R396C | UCEC | 1 |
| p.D150Y | LUAD | 1 |
| p.E257D | BLCA | 1 |
| p.K265N | UCEC | 1 |
| p.K219N | READ | 1 |
| p.L468I | COAD | 1 |
| p.R217H | COAD | 1 |
| p.Q294E | BLCA | 1 |
| Top |
| TissGeneCNV for CCT6B |
| Copy number variations of TissGene across 28 cancer types (X-axis: cancer type and Y-axis: % of CNV samples) (TCGA Gistic2_CopyNumber_Gistic2_all_data_by_genes, Gistic2 copy number data, version 2016-08-16) |
 |
| Top |
| TissGeneFusions for CCT6B |
| Fusion genes including TissGene (ChimerDB 3.0, 2016-12-01 and TCGA fusion Portal 2015-12-01) |
| Database | Src | Cancer type | Sample | Fusion gene | ORF | 5'-gene BP | 3'-gene BP |
| Chimerdb3.0 | FusionScan | ESCA | TCGA-V5-A7RE-01A | CDC27-CCT6B | In-Frame | chr17:45266511 | chr17:33281618 |
| Chimerdb3.0 | FusionScan | ESCA | TCGA-V5-A7RE-01A | CDC27-CCT6B | In-Frame | chr17:45266511 | chr17:33285713 |
| Top |
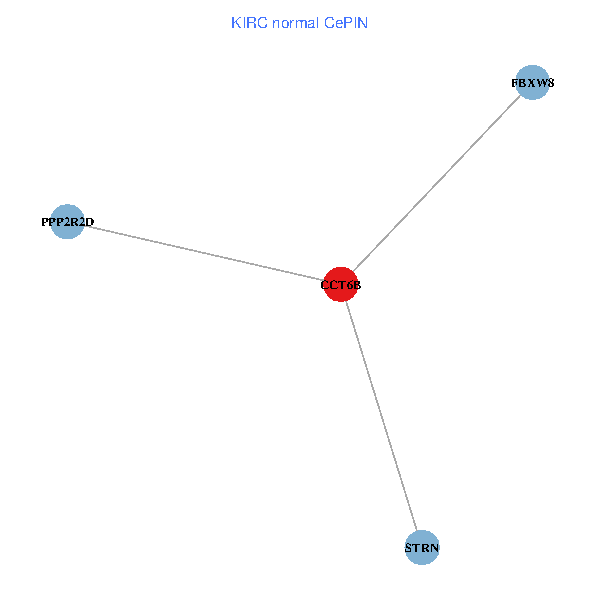
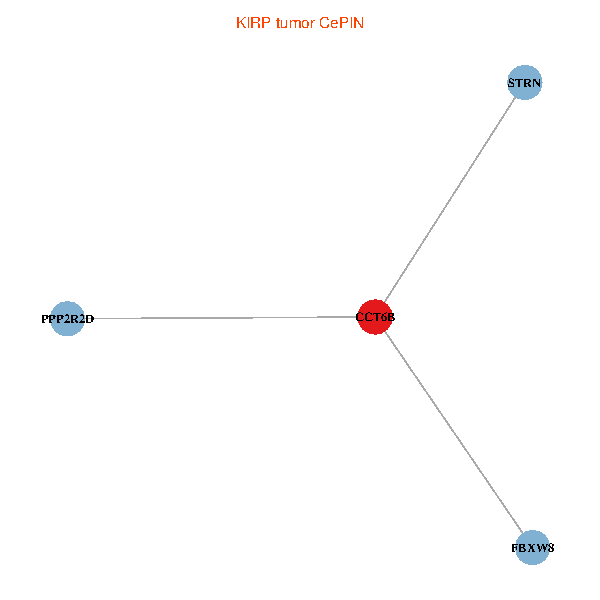
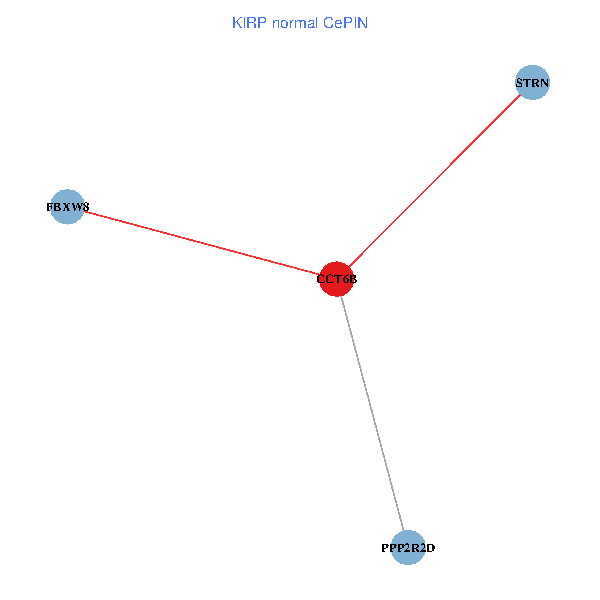
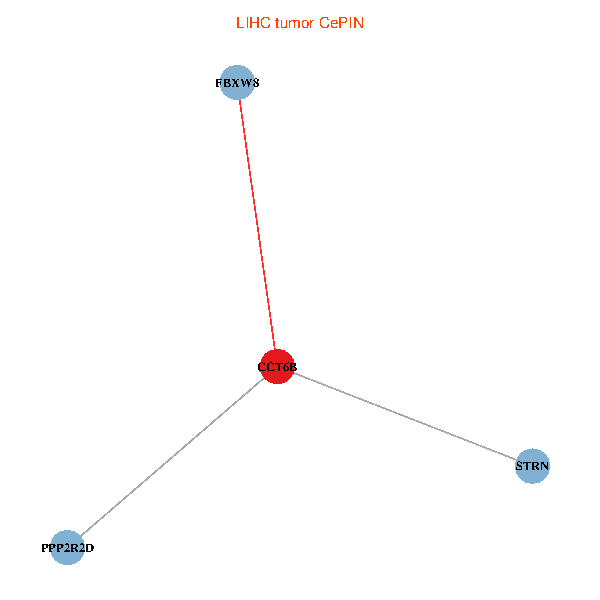
| TissGeneNet for CCT6B |
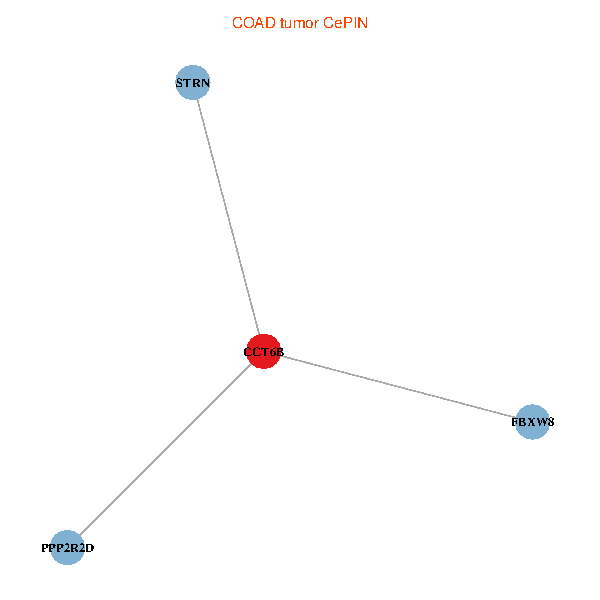
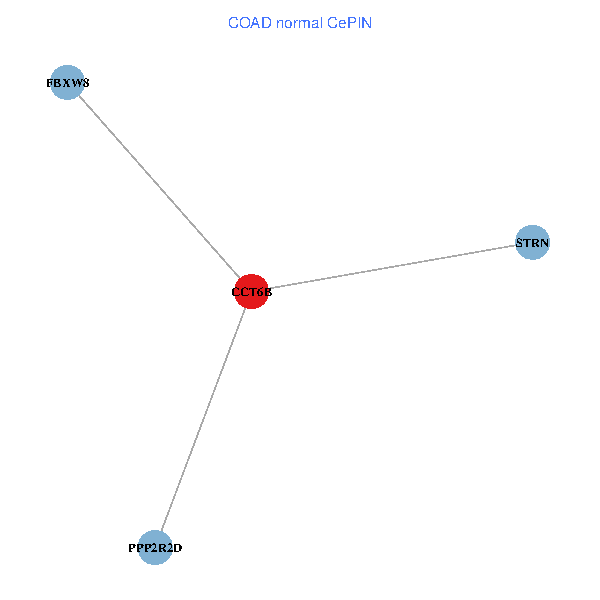
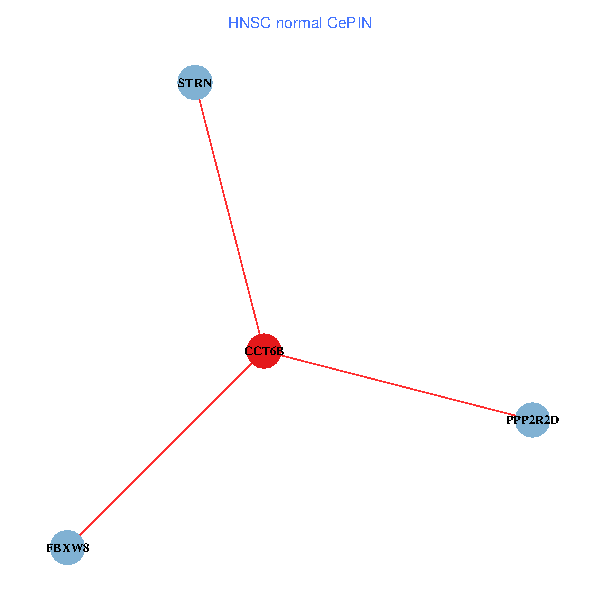
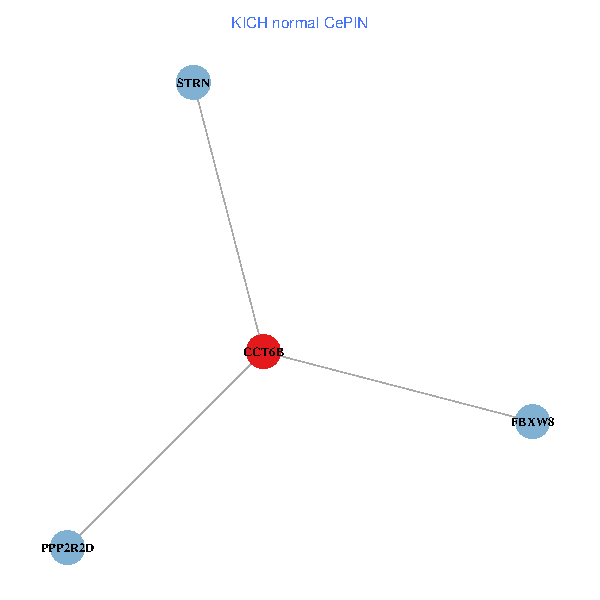
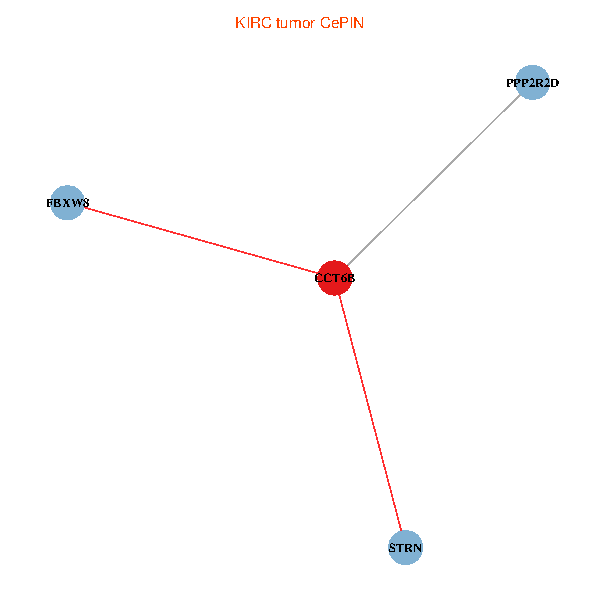
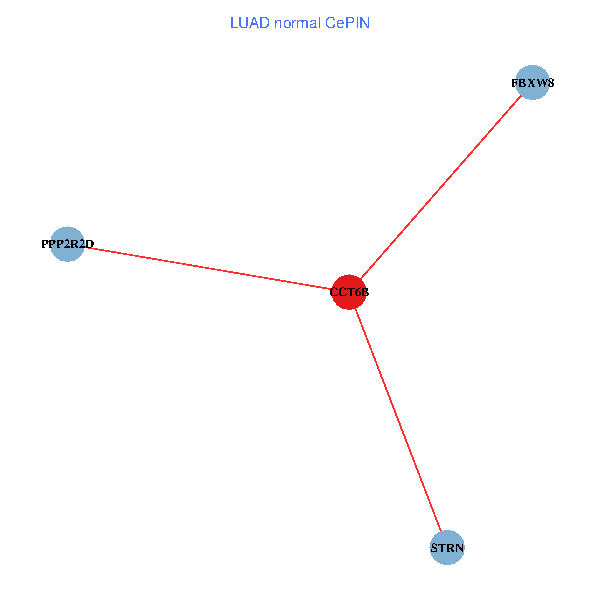
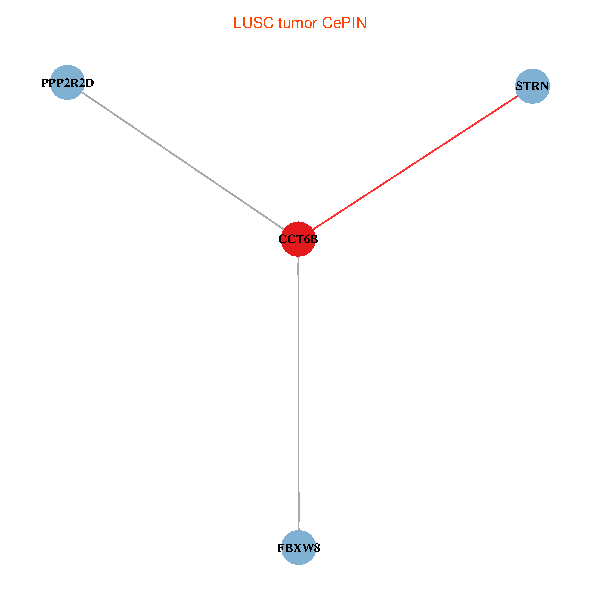
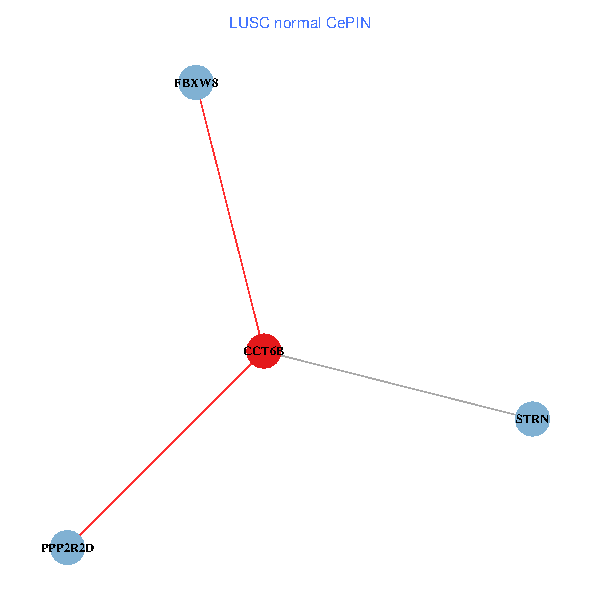
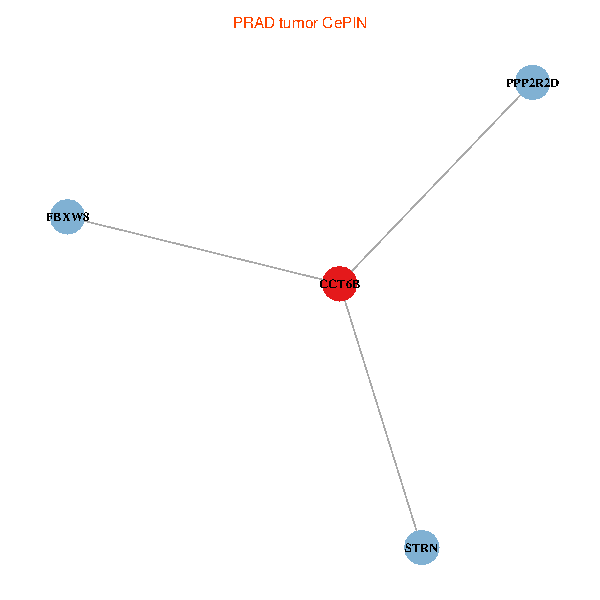
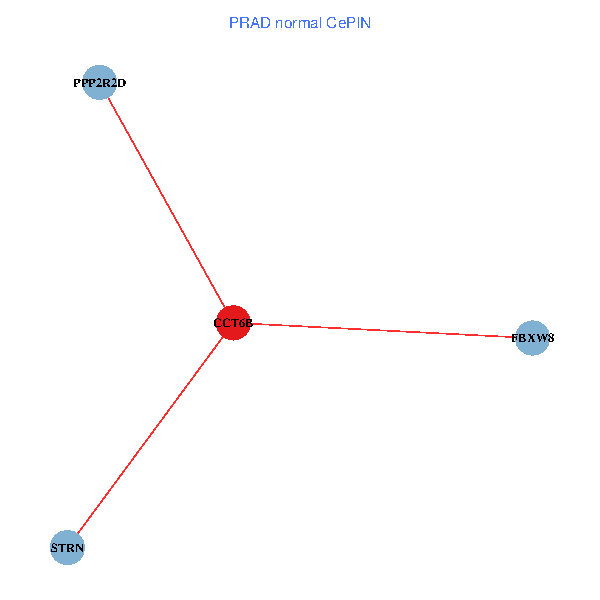
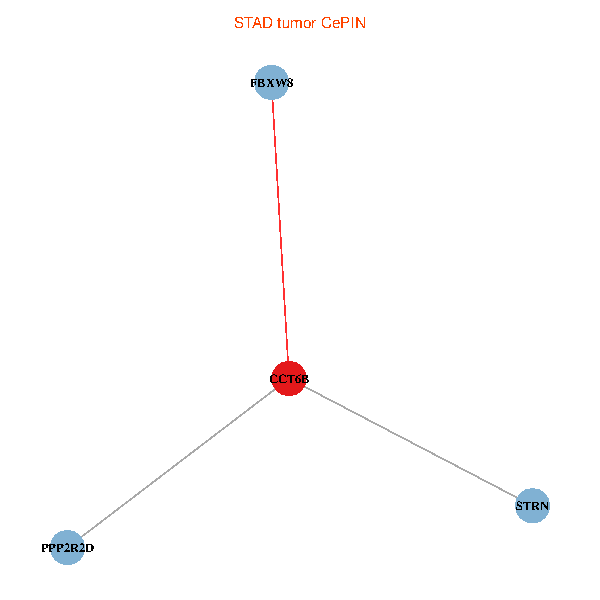
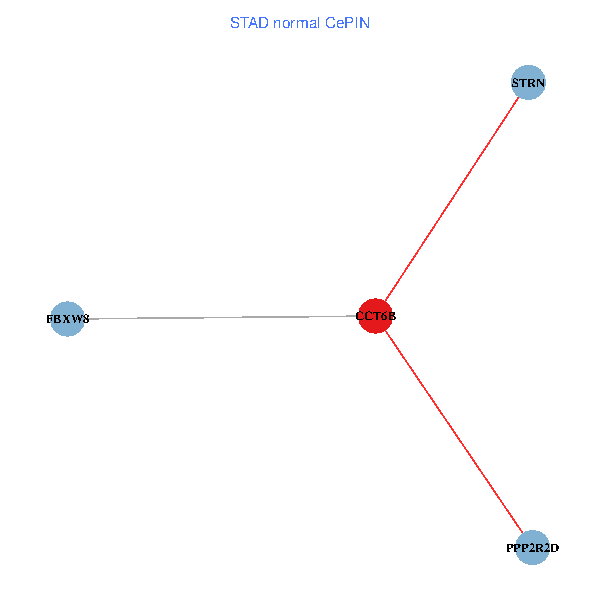
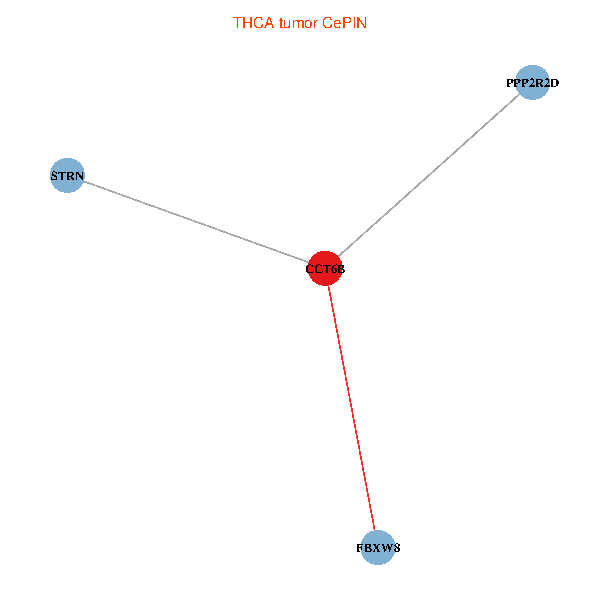
| Co-expressed gene networks based on protein-protein interaction data (CePIN) (TCGA IlluminaHiSeq_RNASeqV2, pan-cancer normalized log2(norm_counts+1) data, version 2016-08-16) (PINA2 ppi data) |
| BRCA (tumor) | BRCA (normal) |
| CCT6B, PPP2R2D, STRN, FBXW8 (tumor) | CCT6B, PPP2R2D, STRN, FBXW8 (normal) |
 |  |
| COAD (tumor) | COAD (normal) |
| CCT6B, PPP2R2D, STRN, FBXW8 (tumor) | CCT6B, PPP2R2D, STRN, FBXW8 (normal) |
 |  |
| HNSC (tumor) | HNSC (normal) |
| CCT6B, PPP2R2D, STRN, FBXW8 (tumor) | CCT6B, PPP2R2D, STRN, FBXW8 (normal) |
 |  |
| KICH (tumor) | KICH (normal) |
| CCT6B, PPP2R2D, STRN, FBXW8 (tumor) | CCT6B, PPP2R2D, STRN, FBXW8 (normal) |
 |  |
| KIRC (tumor) | KIRC (normal) |
| CCT6B, PPP2R2D, STRN, FBXW8 (tumor) | CCT6B, PPP2R2D, STRN, FBXW8 (normal) |
 |  |
| KIRP (tumor) | KIRP (normal) |
| CCT6B, PPP2R2D, STRN, FBXW8 (tumor) | CCT6B, PPP2R2D, STRN, FBXW8 (normal) |
 |  |
| LIHC (tumor) | LIHC (normal) |
| CCT6B, PPP2R2D, STRN, FBXW8 (tumor) | CCT6B, PPP2R2D, STRN, FBXW8 (normal) |
 |  |
| LUAD (tumor) | LUAD (normal) |
| CCT6B, PPP2R2D, STRN, FBXW8 (tumor) | CCT6B, PPP2R2D, STRN, FBXW8 (normal) |
 |  |
| LUSC (tumor) | LUSC (normal) |
| CCT6B, PPP2R2D, STRN, FBXW8 (tumor) | CCT6B, PPP2R2D, STRN, FBXW8 (normal) |
 |  |
| PRAD (tumor) | PRAD (normal) |
| CCT6B, PPP2R2D, STRN, FBXW8 (tumor) | CCT6B, PPP2R2D, STRN, FBXW8 (normal) |
 |  |
| STAD (tumor) | STAD (normal) |
| CCT6B, PPP2R2D, STRN, FBXW8 (tumor) | CCT6B, PPP2R2D, STRN, FBXW8 (normal) |
 |  |
| THCA (tumor) | THCA (normal) |
| CCT6B, PPP2R2D, STRN, FBXW8 (tumor) | CCT6B, PPP2R2D, STRN, FBXW8 (normal) |
 |  |
| Top |
| TissGeneProg for CCT6B |
| Kaplan-Meier plots with logrank tests of overall survival (OS) using 28 cancer types (TCGA IlluminaHiSeq_RNASeqV2, pan-cancer normalized log2(norm_counts+1) data, version 2016-08-16) (TCGA clinicalMatrix, phenotype data, version 2016-04-27) * Click on the image to enlarge it in a new window. |
 |
| Kaplan-Meier plots with logrank test of relapse free survival (RFS) using 28 cancer types (TCGA IlluminaHiSeq_RNASeqV2, pan-cancer normalized log2(norm_counts+1) data, version 2016-08-16) (TCGA clinicalMatrix, phenotype data, version 2016-04-27) * Click on the image enlarge it in a new window. |
 |
| Forest plot of Cox proportional hazard ratio (HR) and 95% CI of overall survival (OS) using 28 cancer types (TCGA IlluminaHiSeq_RNASeqV2, pan-cancer normalized log2(norm_counts+1) data, version 2016-08-16) (TCGA clinicalMatrix, phenotype data, version 2016-04-27) * Click on the image enlarge it in a new window. |
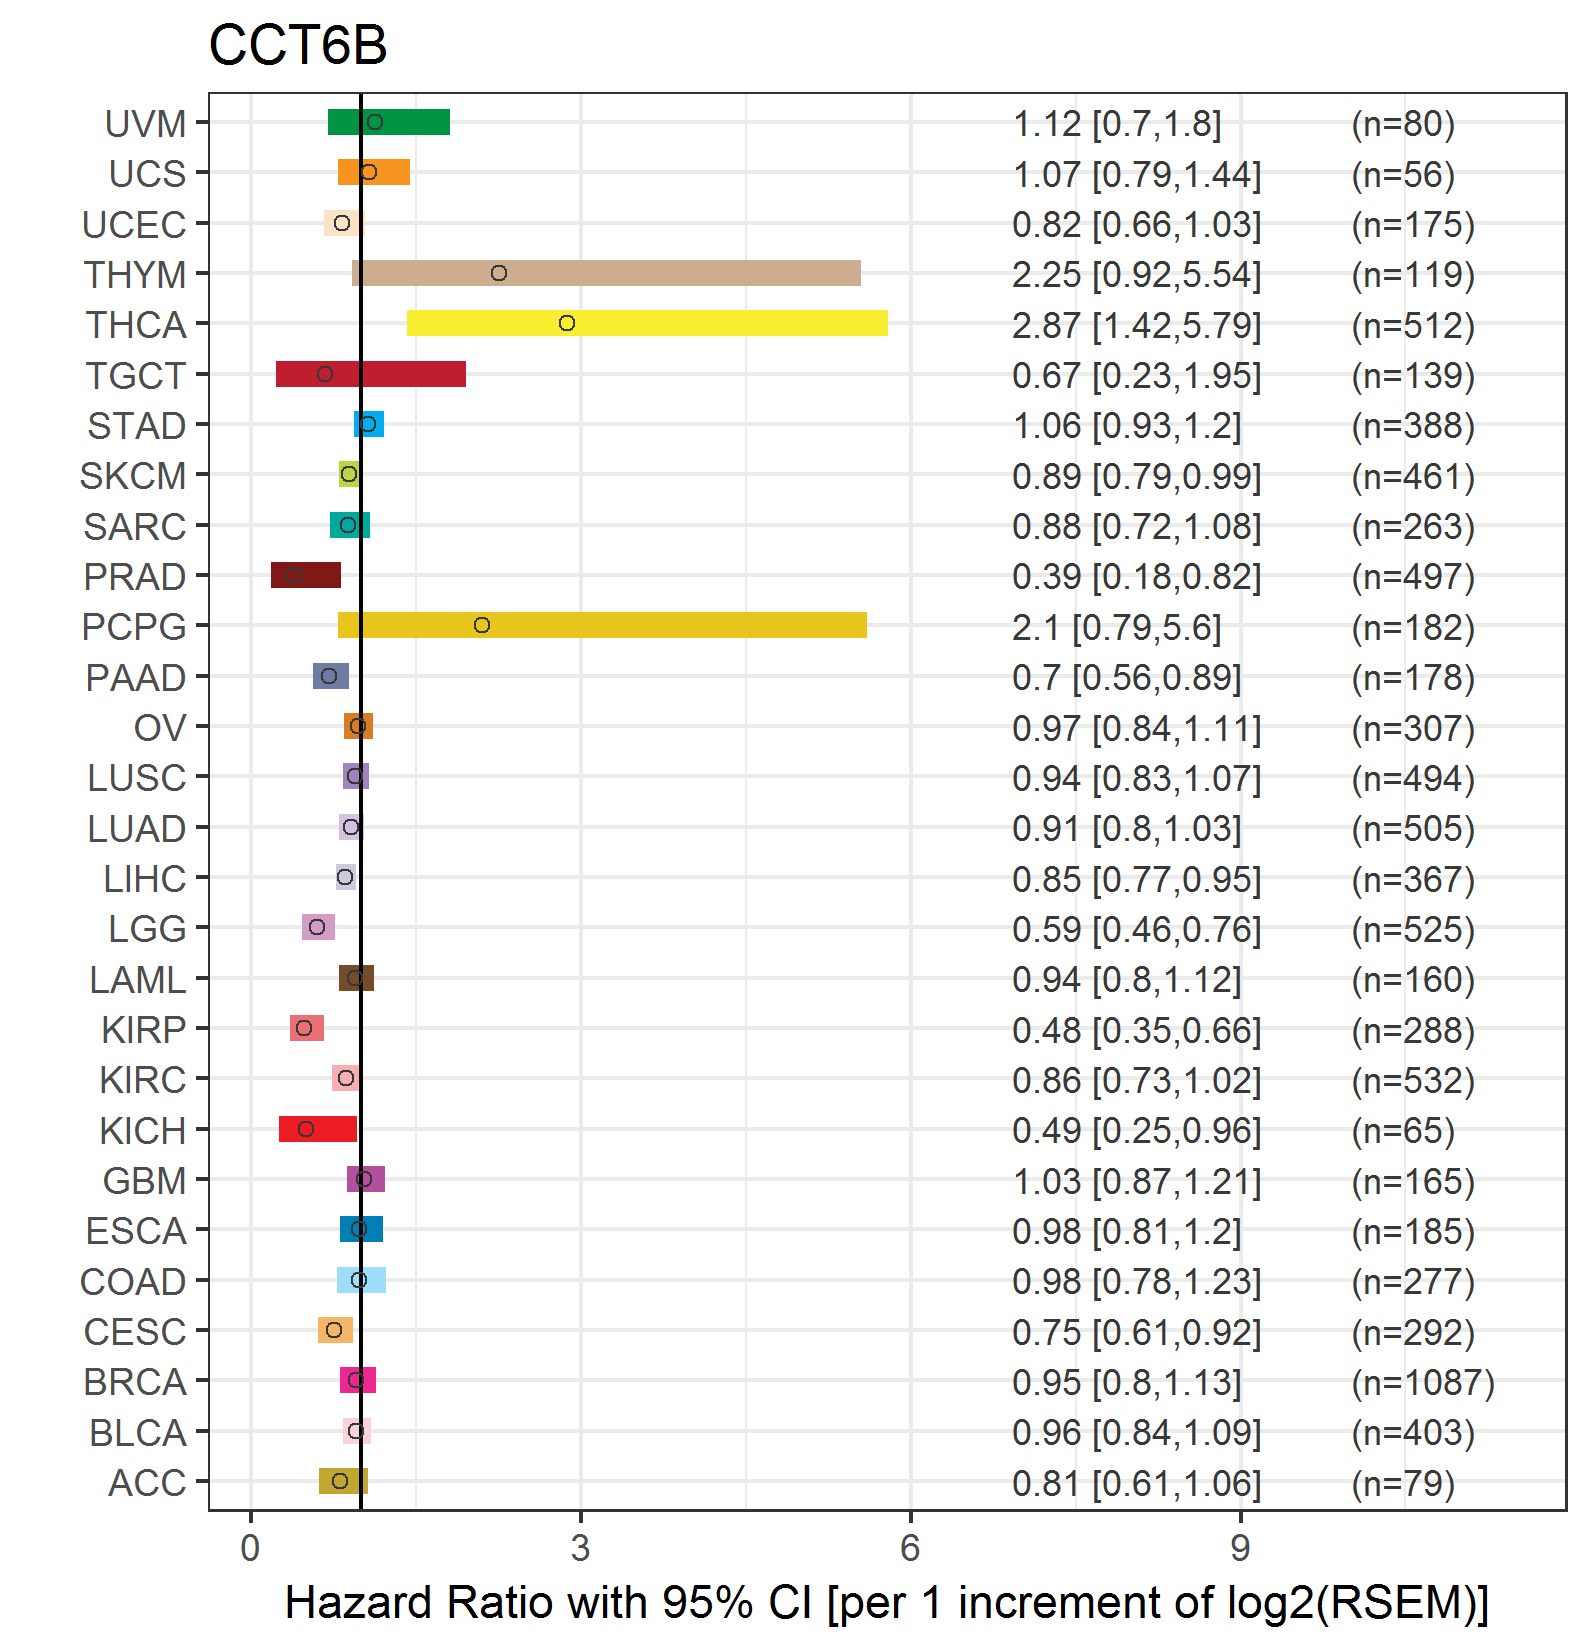 |
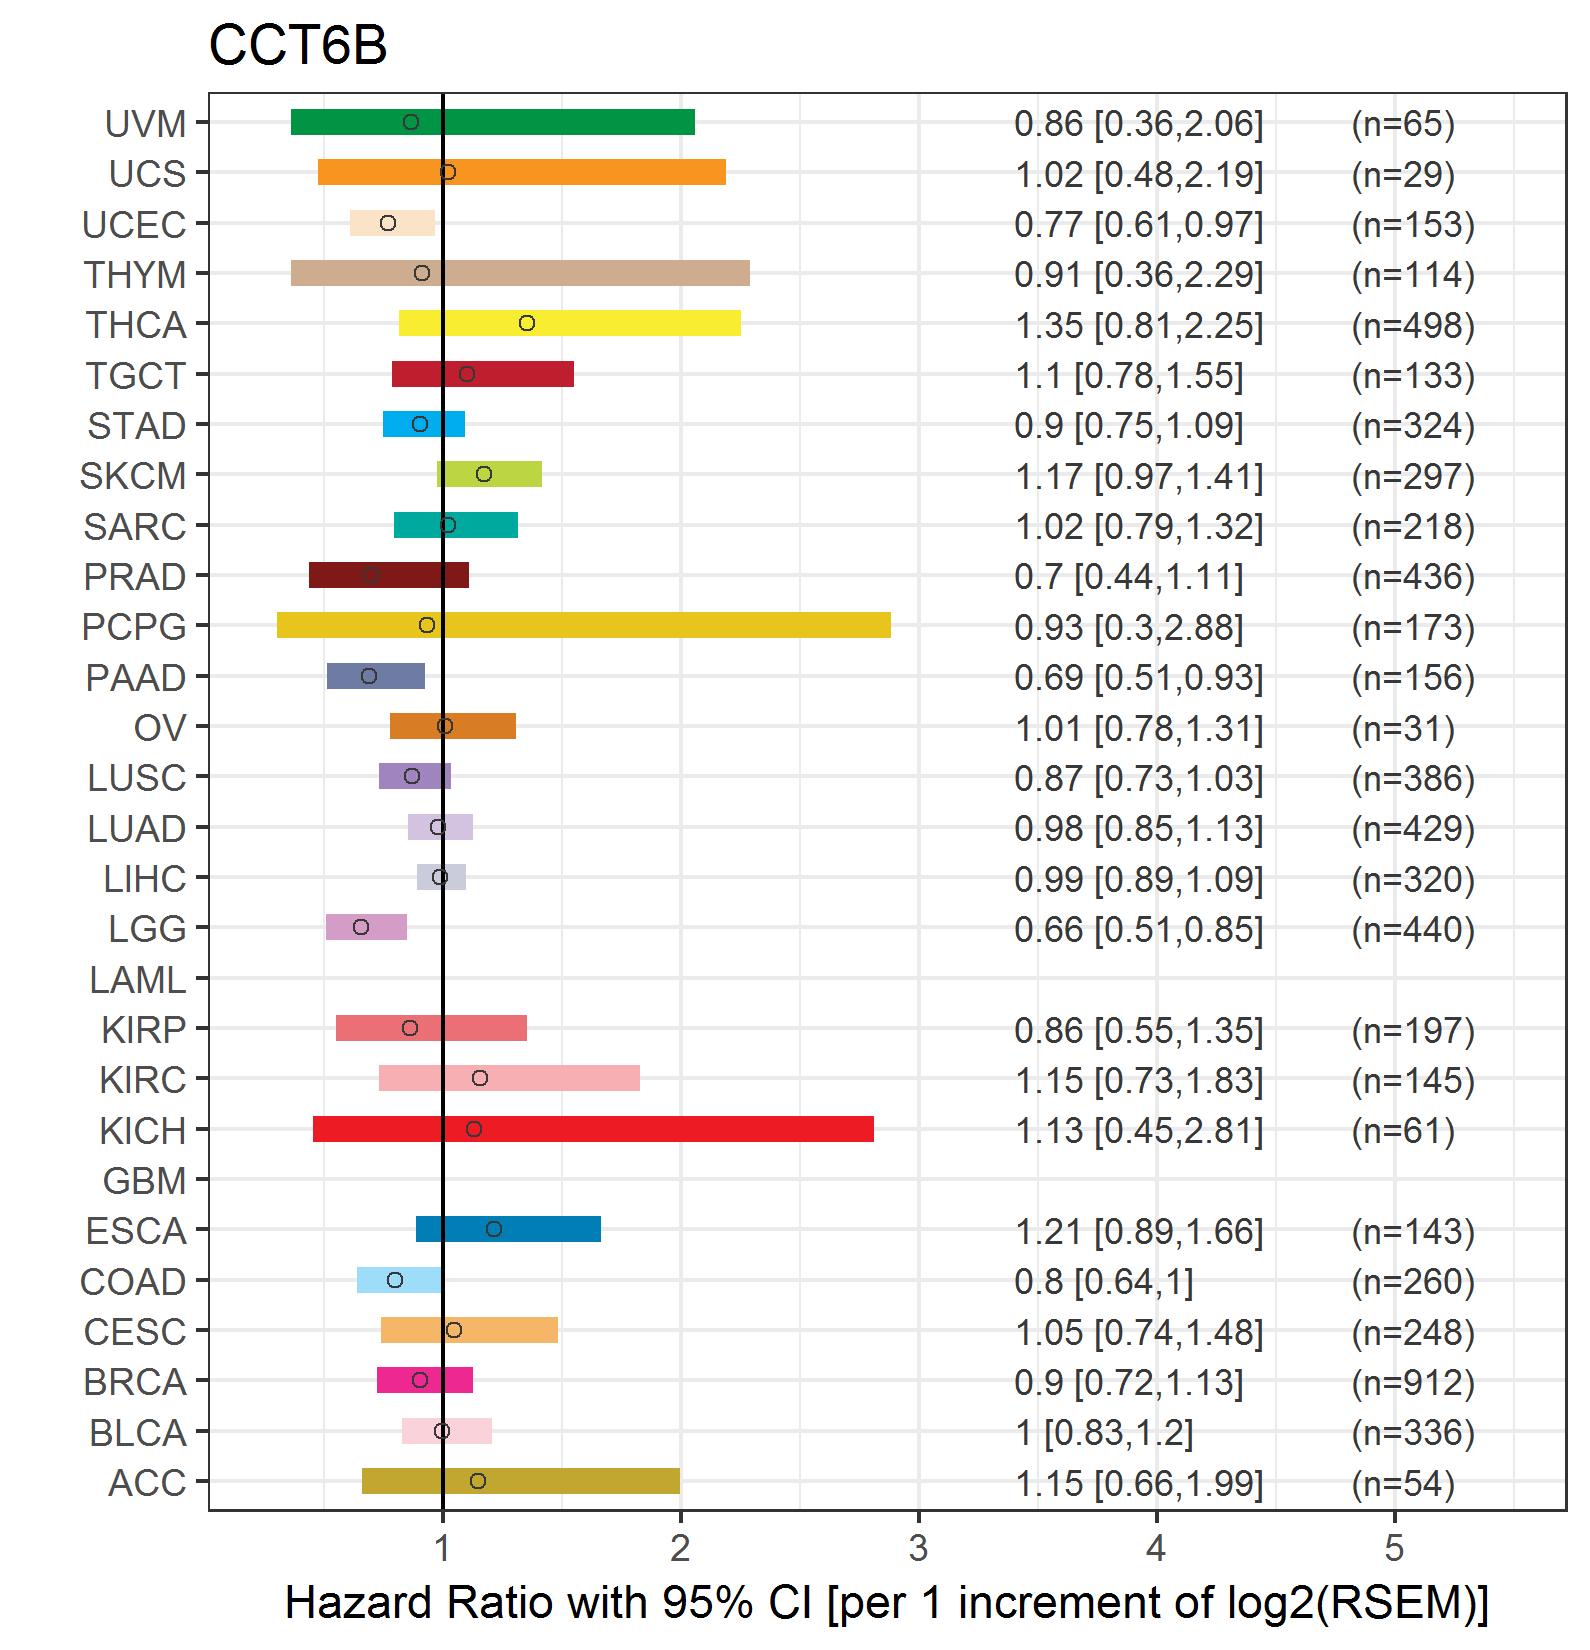
| Forest plot of Cox proportional hazard ratio (HR) and 95% CI of relapse free survival (RFS) using 28 cancer types (TCGA IlluminaHiSeq_RNASeqV2, pan-cancer normalized log2(norm_counts+1) data, version 2016-08-16) (TCGA clinicalMatrix, phenotype data, version 2016-04-27) * Click on the image enlarge it in a new window. |
 |
| Top |
| TissGeneClin for CCT6B |
| TissGeneDrug for CCT6B |
| Drug information targeting TissGene (DrugBank Version 5.0.6, 2017-04-01) |
| DrugBank ID | Drug name | Drug activity | Drug type | Drug status |
| Top |
| TissGeneDisease for CCT6B |
| Disease information associated with TissGene (DisGeNet, 2016-06-01) |
| Disease ID | Disease name | # pubmeds | Source |
| umls:C0006413 | Burkitt Lymphoma | 1 | CTD_human |
|
Copyright 2016-Present - The University of Texas Health Science Center at Houston (UTHealth) Web File Viewing | How to Report, Fraud, Waste and Abuse | State of Texas | Statewide Search | Texas Homeland Security | Site Policies |