 |
| |
| |
| |
| |
| |
| |
|

| TissGeneSummary for RUNDC3A |
 Gene summary Gene summary |
| Basic gene information | Gene symbol | RUNDC3A |
| Gene name | RUN domain containing 3A | |
| Synonyms | RAP2IP|RPIP-8|RPIP8 | |
| Cytomap | UCSC genome browser: 17q21.31 | |
| Type of gene | protein-coding | |
| RefGenes | NM_001144825.1, NM_001144826.1,NM_006695.4, | |
| Description | RUN domain-containing protein 3ARaP2 interacting protein 8rap2-interacting protein 8 | |
| Modification date | 20141207 | |
| dbXrefs | MIM : 605448 | |
| HGNC : HGNC | ||
| Ensembl : ENSG00000108309 | ||
| HPRD : 16106 | ||
| Vega : OTTHUMG00000169259 | ||
| Protein | UniProt: go to UniProt's Cross Reference DB Table | |
| Expression | CleanEX: HS_RUNDC3A | |
| BioGPS: 10900 | ||
| Pathway | NCI Pathway Interaction Database: RUNDC3A | |
| KEGG: RUNDC3A | ||
| REACTOME: RUNDC3A | ||
| Pathway Commons: RUNDC3A | ||
| Context | iHOP: RUNDC3A | |
| ligand binding site mutation search in PubMed: RUNDC3A | ||
| UCL Cancer Institute: RUNDC3A | ||
| Assigned class in TissGDB* | C | |
| Included tissue-specific gene expression resources | HPA,TiGER | |
| Specific-tissues in normal samples (assigned by TissGDB using HPA, TiGER, and GTEx) | Brain | |
| Cancer types related to the specific-tissues in cancer samples (assigned by TissGDB using TCGA) | GBM,LGG | |
| Reference showing the relevant tissue of RUNDC3A | ||
| Description by TissGene annotations | Protective TissGene in OS | |
| * Class A consists of genes with literature evidence and is part of the cTissGenes. Class B consists of only cTissGenes without additional evidence. The remaining genes belong to Class C. |
| Gene ontology having evidence of Inferred from Direct Assay (IDA) from Entrez |
| GO ID | GO term | PubMed ID |
| Top |
| TissGeneExp for RUNDC3A |
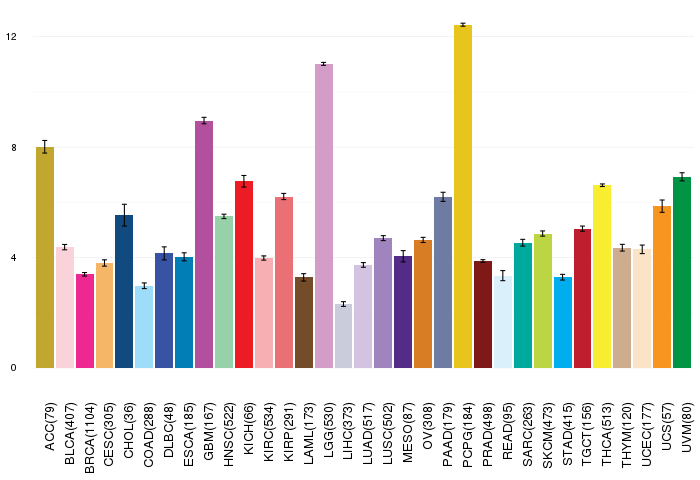
| Gene expressions across 28 cancer types (X-axis: cancer type and Y-axis: log2(norm_counts+1)) (TCGA IlluminaHiSeq_RNASeqV2, pan-cancer normalized log2(norm_counts+1) data, version 2016-08-16) |
 |
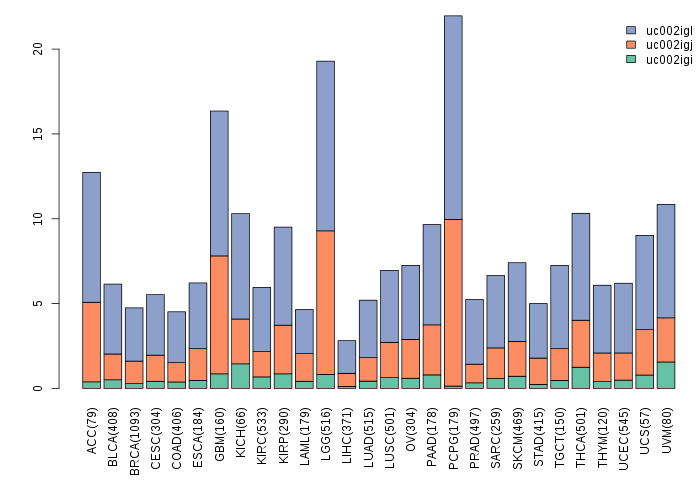
| Gene isoform expressions across 28 cancer types (X-axis: cancer type and Y-axis: log2(norm_counts+1)) (TCGA pan-cancer tcga_rsem_isoform_tpm, version 2016-09-01) |
 |
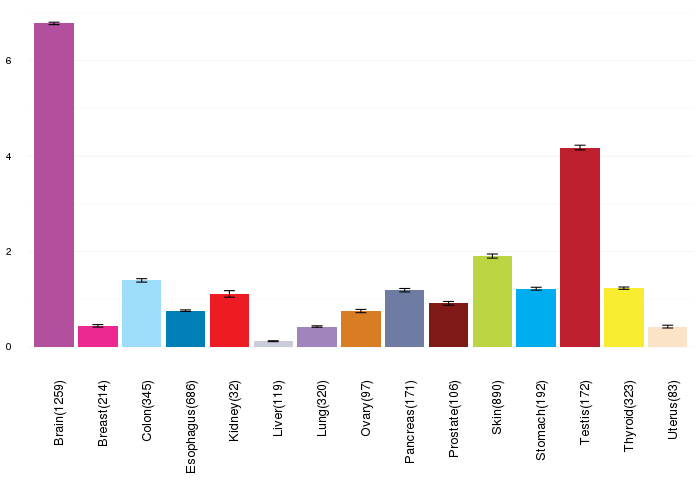
| Gene expressions across normal tissues of GTEx data (GTEx GTEx_Analysis_v6_RNA-seq_RNA-SeQCv1.1.8_gene_rpkm.gct) - Here, we shows the matched tissue types only among our 28 cancer types. |
 |
| Different expressions across 14 cancer types with more than 10 samples between matched tumors and normals (X-axis: cancer type and Y-axis: log2(norm_counts+1)) (TCGA IlluminaHiSeq_RNASeqV2, pan-cancer normalized log2(norm_counts+1) data, version 2016-08-16) |
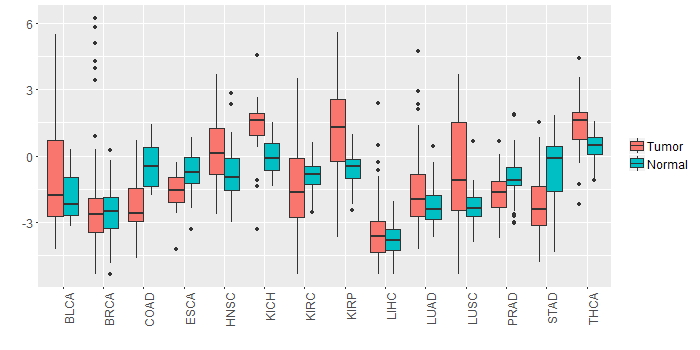 |
| - Significantly differentially expressed cancer types and information. (|Fold change|>1 and FDR<0.05) |
| Cancer type | Mean(exp) in tumor | Mean(exp) in matched normal | Log2FC | P-val. | FDR |
| COAD | -2.15971109 | -0.366888013 | -1.792823077 | 4.65E-06 | 2.29E-05 |
| LUSC | -0.475644273 | -2.317765842 | 1.842121569 | 5.67E-07 | 1.46E-06 |
| KICH | 1.213981217 | -0.158046783 | 1.372028 | 0.000204 | 0.000502926 |
| KIRP | 1.112815592 | -0.582928158 | 1.69574375 | 0.000147 | 0.000483246 |
| STAD | -2.225078158 | -0.513700033 | -1.711378125 | 2.00E-05 | 0.000203529 |
| Top |
| TissGene-miRNA for RUNDC3A |
| Significantly anti-correlated miRNAs of TissGene across 28 cancer types (Gene-miRNA relations from TargetScanHuman Relsease 7.1, Conserved_Site_Context_Scores.txt.zip, 06.01.2016) (TCGA IlluminaHiSeq_miRNASeq, log2(RPM+1) data, version 2016-11-21) (TCGA IlluminaHiSeq_RNASeqV2, log2(normalized_count+1) data, version 2016-08-16) (Spearman’s Rank Correlation (p-value<0.05 and coefficient<-0.25)) |
| Cancer type | miRNA id | miRNA accession | P-val. | Coeff. | # samples |
| Top |
| TissGeneMut for RUNDC3A |
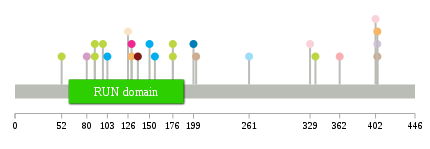
| TissGeneSNV for RUNDC3A |
| nsSNV counts per each loci. Different colors of circles represent different cancer types. Circle size denotes number of samples. (TCGA somatic mutation (SNPs and small INDELs) data, version 2016-04-25) * Click on the image to enlarge it in a new window. |
 |
 |
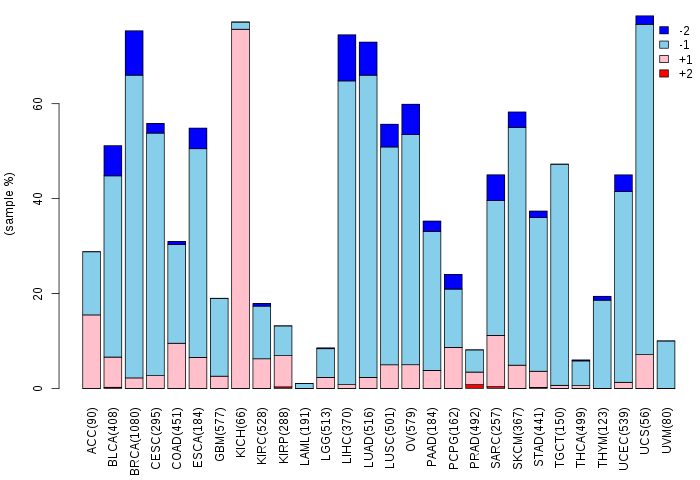
| Somatic nucleotide variants of TissGene across 28 cancer types (X-axis: cancer type and Y-axis: % of mutated samples) The numbers in parentheses are numbers of samples with mutation (nsSNVs). (TCGA somatic mutation (SNPs and small INDELs) data, version 2016-04-25) |
 |
| - nsSNVs sorted by frequency. |
| AAchange | Cancer type | # samples |
| p.K103N | STAD | 1 |
| p.T404M | CESC | 1 |
| p.G176E | SKCM | 1 |
| p.Y362F | KIRC | 1 |
| p.R98W | SKCM | 1 |
| p.R137H | PRAD | 1 |
| p.T404M | THYM | 1 |
| p.F426V | CHOL | 1 |
| p.Y156C | STAD | 1 |
| p.T202M | THYM | 1 |
| p.S402L | BLCA | 1 |
| p.R130Q | CESC | 1 |
| p.R126W | UCEC | 1 |
| p.L329V | BLCA | 1 |
| p.G80S | LGG | 1 |
| p.I199M | ESCA | 1 |
| p.G309C | READ | 1 |
| p.V261I | COAD | 1 |
| p.G89E | SKCM | 1 |
| p.P404R | LUAD | 1 |
| p.G176R | SKCM | 1 |
| p.G89R | SKCM | 1 |
| p.D52N | SKCM | 1 |
| p.R150Q | STAD | 1 |
| p.E335K | SKCM | 1 |
| p.R130Q | BRCA | 1 |
| p.R126L | HNSC | 1 |
| Top |
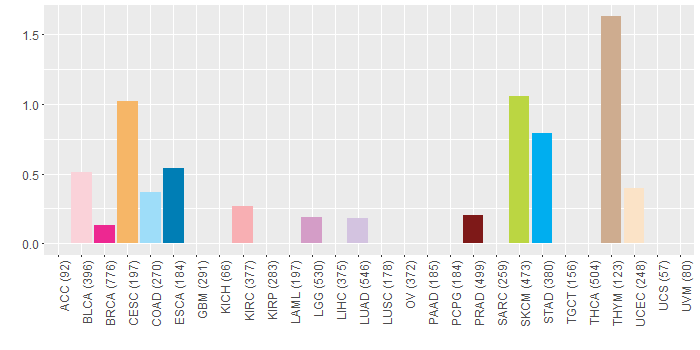
| TissGeneCNV for RUNDC3A |
| Copy number variations of TissGene across 28 cancer types (X-axis: cancer type and Y-axis: % of CNV samples) (TCGA Gistic2_CopyNumber_Gistic2_all_data_by_genes, Gistic2 copy number data, version 2016-08-16) |
 |
| Top |
| TissGeneFusions for RUNDC3A |
| Fusion genes including TissGene (ChimerDB 3.0, 2016-12-01 and TCGA fusion Portal 2015-12-01) |
| Database | Src | Cancer type | Sample | Fusion gene | ORF | 5'-gene BP | 3'-gene BP |
| Chimerdb3.0 | ChiTaRs | NA | DA250813 | C5orf45-RUNDC3A | chr5:179275517 | chr17:42391285 |
| Top |
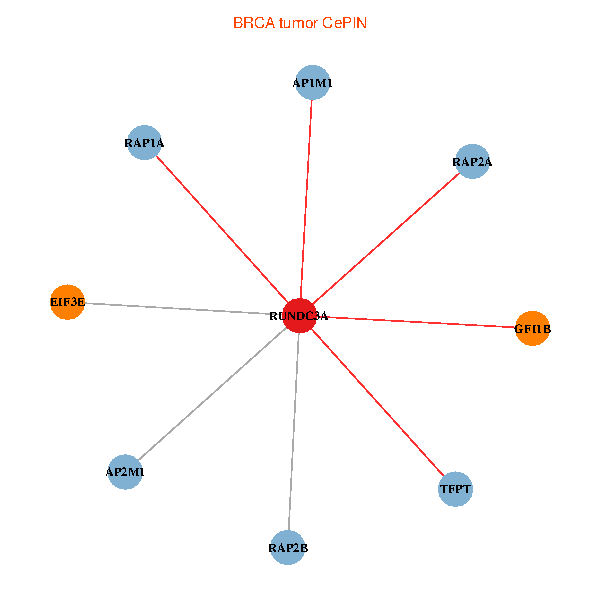
| TissGeneNet for RUNDC3A |
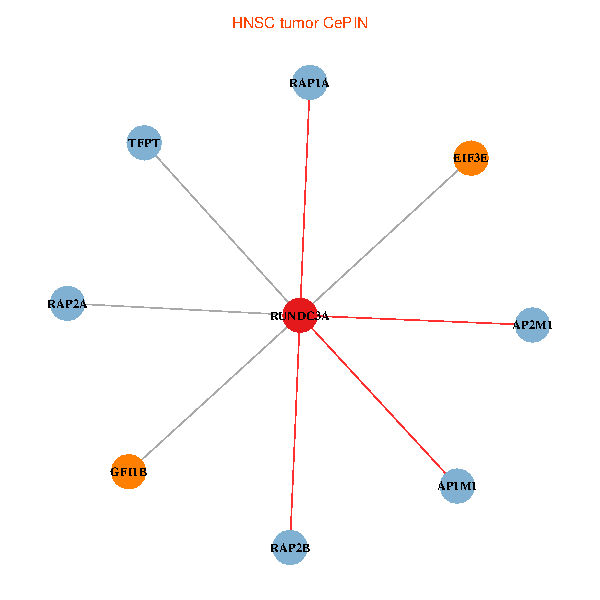
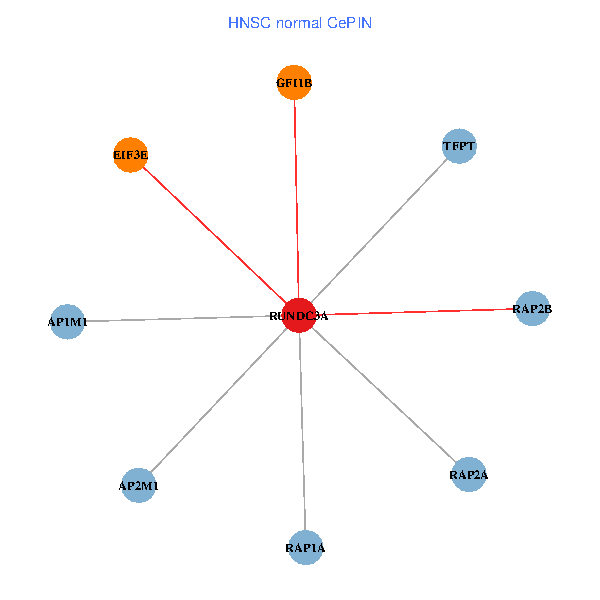
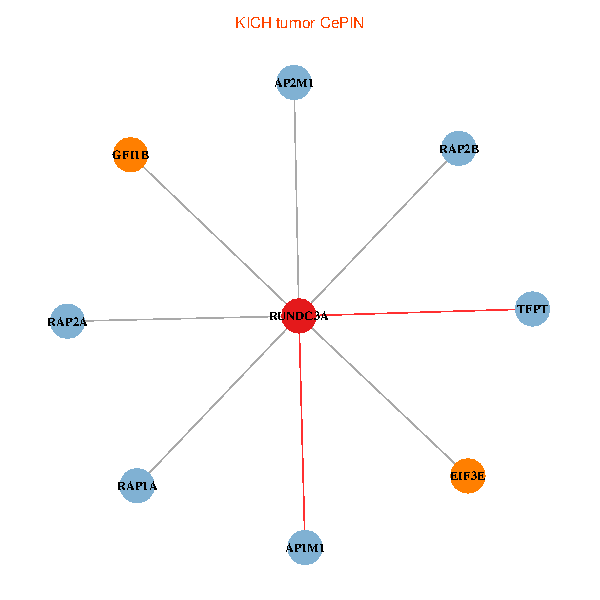
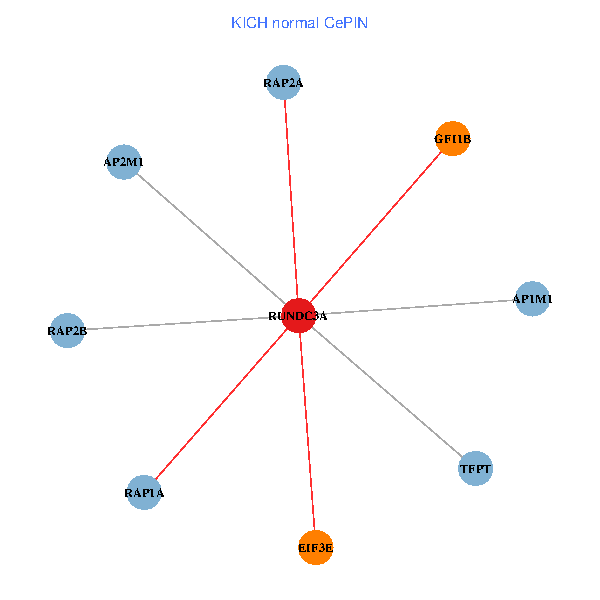
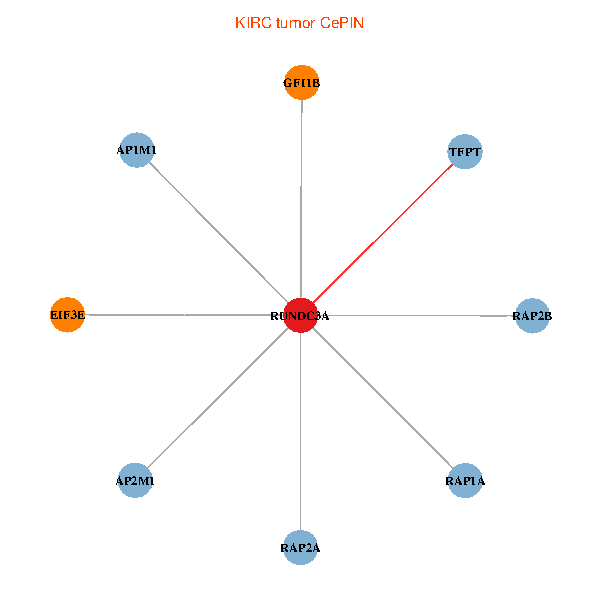
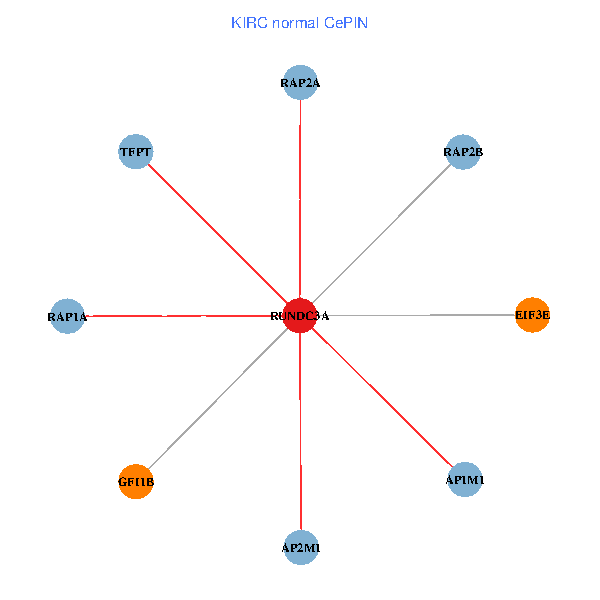
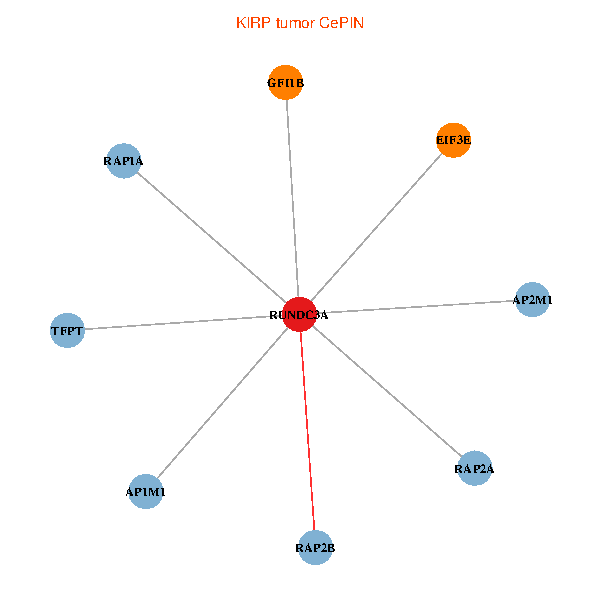
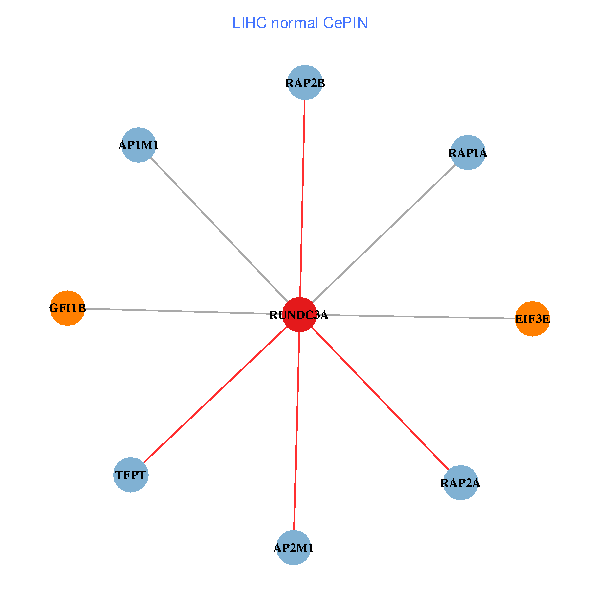
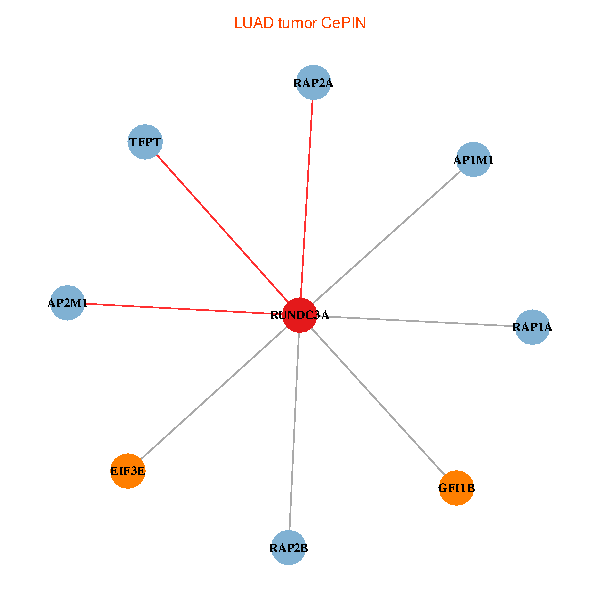
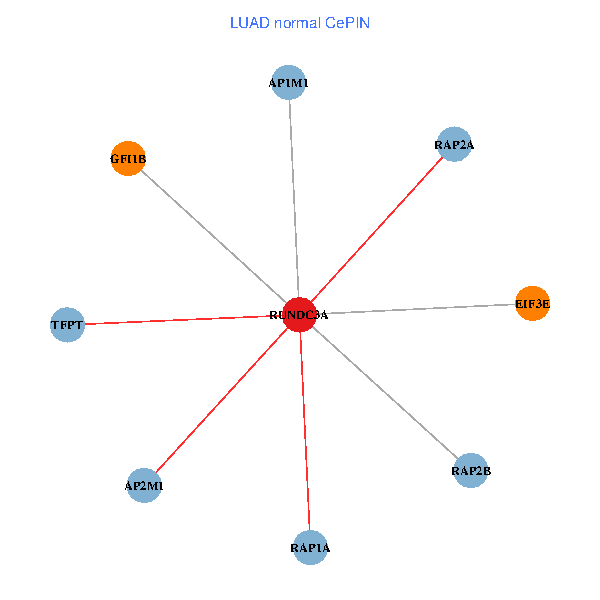
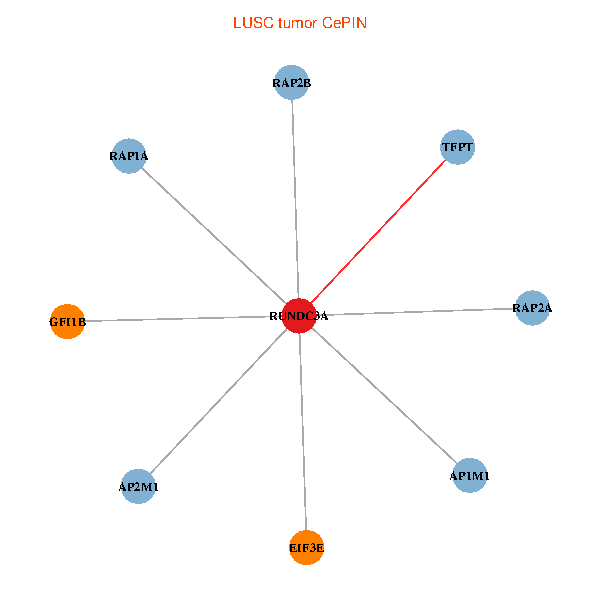
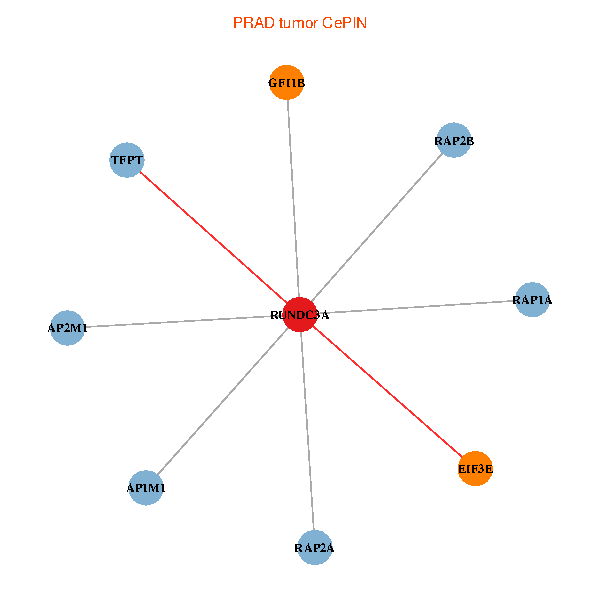
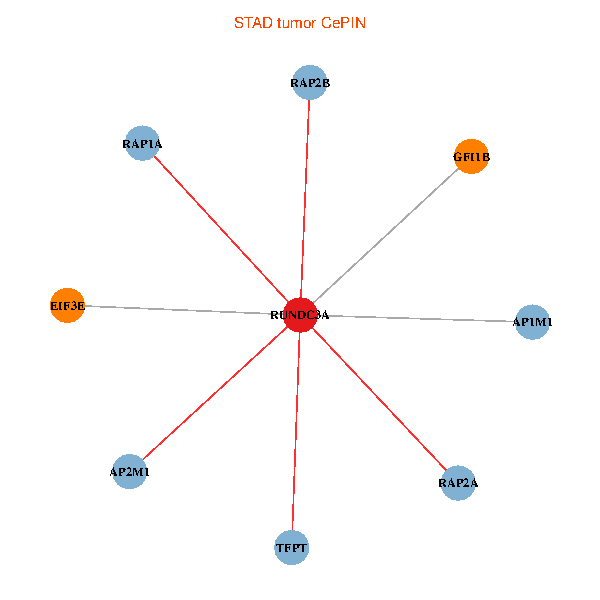
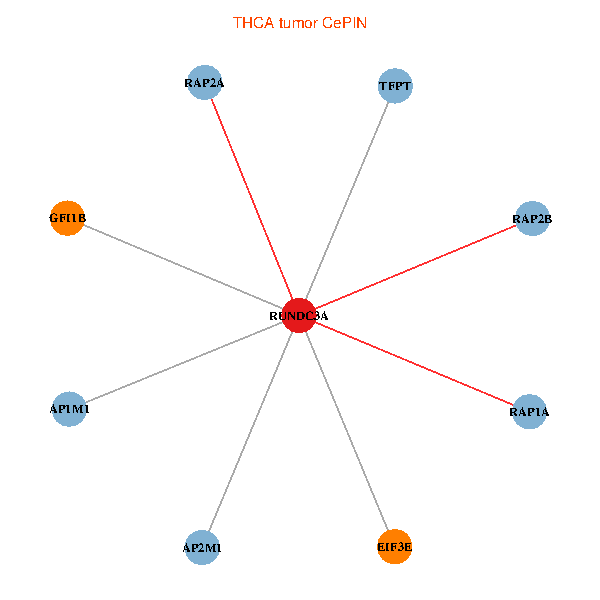
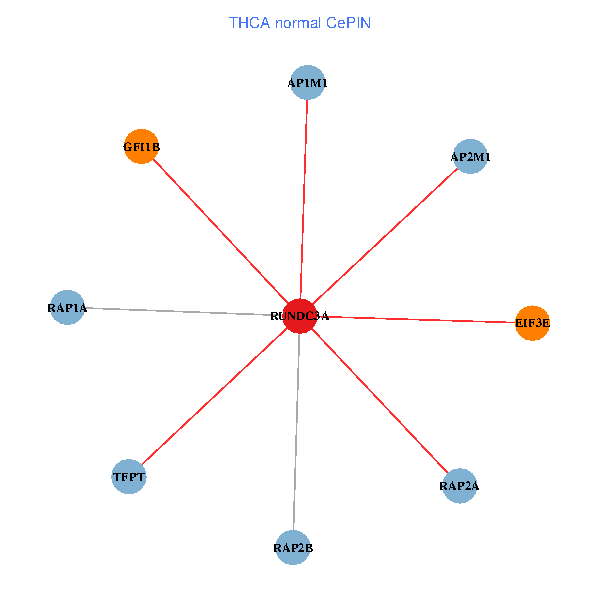
| Co-expressed gene networks based on protein-protein interaction data (CePIN) (TCGA IlluminaHiSeq_RNASeqV2, pan-cancer normalized log2(norm_counts+1) data, version 2016-08-16) (PINA2 ppi data) |
| BRCA (tumor) | BRCA (normal) |
| RUNDC3A, RAP2A, RAP1A, AP1M1, EIF3E, AP2M1, GFI1B, TFPT, RAP2B (tumor) | RUNDC3A, RAP2A, RAP1A, AP1M1, EIF3E, AP2M1, GFI1B, TFPT, RAP2B (normal) |
 |  |
| COAD (tumor) | COAD (normal) |
| RUNDC3A, RAP2A, RAP1A, AP1M1, EIF3E, AP2M1, GFI1B, TFPT, RAP2B (tumor) | RUNDC3A, RAP2A, RAP1A, AP1M1, EIF3E, AP2M1, GFI1B, TFPT, RAP2B (normal) |
 |  |
| HNSC (tumor) | HNSC (normal) |
| RUNDC3A, RAP2A, RAP1A, AP1M1, EIF3E, AP2M1, GFI1B, TFPT, RAP2B (tumor) | RUNDC3A, RAP2A, RAP1A, AP1M1, EIF3E, AP2M1, GFI1B, TFPT, RAP2B (normal) |
 |  |
| KICH (tumor) | KICH (normal) |
| RUNDC3A, RAP2A, RAP1A, AP1M1, EIF3E, AP2M1, GFI1B, TFPT, RAP2B (tumor) | RUNDC3A, RAP2A, RAP1A, AP1M1, EIF3E, AP2M1, GFI1B, TFPT, RAP2B (normal) |
 |  |
| KIRC (tumor) | KIRC (normal) |
| RUNDC3A, RAP2A, RAP1A, AP1M1, EIF3E, AP2M1, GFI1B, TFPT, RAP2B (tumor) | RUNDC3A, RAP2A, RAP1A, AP1M1, EIF3E, AP2M1, GFI1B, TFPT, RAP2B (normal) |
 |  |
| KIRP (tumor) | KIRP (normal) |
| RUNDC3A, RAP2A, RAP1A, AP1M1, EIF3E, AP2M1, GFI1B, TFPT, RAP2B (tumor) | RUNDC3A, RAP2A, RAP1A, AP1M1, EIF3E, AP2M1, GFI1B, TFPT, RAP2B (normal) |
 |  |
| LIHC (tumor) | LIHC (normal) |
| RUNDC3A, RAP2A, RAP1A, AP1M1, EIF3E, AP2M1, GFI1B, TFPT, RAP2B (tumor) | RUNDC3A, RAP2A, RAP1A, AP1M1, EIF3E, AP2M1, GFI1B, TFPT, RAP2B (normal) |
 |  |
| LUAD (tumor) | LUAD (normal) |
| RUNDC3A, RAP2A, RAP1A, AP1M1, EIF3E, AP2M1, GFI1B, TFPT, RAP2B (tumor) | RUNDC3A, RAP2A, RAP1A, AP1M1, EIF3E, AP2M1, GFI1B, TFPT, RAP2B (normal) |
 |  |
| LUSC (tumor) | LUSC (normal) |
| RUNDC3A, RAP2A, RAP1A, AP1M1, EIF3E, AP2M1, GFI1B, TFPT, RAP2B (tumor) | RUNDC3A, RAP2A, RAP1A, AP1M1, EIF3E, AP2M1, GFI1B, TFPT, RAP2B (normal) |
 |  |
| PRAD (tumor) | PRAD (normal) |
| RUNDC3A, RAP2A, RAP1A, AP1M1, EIF3E, AP2M1, GFI1B, TFPT, RAP2B (tumor) | RUNDC3A, RAP2A, RAP1A, AP1M1, EIF3E, AP2M1, GFI1B, TFPT, RAP2B (normal) |
 |  |
| STAD (tumor) | STAD (normal) |
| RUNDC3A, RAP2A, RAP1A, AP1M1, EIF3E, AP2M1, GFI1B, TFPT, RAP2B (tumor) | RUNDC3A, RAP2A, RAP1A, AP1M1, EIF3E, AP2M1, GFI1B, TFPT, RAP2B (normal) |
 |  |
| THCA (tumor) | THCA (normal) |
| RUNDC3A, RAP2A, RAP1A, AP1M1, EIF3E, AP2M1, GFI1B, TFPT, RAP2B (tumor) | RUNDC3A, RAP2A, RAP1A, AP1M1, EIF3E, AP2M1, GFI1B, TFPT, RAP2B (normal) |
 |  |
| Top |
| TissGeneProg for RUNDC3A |
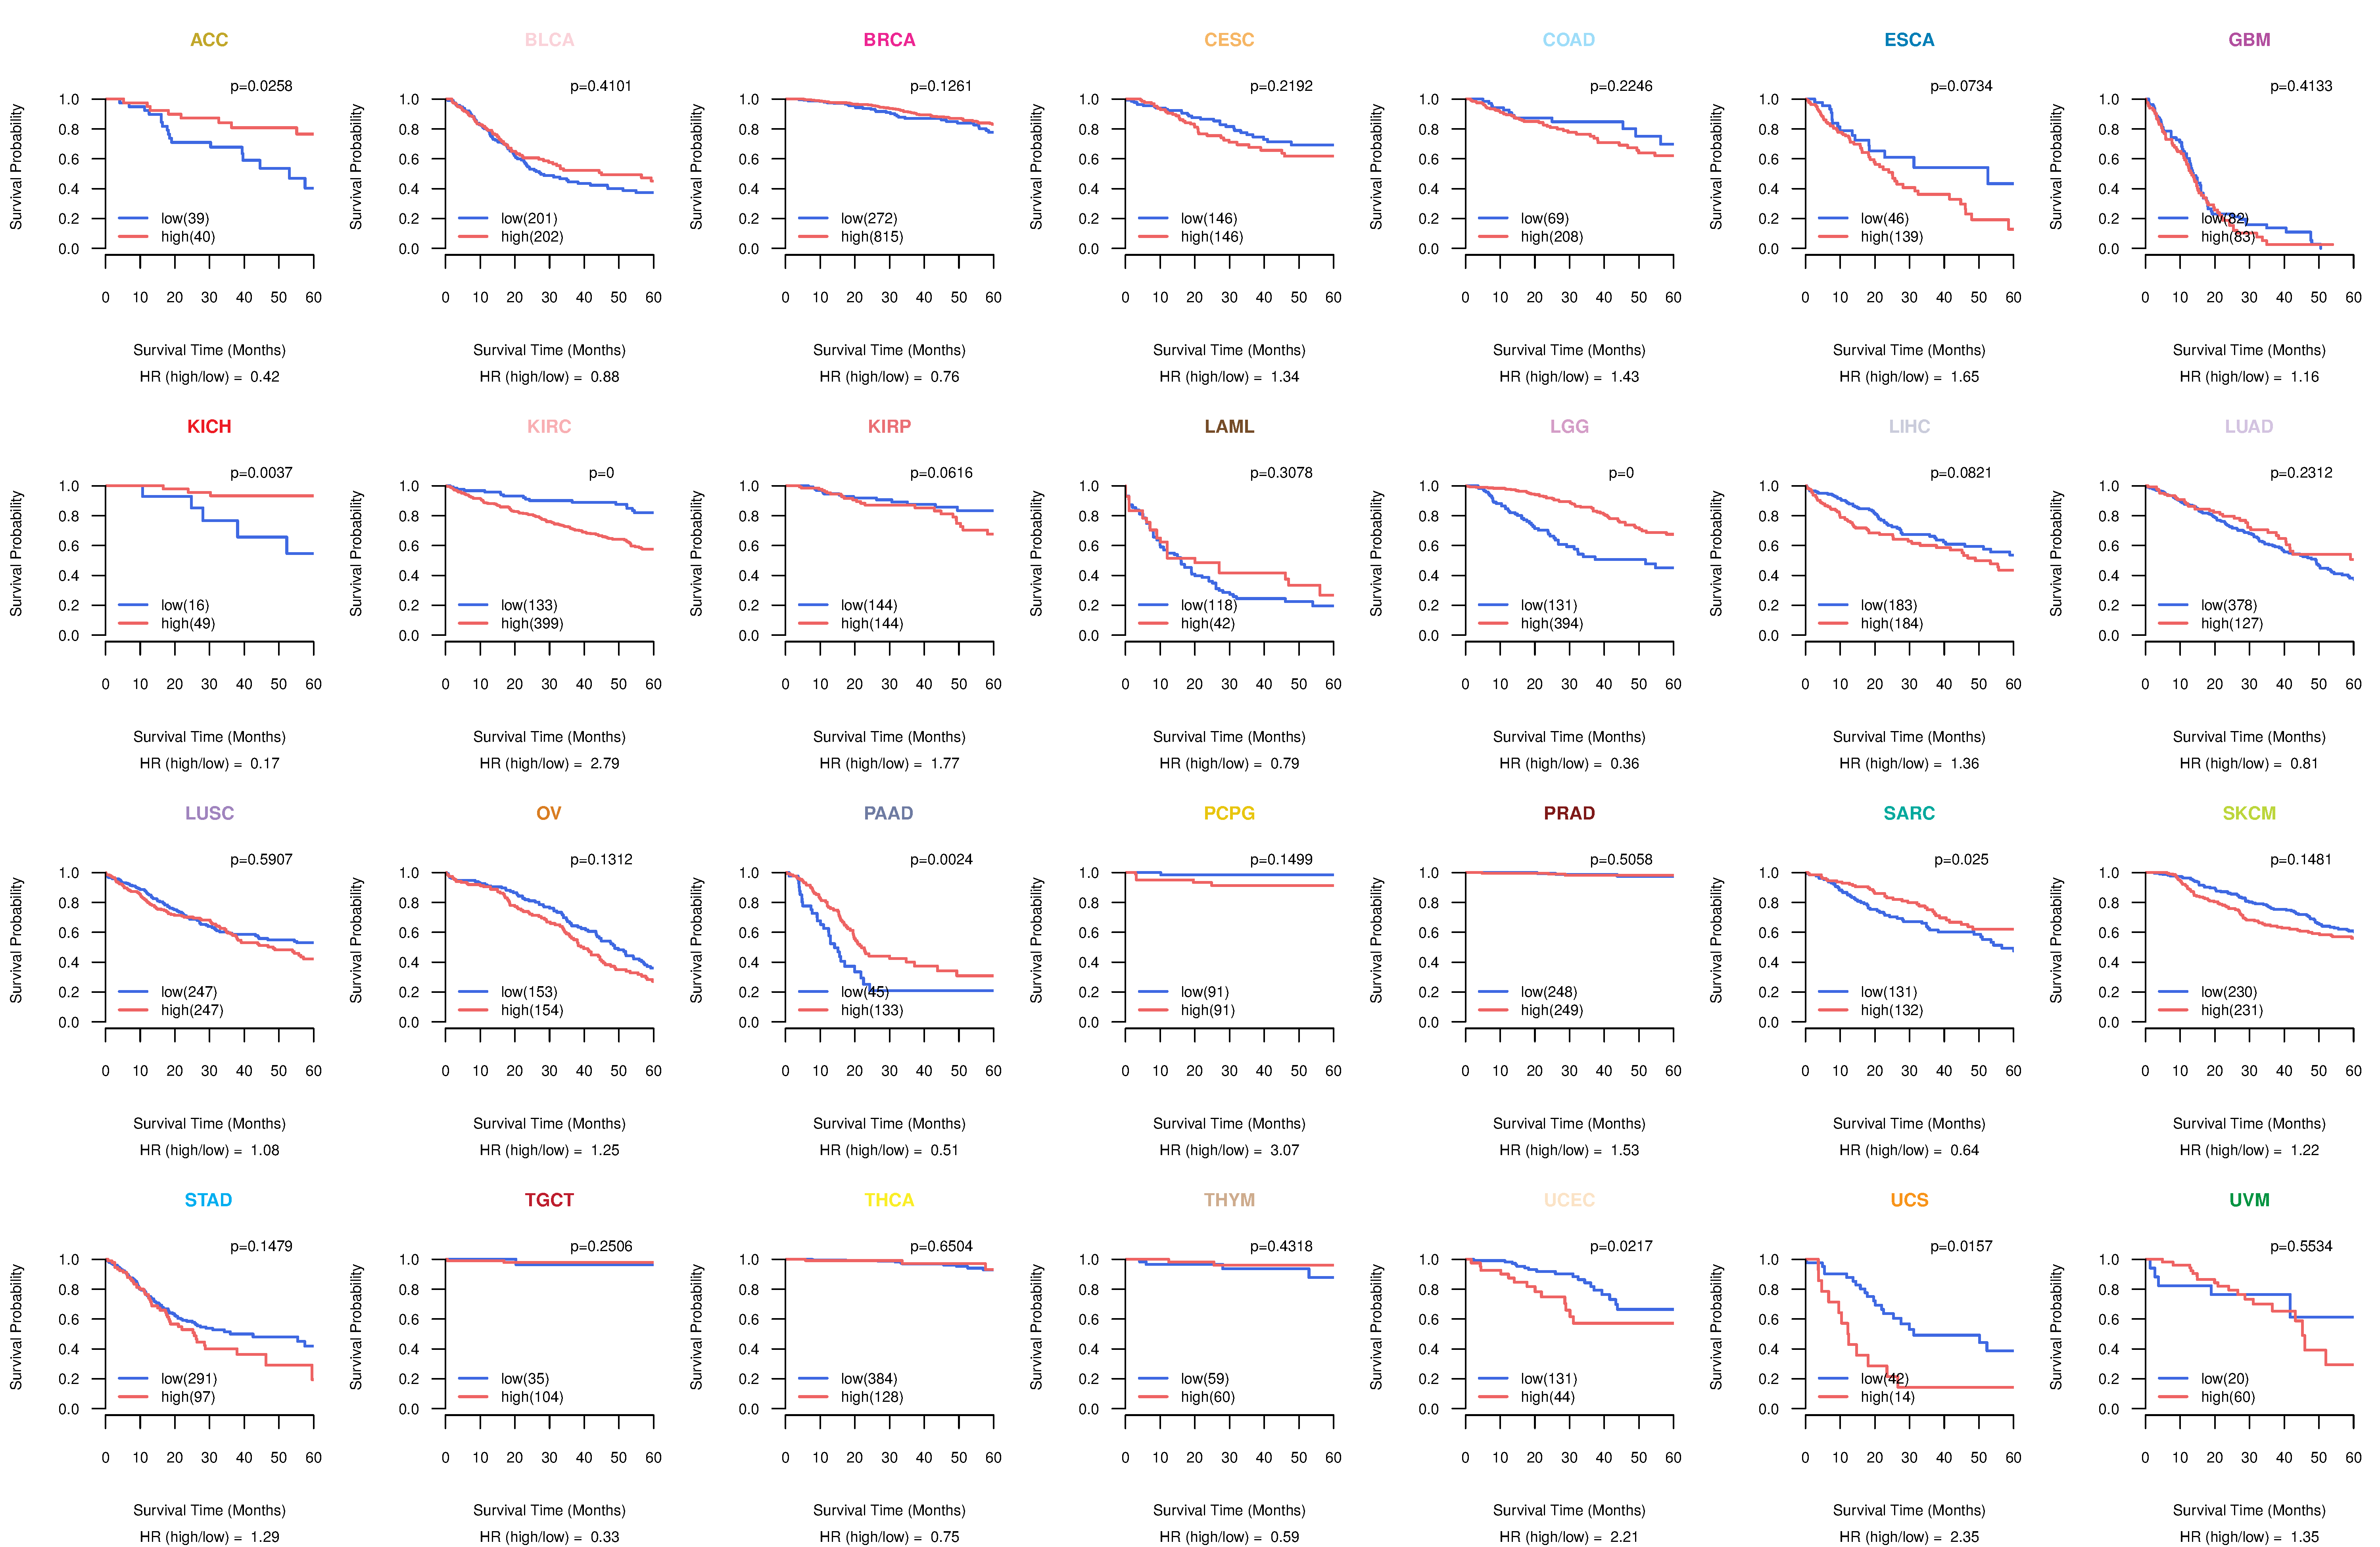
| Kaplan-Meier plots with logrank tests of overall survival (OS) using 28 cancer types (TCGA IlluminaHiSeq_RNASeqV2, pan-cancer normalized log2(norm_counts+1) data, version 2016-08-16) (TCGA clinicalMatrix, phenotype data, version 2016-04-27) * Click on the image to enlarge it in a new window. |
 |
| Kaplan-Meier plots with logrank test of relapse free survival (RFS) using 28 cancer types (TCGA IlluminaHiSeq_RNASeqV2, pan-cancer normalized log2(norm_counts+1) data, version 2016-08-16) (TCGA clinicalMatrix, phenotype data, version 2016-04-27) * Click on the image enlarge it in a new window. |
 |
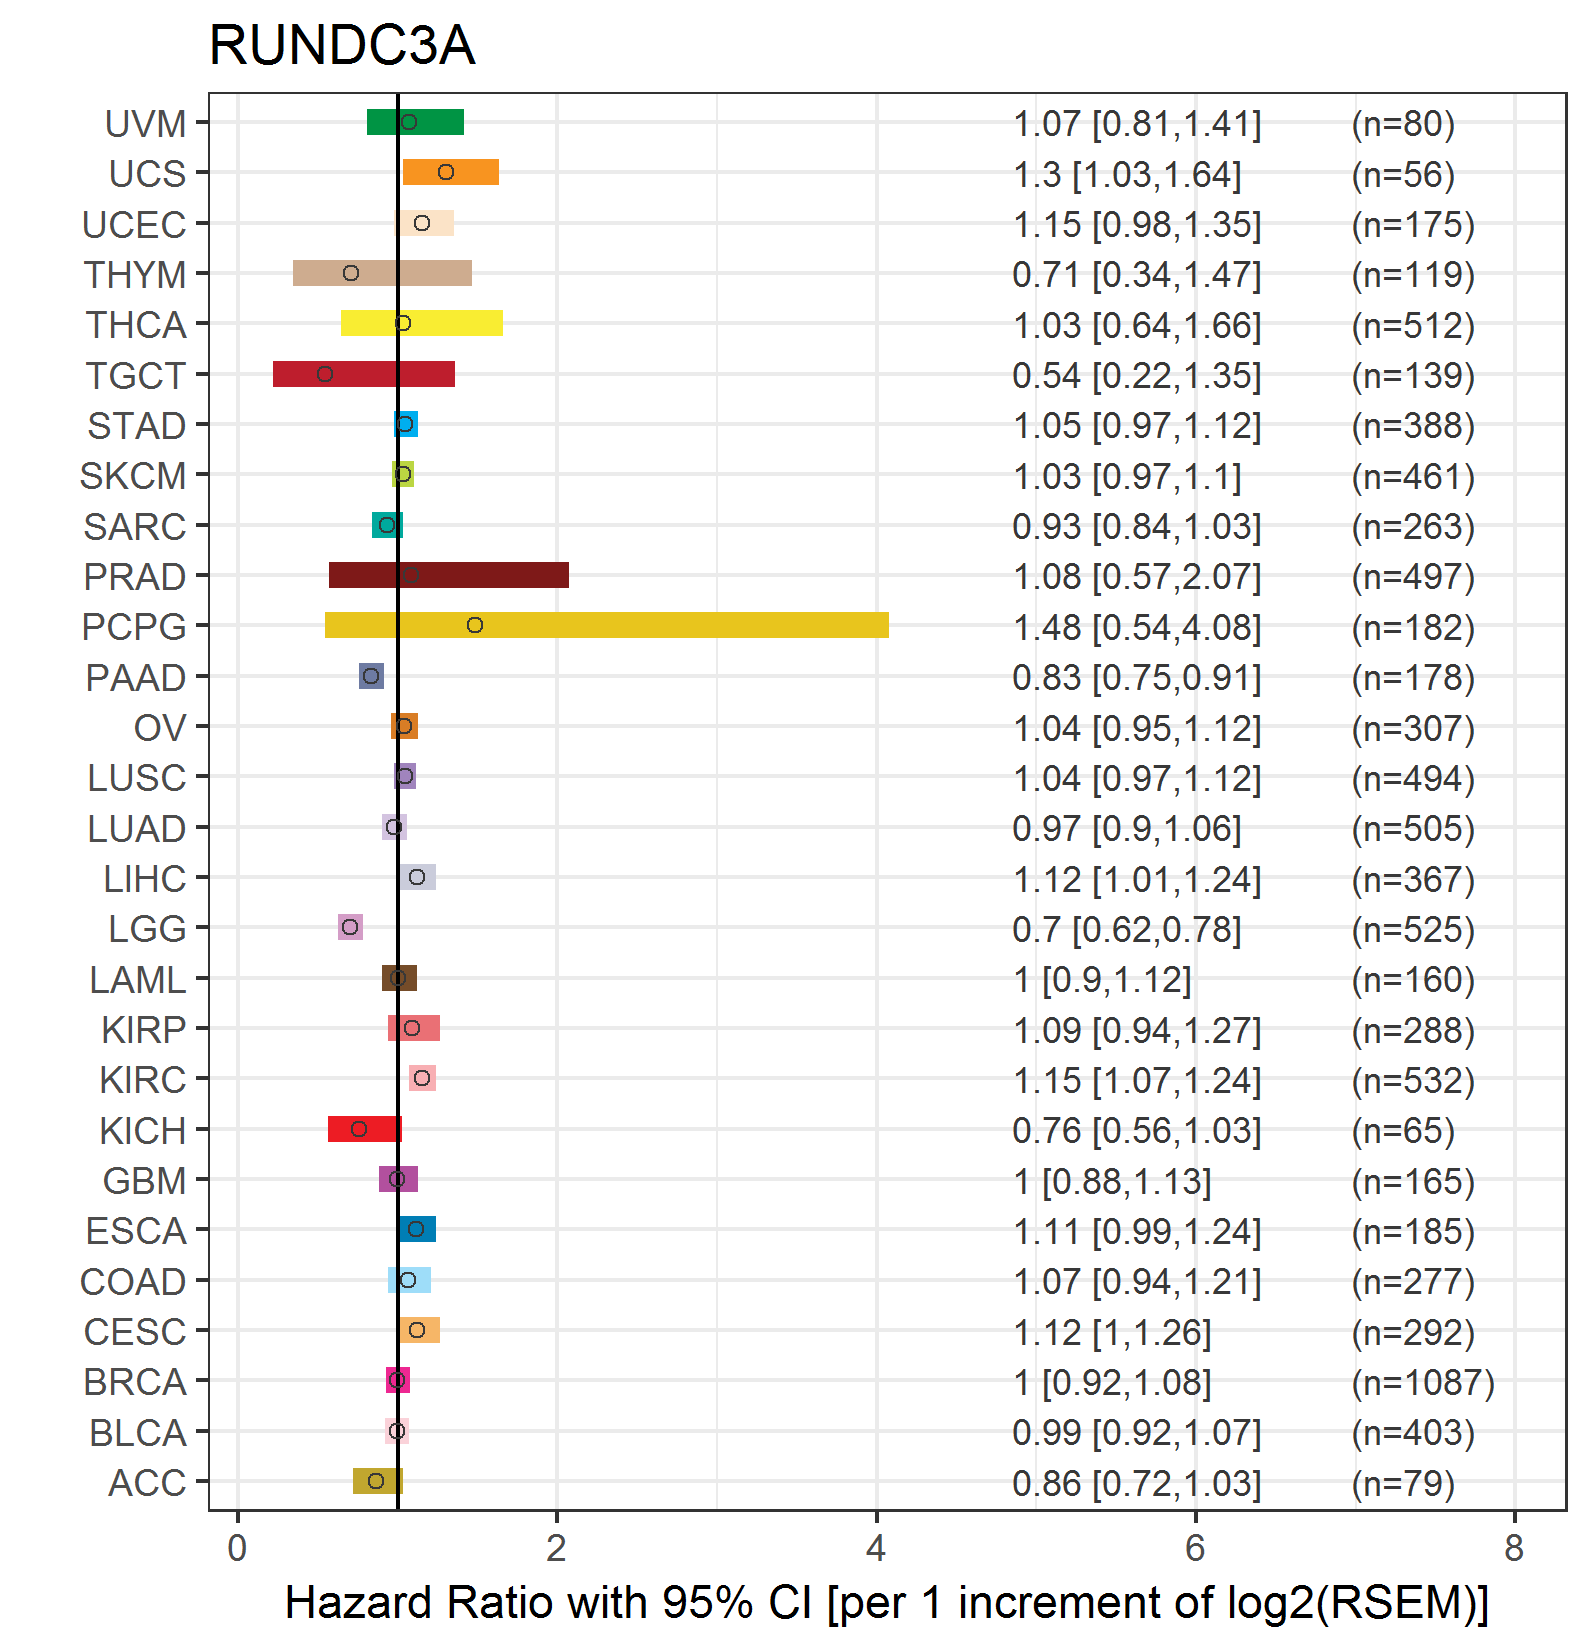
| Forest plot of Cox proportional hazard ratio (HR) and 95% CI of overall survival (OS) using 28 cancer types (TCGA IlluminaHiSeq_RNASeqV2, pan-cancer normalized log2(norm_counts+1) data, version 2016-08-16) (TCGA clinicalMatrix, phenotype data, version 2016-04-27) * Click on the image enlarge it in a new window. |
 |
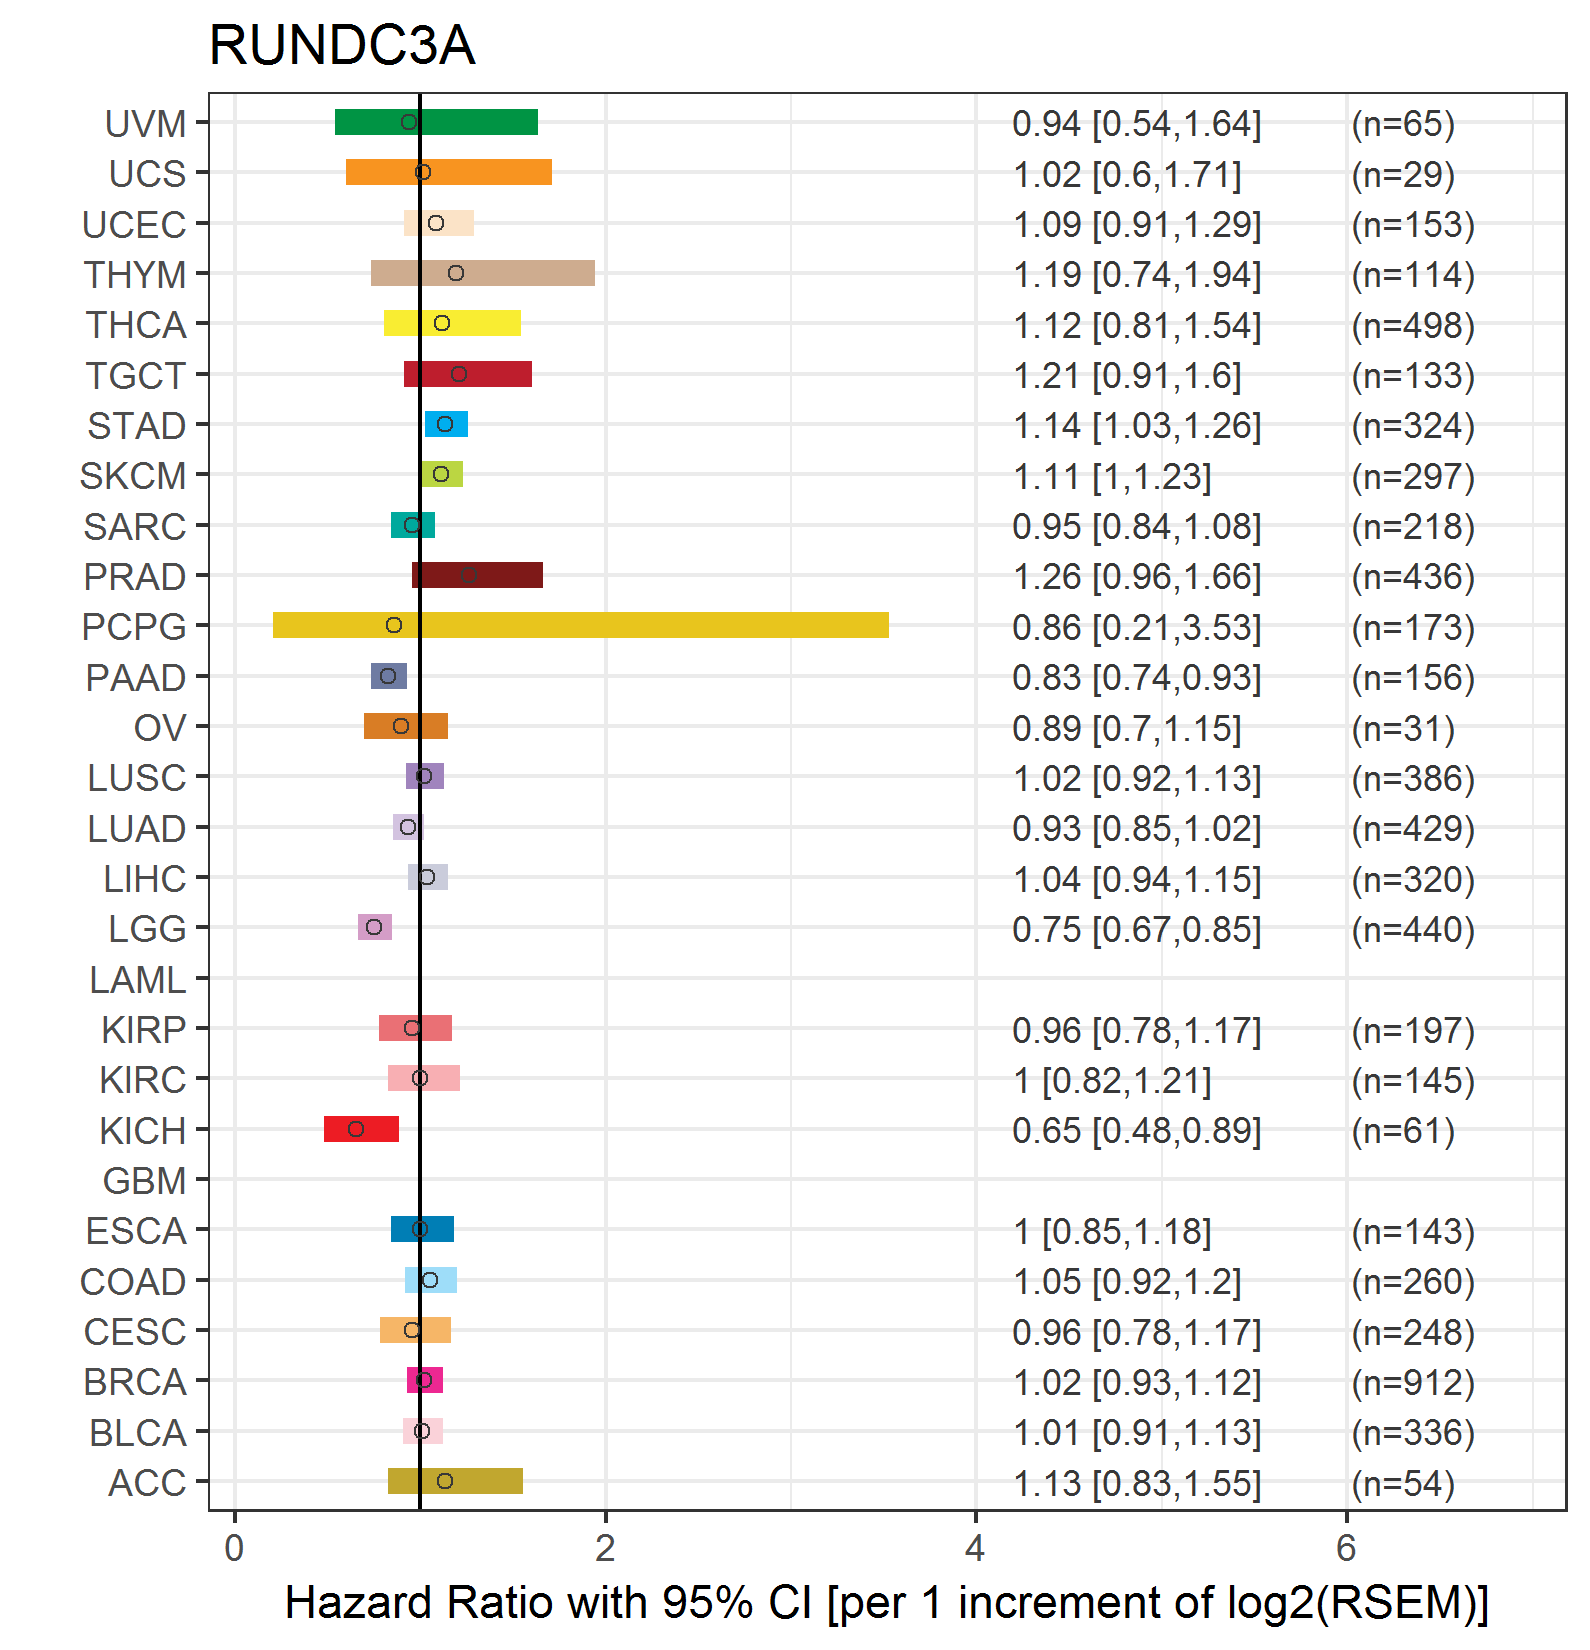
| Forest plot of Cox proportional hazard ratio (HR) and 95% CI of relapse free survival (RFS) using 28 cancer types (TCGA IlluminaHiSeq_RNASeqV2, pan-cancer normalized log2(norm_counts+1) data, version 2016-08-16) (TCGA clinicalMatrix, phenotype data, version 2016-04-27) * Click on the image enlarge it in a new window. |
 |
| Top |
| TissGeneClin for RUNDC3A |
| TissGeneDrug for RUNDC3A |
| Drug information targeting TissGene (DrugBank Version 5.0.6, 2017-04-01) |
| DrugBank ID | Drug name | Drug activity | Drug type | Drug status |
| Top |
| TissGeneDisease for RUNDC3A |
| Disease information associated with TissGene (DisGeNet, 2016-06-01) |
| Disease ID | Disease name | # pubmeds | Source |
|
Copyright 2016-Present - The University of Texas Health Science Center at Houston (UTHealth) Web File Viewing | How to Report, Fraud, Waste and Abuse | State of Texas | Statewide Search | Texas Homeland Security | Site Policies |