 |
| |
| |
| |
| |
| |
| |
|

| TissGeneSummary for ABHD2 |
 Gene summary Gene summary |
| Basic gene information | Gene symbol | ABHD2 |
| Gene name | abhydrolase domain containing 2 | |
| Synonyms | HS1-2|LABH2|PHPS1-2 | |
| Cytomap | UCSC genome browser: 15q26.1 | |
| Type of gene | protein-coding | |
| RefGenes | NM_007011.7, NM_152924.4, | |
| Description | abhydrolase domain-containing protein 2alpha/beta hydrolase domain containing protein 2lung alpha/beta hydrolase 2protein PHPS1-2 | |
| Modification date | 20141207 | |
| dbXrefs | MIM : 612196 | |
| HGNC : HGNC | ||
| Ensembl : ENSG00000140526 | ||
| HPRD : 09791 | ||
| Vega : OTTHUMG00000148684 | ||
| Protein | UniProt: go to UniProt's Cross Reference DB Table | |
| Expression | CleanEX: HS_ABHD2 | |
| BioGPS: 11057 | ||
| Pathway | NCI Pathway Interaction Database: ABHD2 | |
| KEGG: ABHD2 | ||
| REACTOME: ABHD2 | ||
| Pathway Commons: ABHD2 | ||
| Context | iHOP: ABHD2 | |
| ligand binding site mutation search in PubMed: ABHD2 | ||
| UCL Cancer Institute: ABHD2 | ||
| Assigned class in TissGDB* | C | |
| Included tissue-specific gene expression resources | TiGER,GTEx | |
| Specific-tissues in normal samples (assigned by TissGDB using HPA, TiGER, and GTEx) | Liver | |
| Cancer types related to the specific-tissues in cancer samples (assigned by TissGDB using TCGA) | LIHC | |
| Reference showing the relevant tissue of ABHD2 | ||
| Description by TissGene annotations | TissgsLTS | |
| * Class A consists of genes with literature evidence and is part of the cTissGenes. Class B consists of only cTissGenes without additional evidence. The remaining genes belong to Class C. |
| Gene ontology having evidence of Inferred from Direct Assay (IDA) from Entrez |
| GO ID | GO term | PubMed ID |
| Top |
| TissGeneExp for ABHD2 |
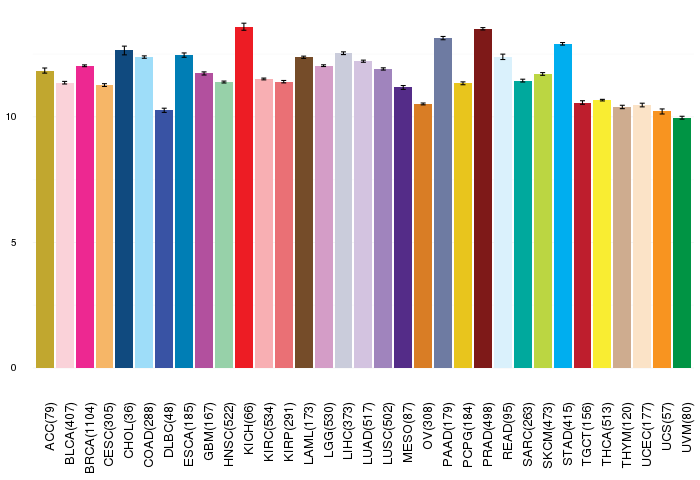
| Gene expressions across 28 cancer types (X-axis: cancer type and Y-axis: log2(norm_counts+1)) (TCGA IlluminaHiSeq_RNASeqV2, pan-cancer normalized log2(norm_counts+1) data, version 2016-08-16) |
 |
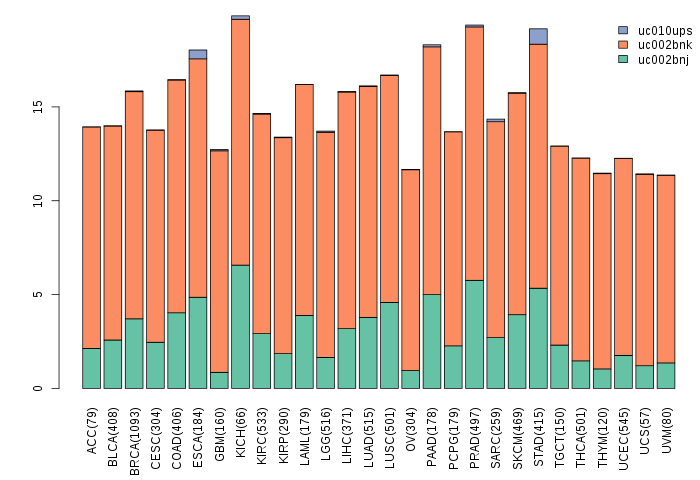
| Gene isoform expressions across 28 cancer types (X-axis: cancer type and Y-axis: log2(norm_counts+1)) (TCGA pan-cancer tcga_rsem_isoform_tpm, version 2016-09-01) |
 |
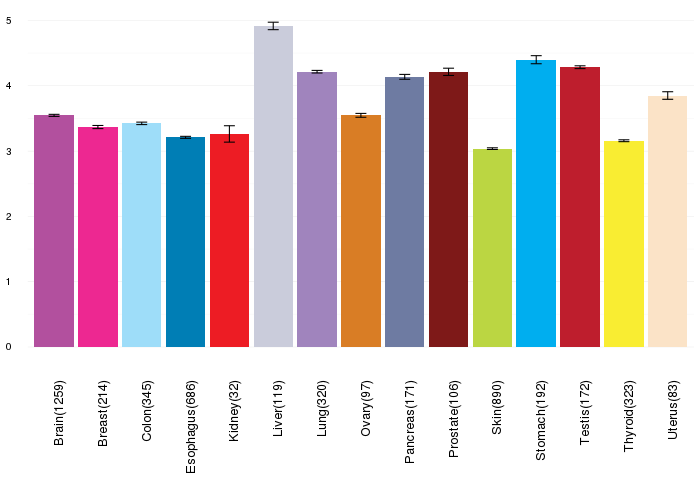
| Gene expressions across normal tissues of GTEx data (GTEx GTEx_Analysis_v6_RNA-seq_RNA-SeQCv1.1.8_gene_rpkm.gct) - Here, we shows the matched tissue types only among our 28 cancer types. |
 |
| Different expressions across 14 cancer types with more than 10 samples between matched tumors and normals (X-axis: cancer type and Y-axis: log2(norm_counts+1)) (TCGA IlluminaHiSeq_RNASeqV2, pan-cancer normalized log2(norm_counts+1) data, version 2016-08-16) |
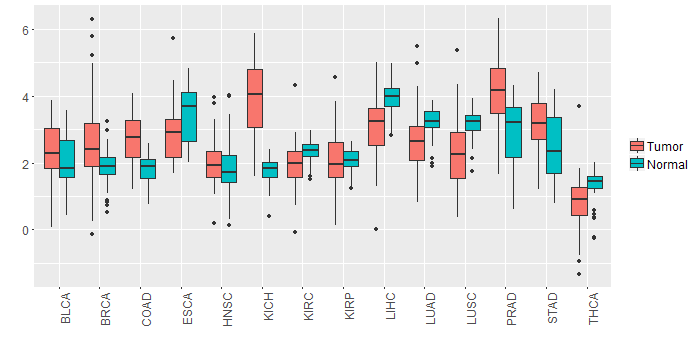 |
| - Significantly differentially expressed cancer types and information. (|Fold change|>1 and FDR<0.05) |
| Cancer type | Mean(exp) in tumor | Mean(exp) in matched normal | Log2FC | P-val. | FDR |
| KICH | 3.938751011 | 1.735123011 | 2.203628 | 4.35E-11 | 3.69E-10 |
| PRAD | 4.23218178 | 2.911320241 | 1.320861538 | 8.37E-10 | 1.35E-08 |
| Top |
| TissGene-miRNA for ABHD2 |
| Significantly anti-correlated miRNAs of TissGene across 28 cancer types (Gene-miRNA relations from TargetScanHuman Relsease 7.1, Conserved_Site_Context_Scores.txt.zip, 06.01.2016) (TCGA IlluminaHiSeq_miRNASeq, log2(RPM+1) data, version 2016-11-21) (TCGA IlluminaHiSeq_RNASeqV2, log2(normalized_count+1) data, version 2016-08-16) (Spearman’s Rank Correlation (p-value<0.05 and coefficient<-0.25)) |
| Cancer type | miRNA id | miRNA accession | P-val. | Coeff. | # samples |
| LUAD | hsa-miR-155-5p | MIMAT0000646 | 0.044 | -0.26 | 60 |
| Top |
| TissGeneMut for ABHD2 |
| TissGeneSNV for ABHD2 |
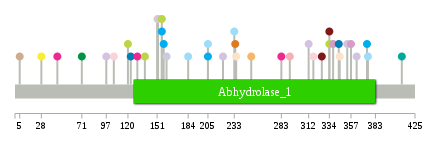
| nsSNV counts per each loci. Different colors of circles represent different cancer types. Circle size denotes number of samples. (TCGA somatic mutation (SNPs and small INDELs) data, version 2016-04-25) * Click on the image to enlarge it in a new window. |
 |
 |
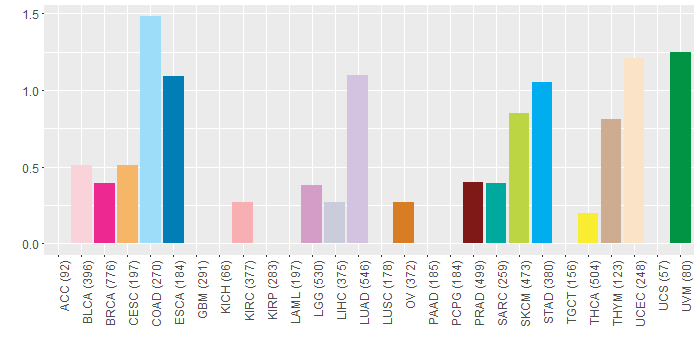
| Somatic nucleotide variants of TissGene across 28 cancer types (X-axis: cancer type and Y-axis: % of mutated samples) The numbers in parentheses are numbers of samples with mutation (nsSNVs). (TCGA somatic mutation (SNPs and small INDELs) data, version 2016-04-25) |
 |
| - nsSNVs sorted by frequency. |
| AAchange | Cancer type | # samples |
| p.D112N | READ | 2 |
| p.V28M | THCA | 1 |
| p.E184G | COAD | 1 |
| p.I130N | BRCA | 1 |
| p.S138N | SKCM | 1 |
| p.S292R | KIRC | 1 |
| p.Q151H | UCEC | 1 |
| p.N161D | LIHC | 1 |
| p.Q251E | CESC | 1 |
| p.L5M | THYM | 1 |
| p.K411N | SARC | 1 |
| p.R156W | STAD | 1 |
| p.H120L | SKCM | 1 |
| p.K74E | DLBC | 1 |
| p.Y334S | SKCM | 1 |
| p.H97Y | LUAD | 1 |
| p.L353V | LUAD | 1 |
| p.H312Y | LUAD | 1 |
| p.G205D | COAD | 1 |
| p.P283L | BRCA | 1 |
| p.K152R | LUAD | 1 |
| p.G123X | ESCA | 1 |
| p.Q221K | LUAD | 1 |
| p.L317V | BLCA | 1 |
| p.R363L | LUAD | 1 |
| p.K193N | HNSC | 1 |
| p.K357E | LGG | 1 |
| p.V233M | COAD | 1 |
| p.I71V | UVM | 1 |
| p.D345Y | UCEC | 1 |
| p.V30I | READ | 1 |
| p.D344Y | ESCA | 1 |
| p.Y45C | BRCA | 1 |
| p.D105H | BLCA | 1 |
| p.C326Y | PRAD | 1 |
| p.Q235H | UCEC | 1 |
| p.C234S | OV | 1 |
| p.M338I | LGG | 1 |
| p.Y334C | PRAD | 1 |
| p.G375R | COAD | 1 |
| p.M367L | DLBC | 1 |
| p.A158T | STAD | 1 |
| p.G374V | STAD | 1 |
| p.R156W | SKCM | 1 |
| p.G205C | STAD | 1 |
| Top |
| TissGeneCNV for ABHD2 |
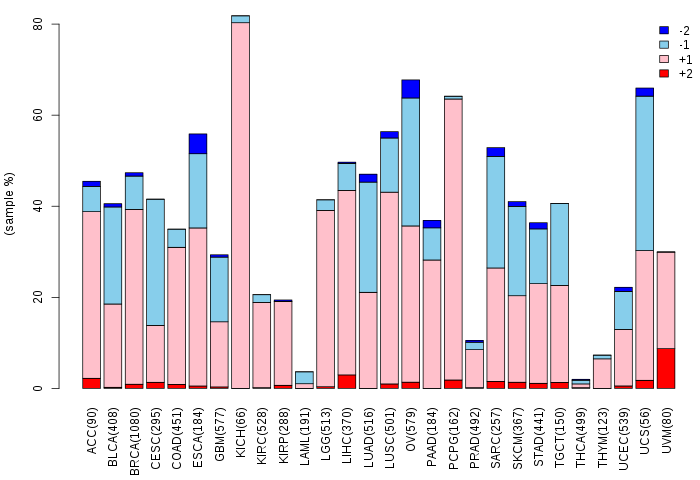
| Copy number variations of TissGene across 28 cancer types (X-axis: cancer type and Y-axis: % of CNV samples) (TCGA Gistic2_CopyNumber_Gistic2_all_data_by_genes, Gistic2 copy number data, version 2016-08-16) |
 |
| Top |
| TissGeneFusions for ABHD2 |
| Fusion genes including TissGene (ChimerDB 3.0, 2016-12-01 and TCGA fusion Portal 2015-12-01) |
| Database | Src | Cancer type | Sample | Fusion gene | ORF | 5'-gene BP | 3'-gene BP |
| Chimerdb3.0 | ChiTaRs | NA | DB209231 | ABHD2-NFX1 | chr15:89631796 | chr9:33301258 | |
| Chimerdb3.0 | ChiTaRs | NA | BQ027678 | ABHD2-ABHD2 | chr15:89744320 | chr15:89743770 | |
| Chimerdb3.0 | ChiTaRs | NA | AW853202 | ABHD2-ABHD2 | chr15:89635873 | chr15:89639156 | |
| Chimerdb3.0 | ChiTaRs | NA | AI380042 | MTA1-ABHD2 | chr14:105936963 | chr15:89740471 | |
| Chimerdb3.0 | ChiTaRs | NA | DA875914 | KIF16B-ABHD2 | chr20:16458841 | chr15:89743704 | |
| Chimerdb3.0 | ChiTaRs | NA | AW853203 | ABHD2-ABHD2 | chr15:89635872 | chr15:89639156 | |
| Chimerdb3.0 | TopHat-Fusion | BRCA | TCGA-AN-A0FD-01A | ABHD2-VAPA | 3'UTR-CDS | chr15:89744637 | chr18:9950481 |
| TCGAfusionPortal | PRADA | BLCA | TCGA-GV-A3QI-01A | ABHD2-BIRC6 | 3UTR-CDS | Chr15:89745591 | Chr2:32820101 |
| Top |
| TissGeneNet for ABHD2 |
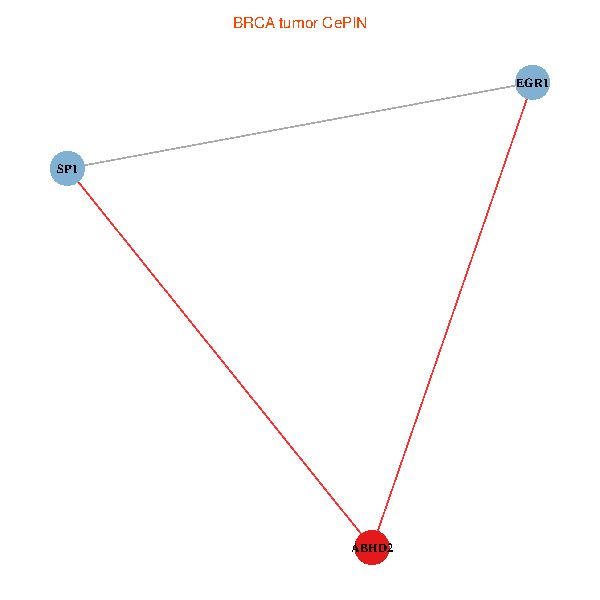
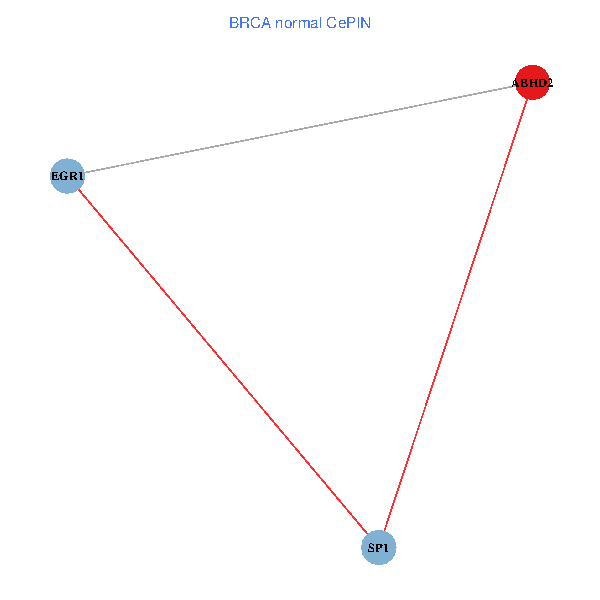
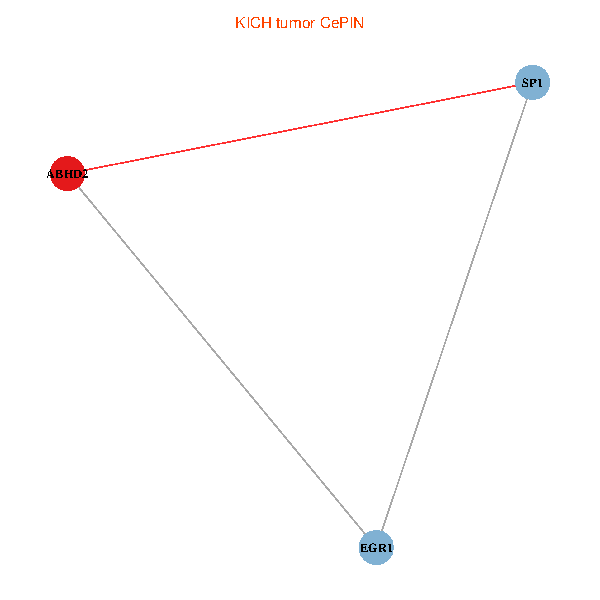
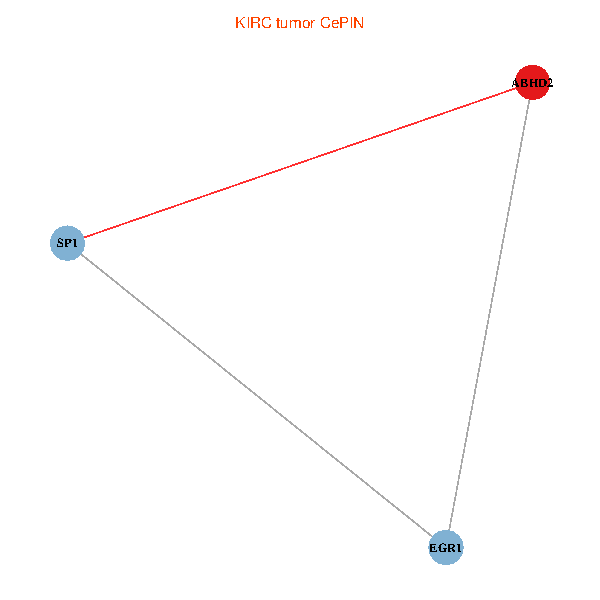
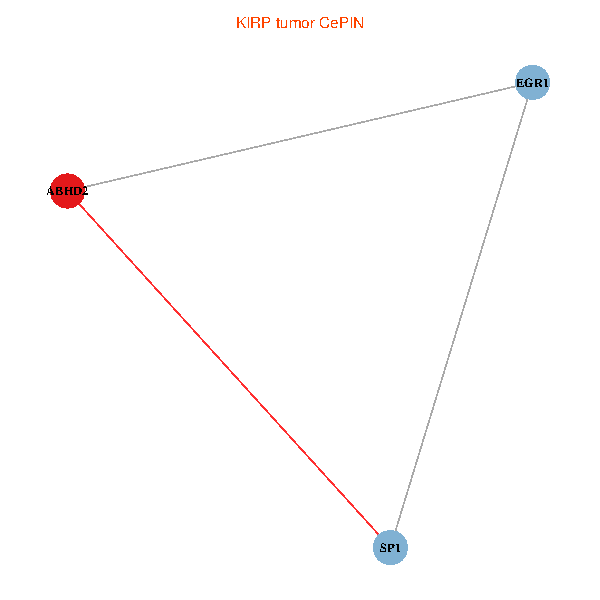
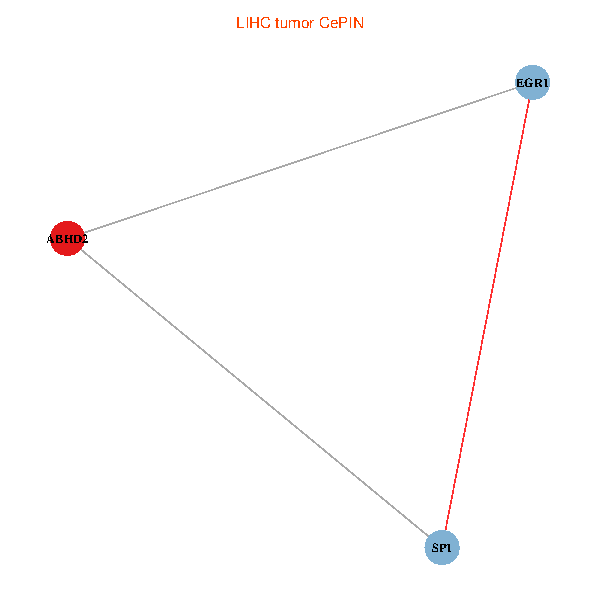
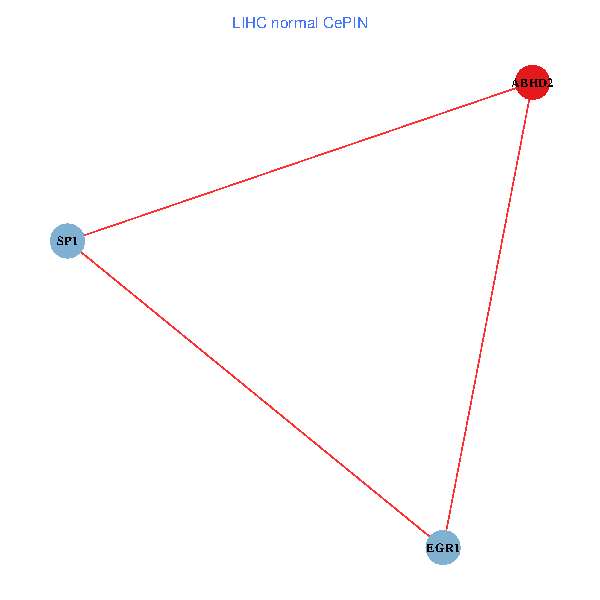
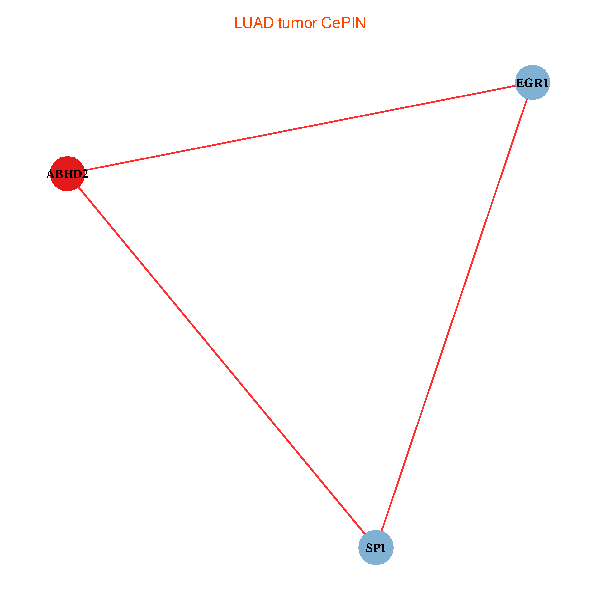
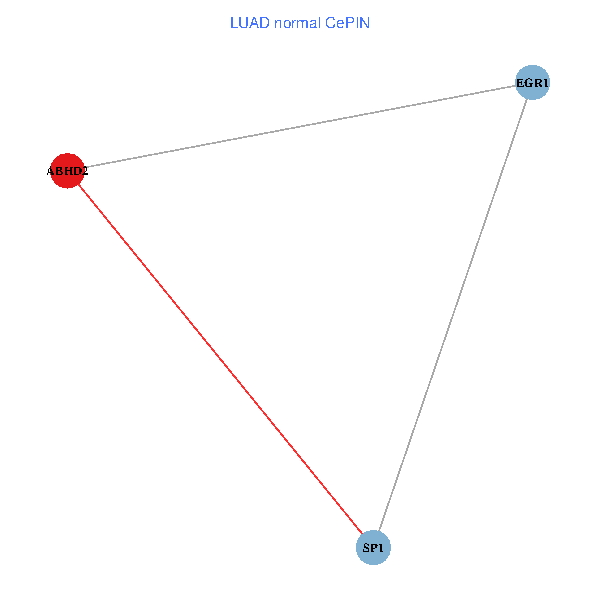
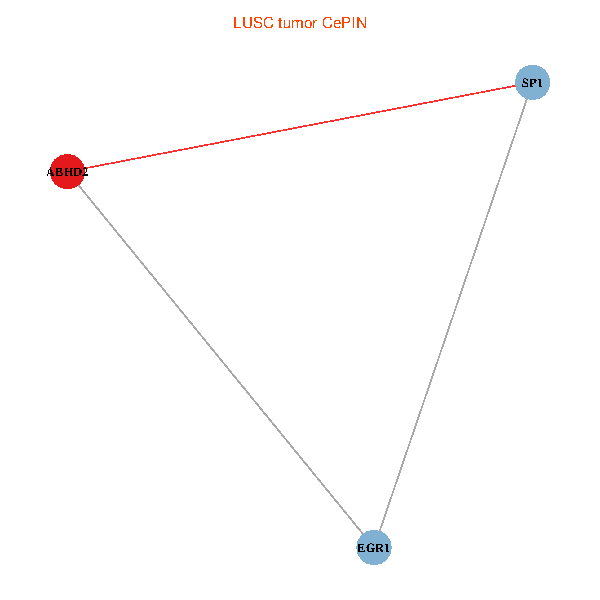
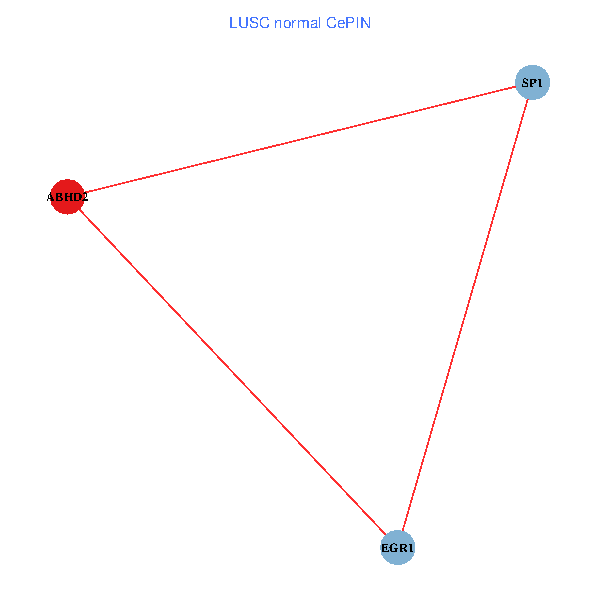
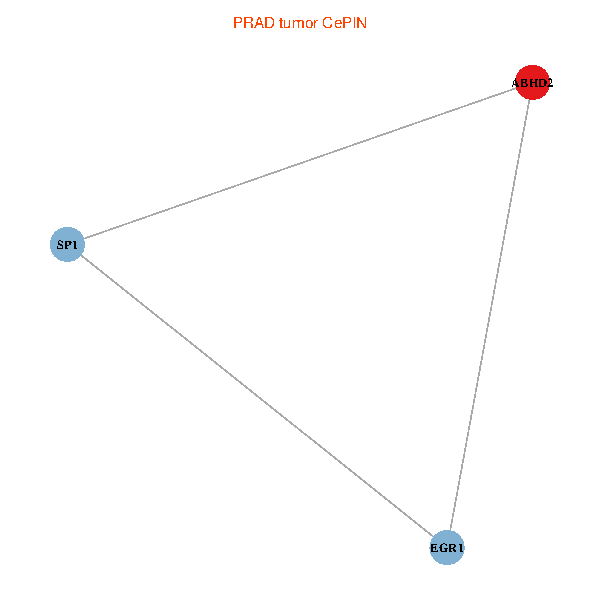
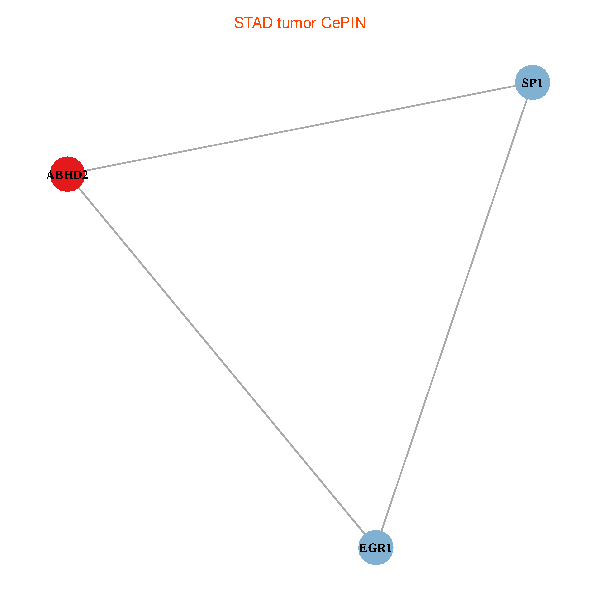
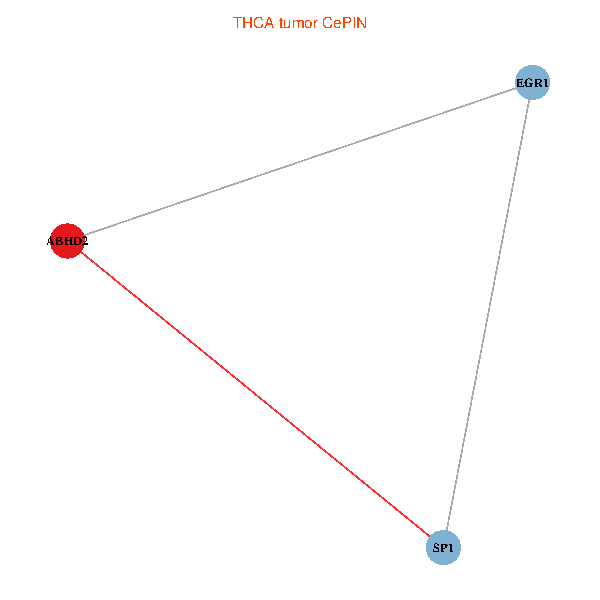
| Co-expressed gene networks based on protein-protein interaction data (CePIN) (TCGA IlluminaHiSeq_RNASeqV2, pan-cancer normalized log2(norm_counts+1) data, version 2016-08-16) (PINA2 ppi data) |
| BRCA (tumor) | BRCA (normal) |
| ABHD2, SP1, EGR1 (tumor) | ABHD2, SP1, EGR1 (normal) |
 |  |
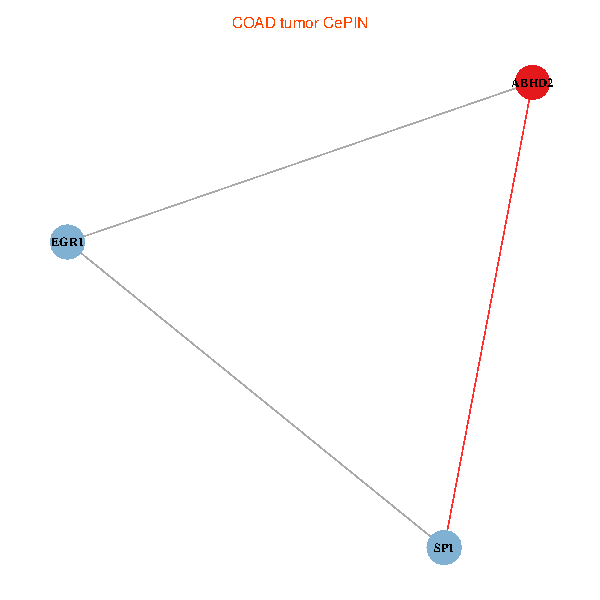
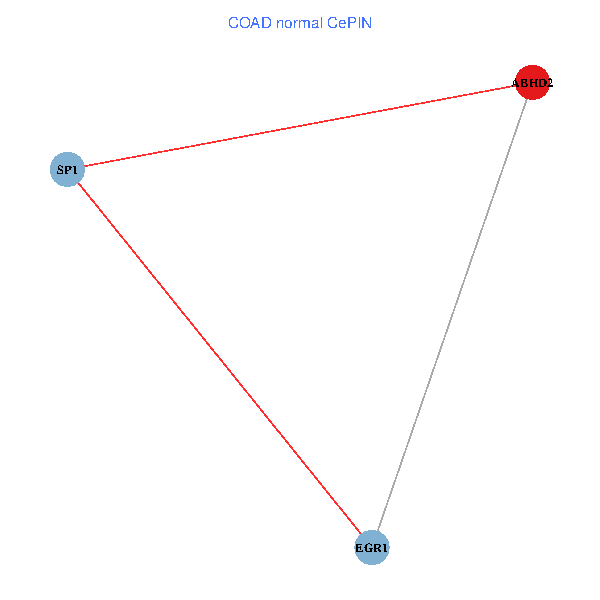
| COAD (tumor) | COAD (normal) |
| ABHD2, SP1, EGR1 (tumor) | ABHD2, SP1, EGR1 (normal) |
 |  |
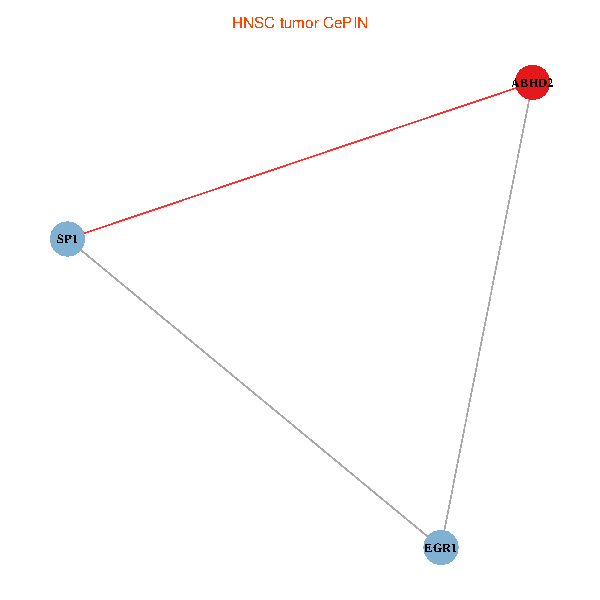
| HNSC (tumor) | HNSC (normal) |
| ABHD2, SP1, EGR1 (tumor) | ABHD2, SP1, EGR1 (normal) |
 |  |
| KICH (tumor) | KICH (normal) |
| ABHD2, SP1, EGR1 (tumor) | ABHD2, SP1, EGR1 (normal) |
 |  |
| KIRC (tumor) | KIRC (normal) |
| ABHD2, SP1, EGR1 (tumor) | ABHD2, SP1, EGR1 (normal) |
 |  |
| KIRP (tumor) | KIRP (normal) |
| ABHD2, SP1, EGR1 (tumor) | ABHD2, SP1, EGR1 (normal) |
 |  |
| LIHC (tumor) | LIHC (normal) |
| ABHD2, SP1, EGR1 (tumor) | ABHD2, SP1, EGR1 (normal) |
 |  |
| LUAD (tumor) | LUAD (normal) |
| ABHD2, SP1, EGR1 (tumor) | ABHD2, SP1, EGR1 (normal) |
 |  |
| LUSC (tumor) | LUSC (normal) |
| ABHD2, SP1, EGR1 (tumor) | ABHD2, SP1, EGR1 (normal) |
 |  |
| PRAD (tumor) | PRAD (normal) |
| ABHD2, SP1, EGR1 (tumor) | ABHD2, SP1, EGR1 (normal) |
 |  |
| STAD (tumor) | STAD (normal) |
| ABHD2, SP1, EGR1 (tumor) | ABHD2, SP1, EGR1 (normal) |
 |  |
| THCA (tumor) | THCA (normal) |
| ABHD2, SP1, EGR1 (tumor) | ABHD2, SP1, EGR1 (normal) |
 |  |
| Top |
| TissGeneProg for ABHD2 |
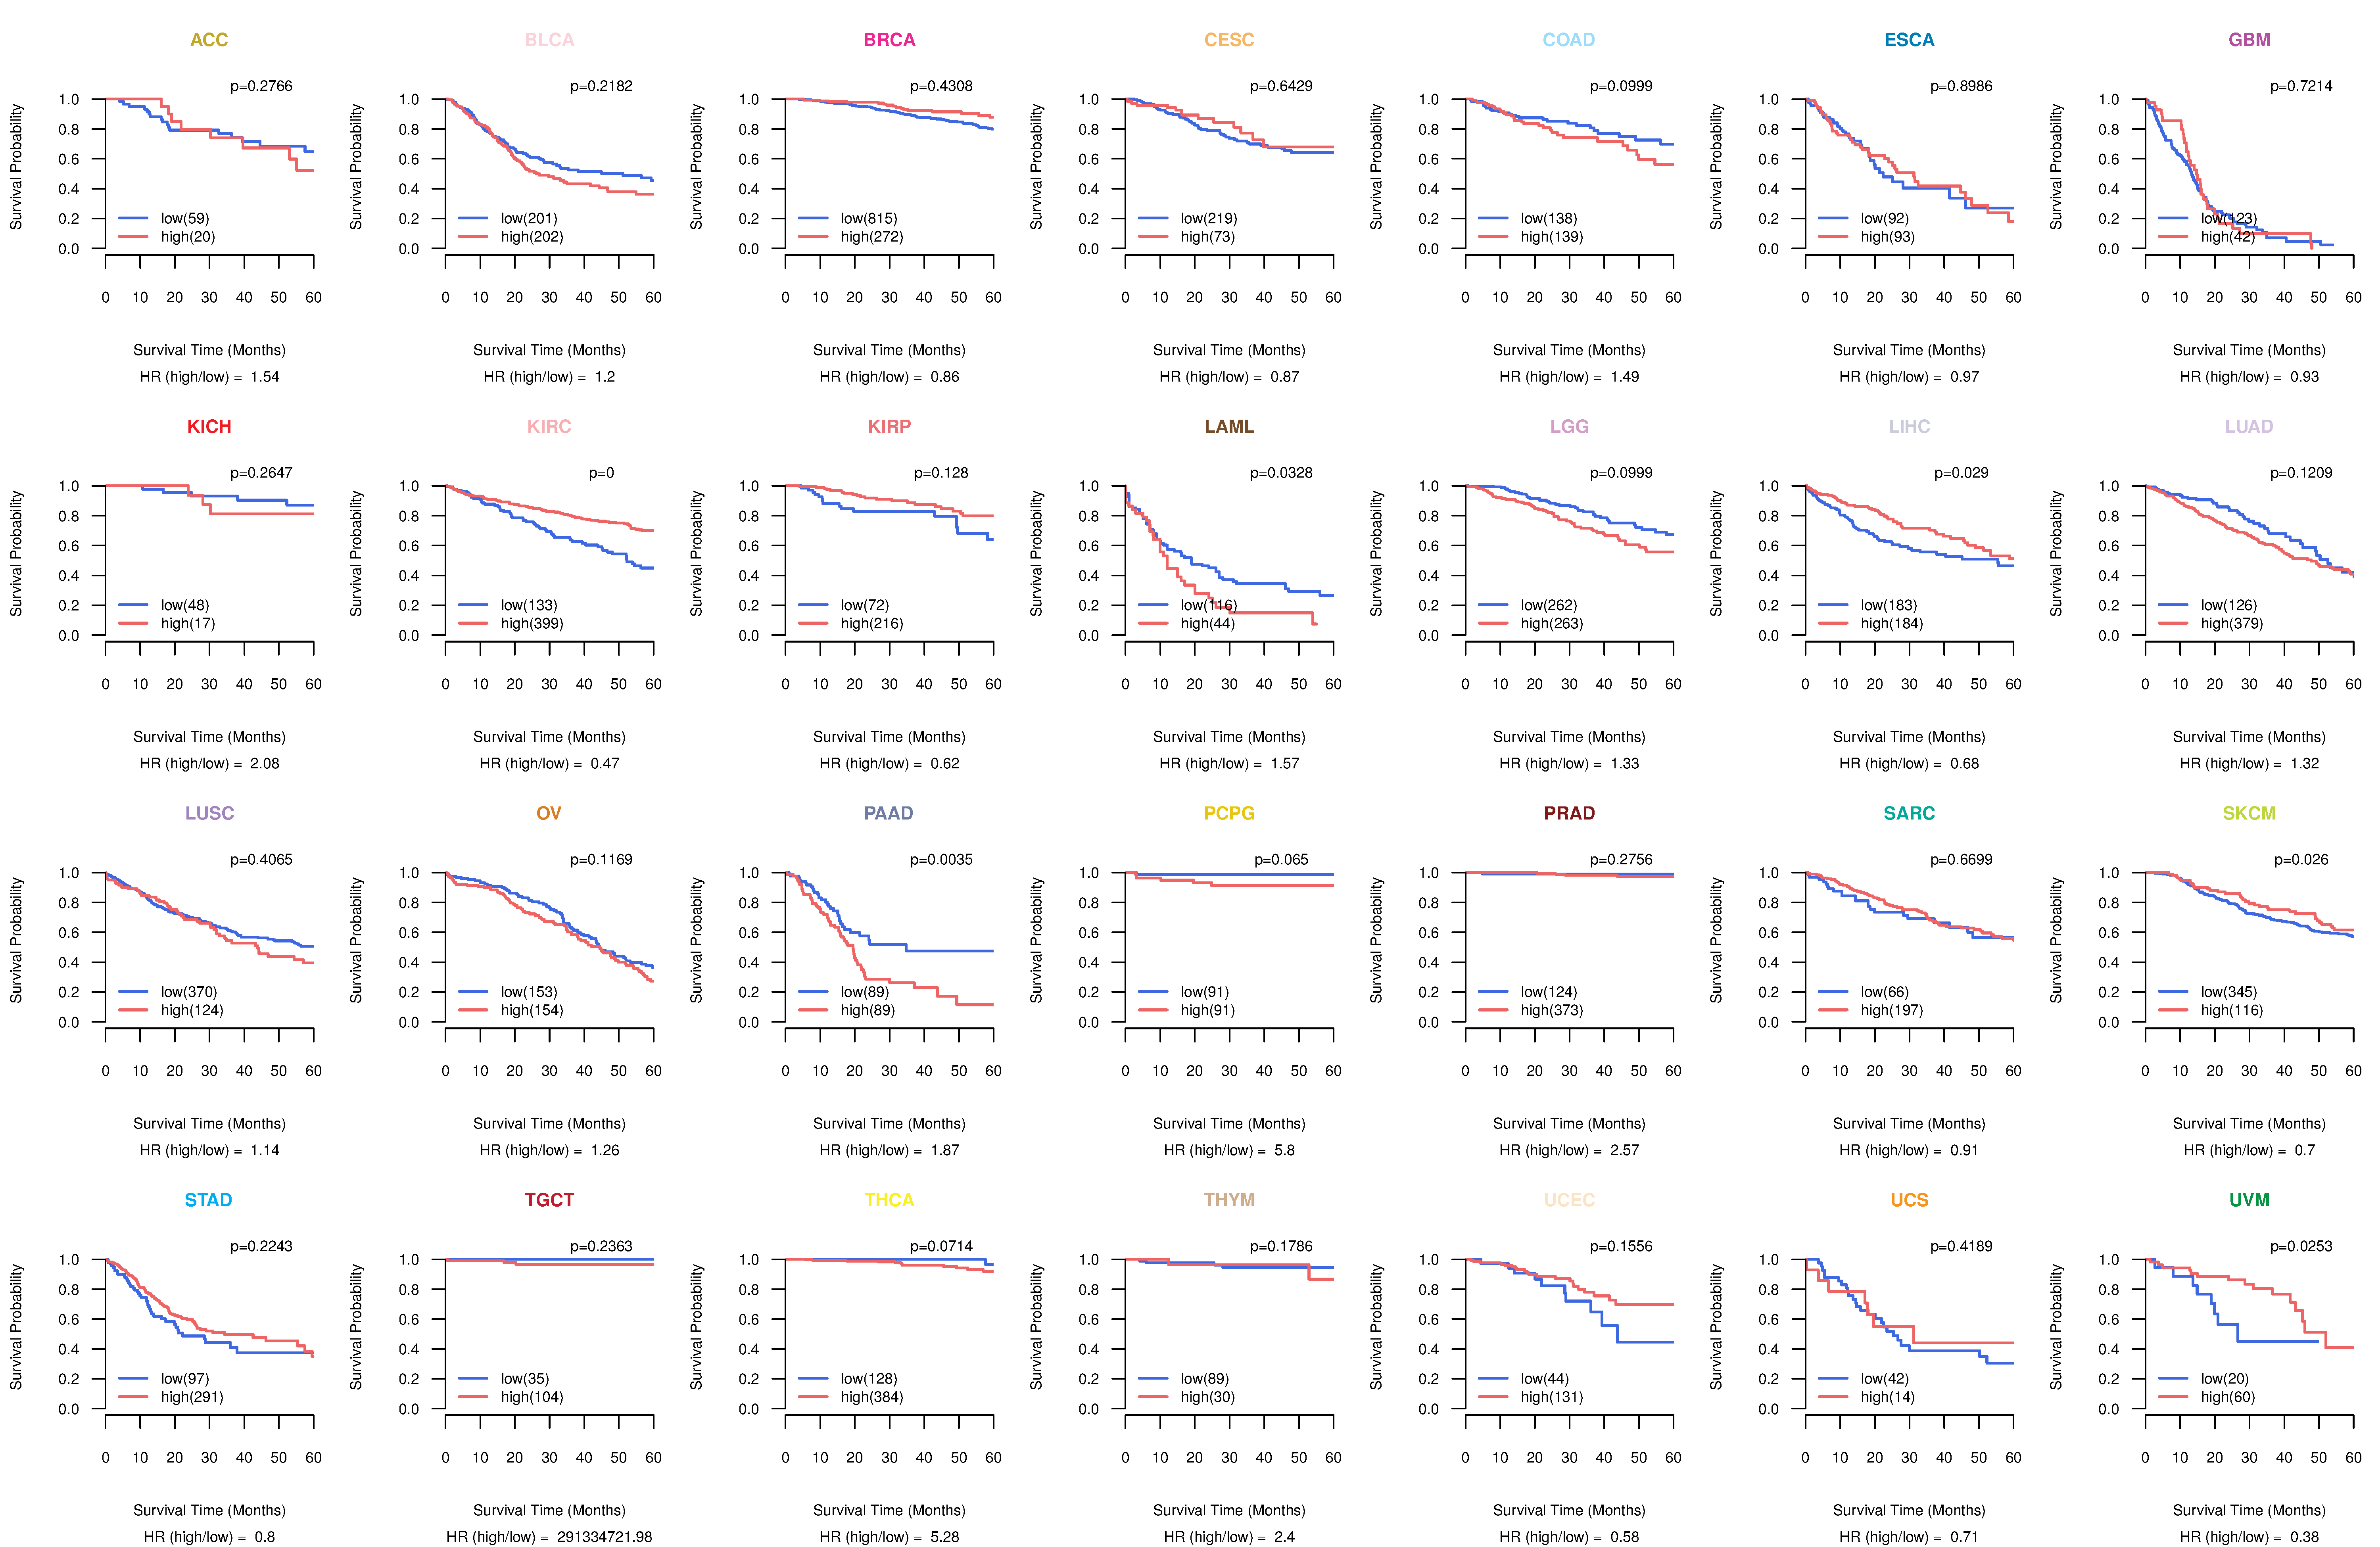
| Kaplan-Meier plots with logrank tests of overall survival (OS) using 28 cancer types (TCGA IlluminaHiSeq_RNASeqV2, pan-cancer normalized log2(norm_counts+1) data, version 2016-08-16) (TCGA clinicalMatrix, phenotype data, version 2016-04-27) * Click on the image to enlarge it in a new window. |
 |
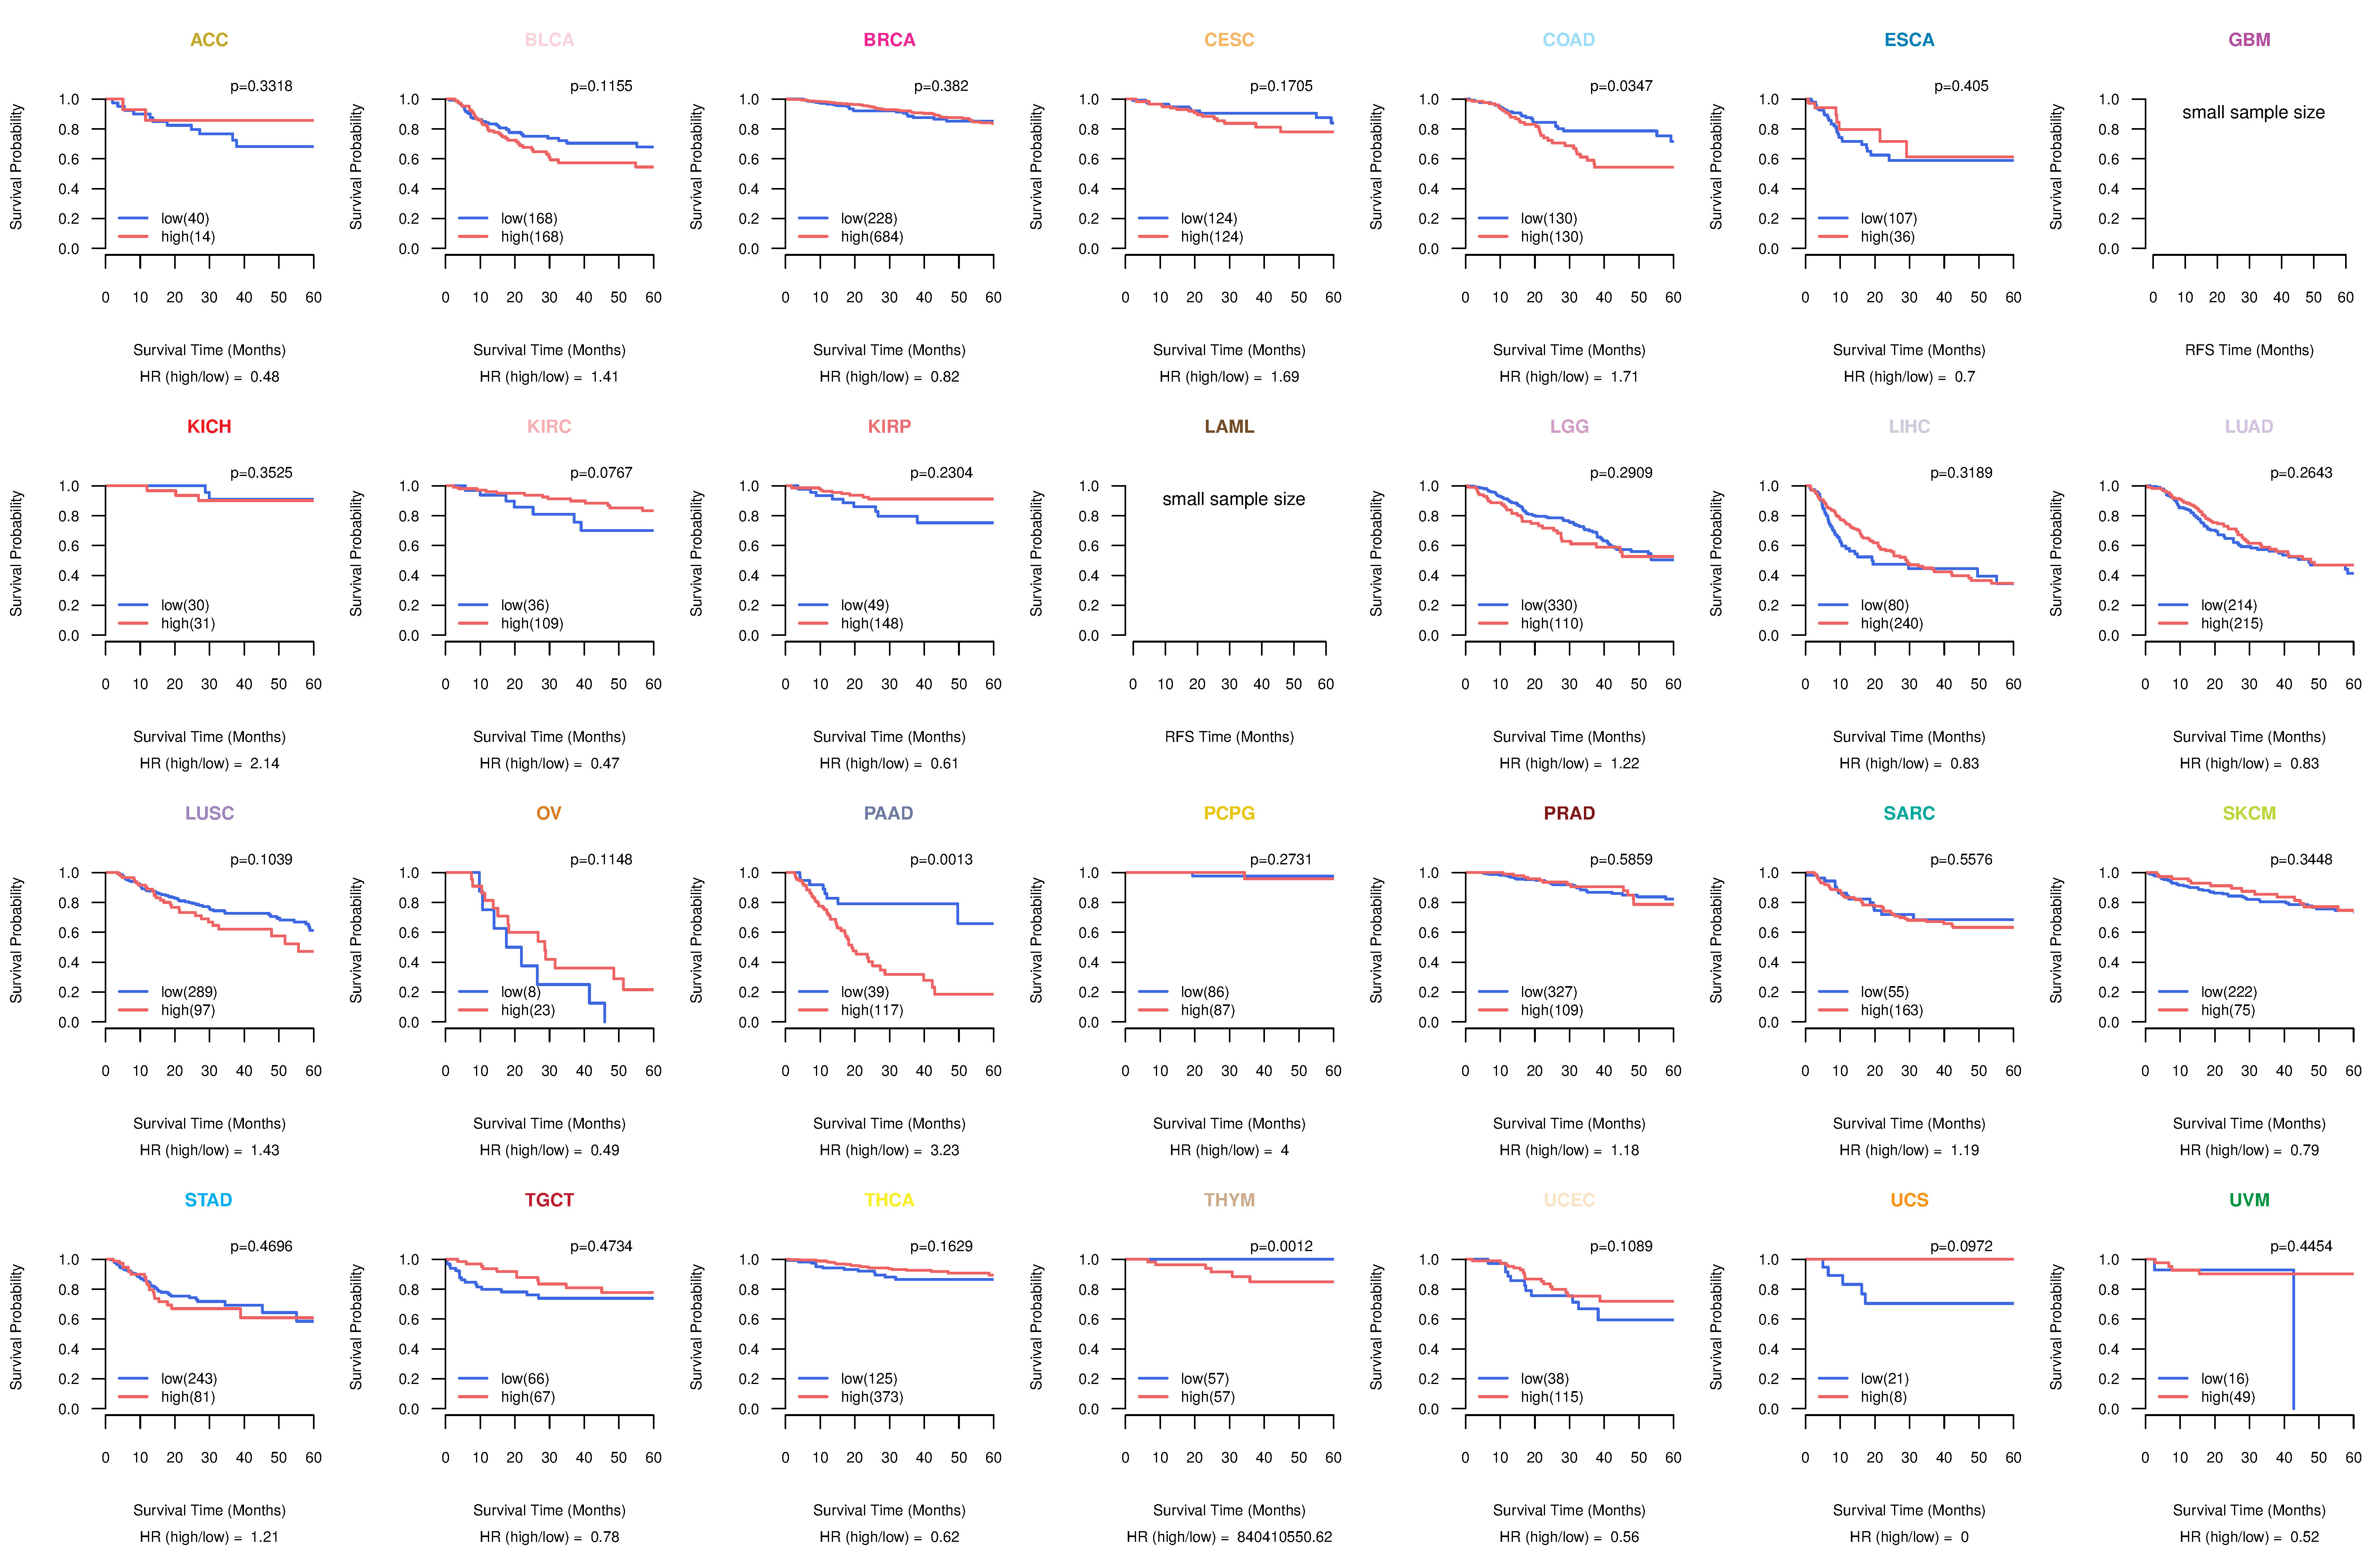
| Kaplan-Meier plots with logrank test of relapse free survival (RFS) using 28 cancer types (TCGA IlluminaHiSeq_RNASeqV2, pan-cancer normalized log2(norm_counts+1) data, version 2016-08-16) (TCGA clinicalMatrix, phenotype data, version 2016-04-27) * Click on the image enlarge it in a new window. |
 |
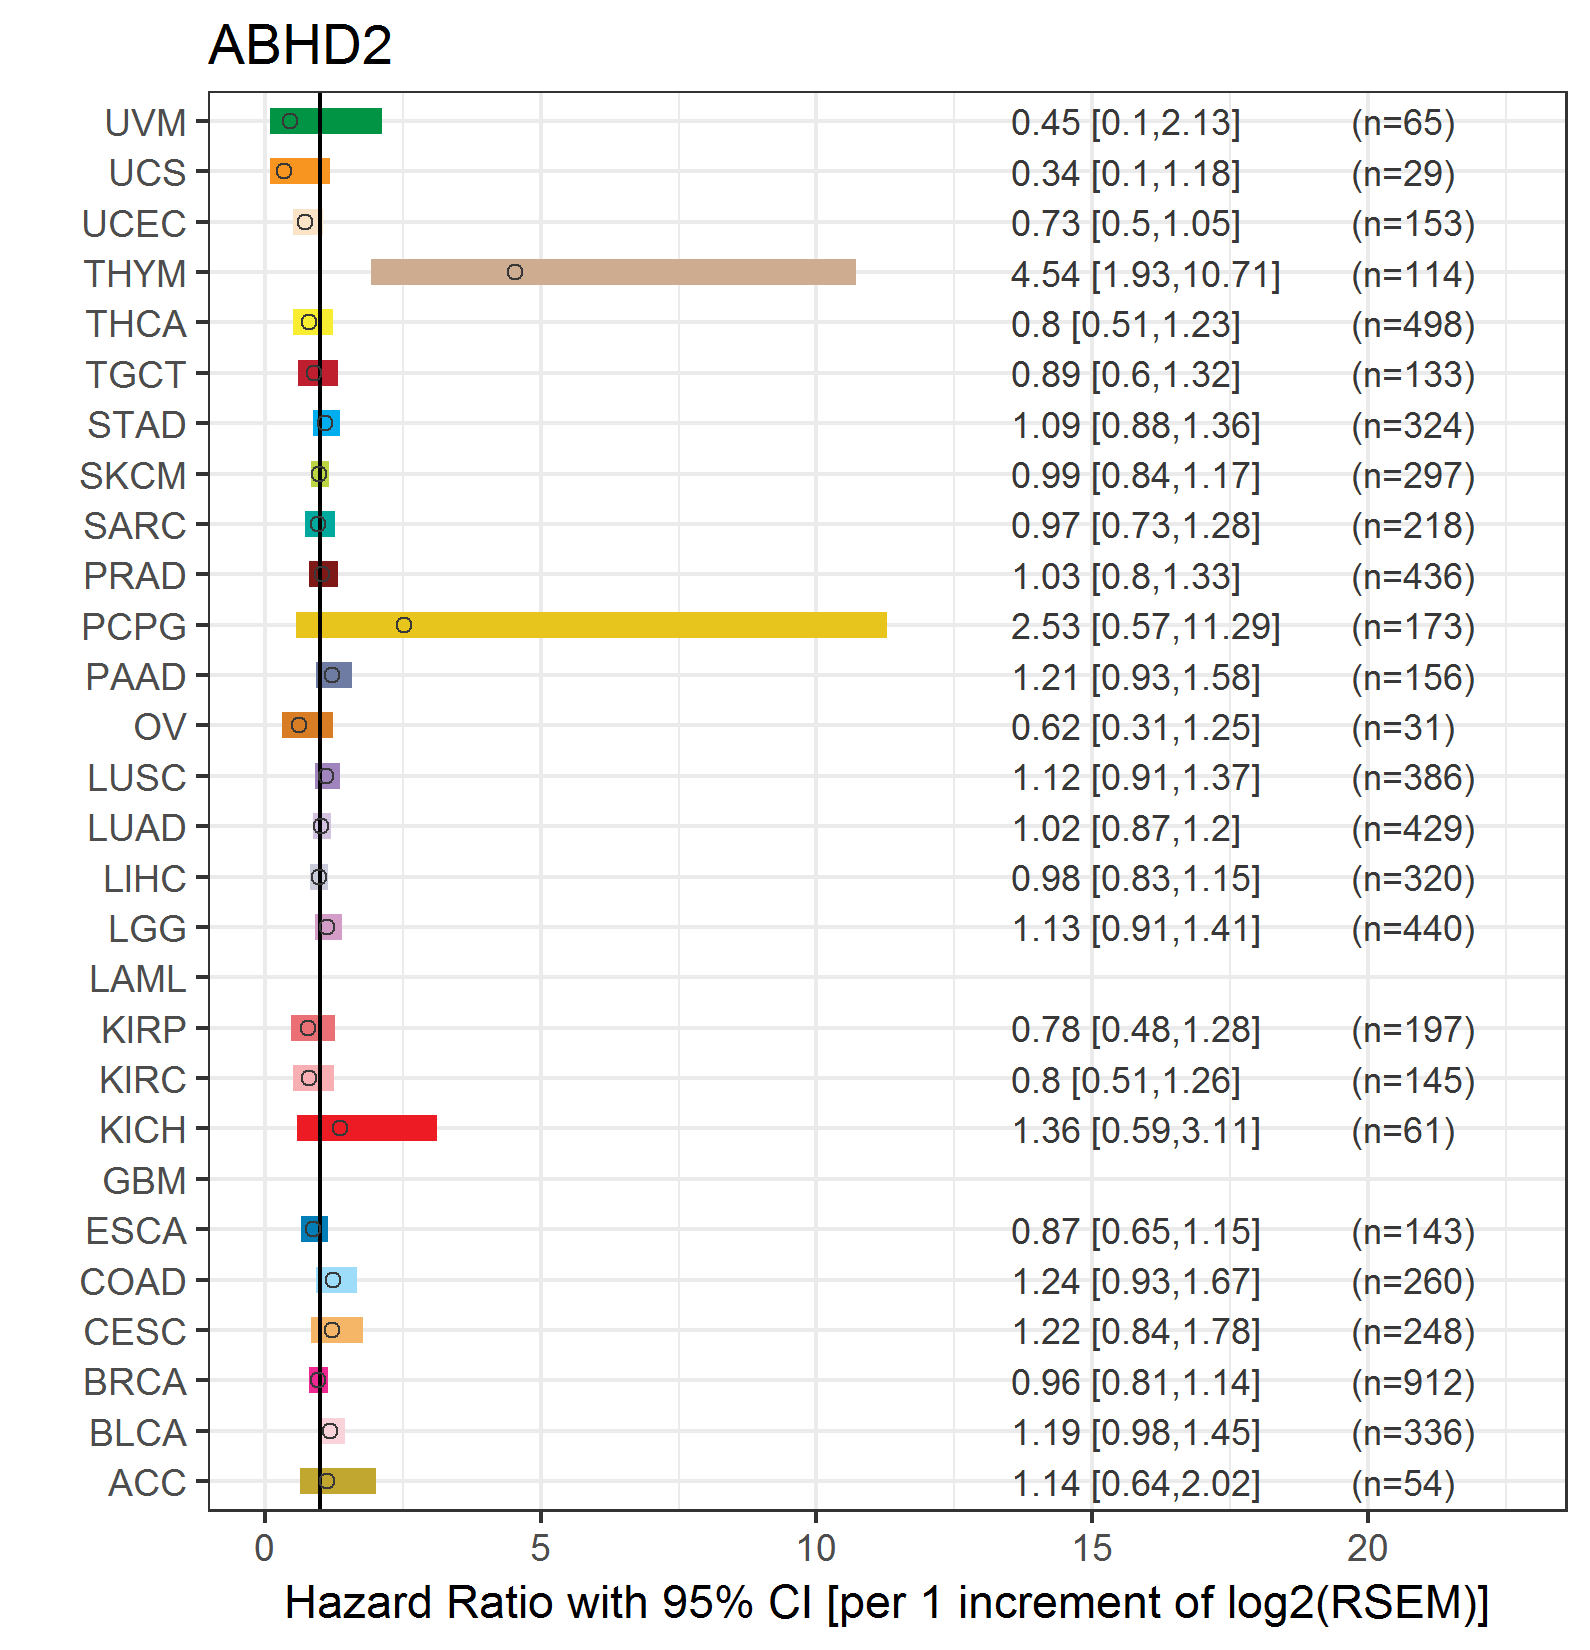
| Forest plot of Cox proportional hazard ratio (HR) and 95% CI of overall survival (OS) using 28 cancer types (TCGA IlluminaHiSeq_RNASeqV2, pan-cancer normalized log2(norm_counts+1) data, version 2016-08-16) (TCGA clinicalMatrix, phenotype data, version 2016-04-27) * Click on the image enlarge it in a new window. |
 |
| Forest plot of Cox proportional hazard ratio (HR) and 95% CI of relapse free survival (RFS) using 28 cancer types (TCGA IlluminaHiSeq_RNASeqV2, pan-cancer normalized log2(norm_counts+1) data, version 2016-08-16) (TCGA clinicalMatrix, phenotype data, version 2016-04-27) * Click on the image enlarge it in a new window. |
 |
| Top |
| TissGeneClin for ABHD2 |
| TissGeneDrug for ABHD2 |
| Drug information targeting TissGene (DrugBank Version 5.0.6, 2017-04-01) |
| DrugBank ID | Drug name | Drug activity | Drug type | Drug status |
| Top |
| TissGeneDisease for ABHD2 |
| Disease information associated with TissGene (DisGeNet, 2016-06-01) |
| Disease ID | Disease name | # pubmeds | Source |
| umls:C0024141 | Lupus Erythematosus, Systemic | 1 | BeFree |
| umls:C2931161 | Immunoglobulin a deficiency 1 | 1 | BeFree |
|
Copyright 2016-Present - The University of Texas Health Science Center at Houston (UTHealth) Web File Viewing | How to Report, Fraud, Waste and Abuse | State of Texas | Statewide Search | Texas Homeland Security | Site Policies |