 |
| |
| |
| |
| |
| |
| |
|

| TissGeneSummary for KIF12 |
 Gene summary Gene summary |
| Basic gene information | Gene symbol | KIF12 |
| Gene name | kinesin family member 12 | |
| Synonyms | - | |
| Cytomap | UCSC genome browser: 9q32 | |
| Type of gene | protein-coding | |
| RefGenes | NM_138424.1, | |
| Description | kinesin-like protein KIF12 | |
| Modification date | 20141207 | |
| dbXrefs | MIM : 611278 | |
| HGNC : HGNC | ||
| Ensembl : ENSG00000136883 | ||
| HPRD : 13914 | ||
| Vega : OTTHUMG00000020533 | ||
| Protein | UniProt: go to UniProt's Cross Reference DB Table | |
| Expression | CleanEX: HS_KIF12 | |
| BioGPS: 113220 | ||
| Pathway | NCI Pathway Interaction Database: KIF12 | |
| KEGG: KIF12 | ||
| REACTOME: KIF12 | ||
| Pathway Commons: KIF12 | ||
| Context | iHOP: KIF12 | |
| ligand binding site mutation search in PubMed: KIF12 | ||
| UCL Cancer Institute: KIF12 | ||
| Assigned class in TissGDB* | C | |
| Included tissue-specific gene expression resources | TiGER,GTEx | |
| Specific-tissues in normal samples (assigned by TissGDB using HPA, TiGER, and GTEx) | Kidney | |
| Cancer types related to the specific-tissues in cancer samples (assigned by TissGDB using TCGA) | KIRC,KIRP,KICH | |
| Reference showing the relevant tissue of KIF12 | ||
| Description by TissGene annotations | Protective TissGene in OS Protective TissGene in RFS | |
| * Class A consists of genes with literature evidence and is part of the cTissGenes. Class B consists of only cTissGenes without additional evidence. The remaining genes belong to Class C. |
| Gene ontology having evidence of Inferred from Direct Assay (IDA) from Entrez |
| GO ID | GO term | PubMed ID |
| Top |
| TissGeneExp for KIF12 |
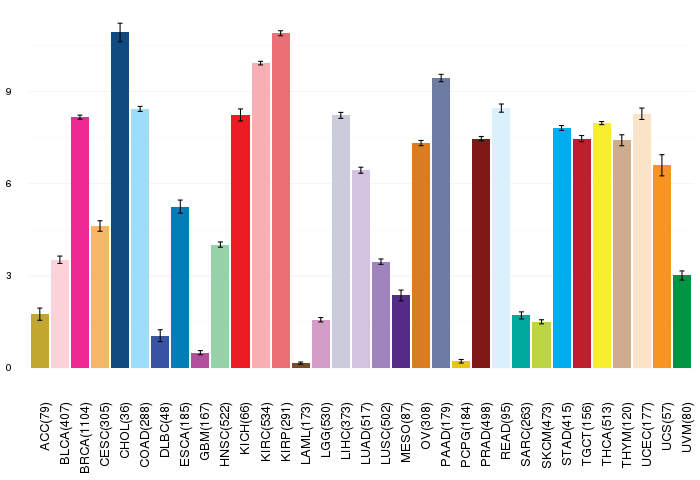
| Gene expressions across 28 cancer types (X-axis: cancer type and Y-axis: log2(norm_counts+1)) (TCGA IlluminaHiSeq_RNASeqV2, pan-cancer normalized log2(norm_counts+1) data, version 2016-08-16) |
 |
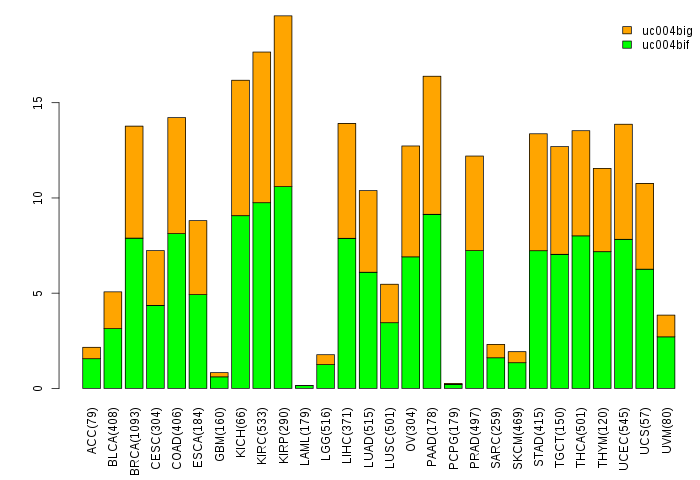
| Gene isoform expressions across 28 cancer types (X-axis: cancer type and Y-axis: log2(norm_counts+1)) (TCGA pan-cancer tcga_rsem_isoform_tpm, version 2016-09-01) |
 |
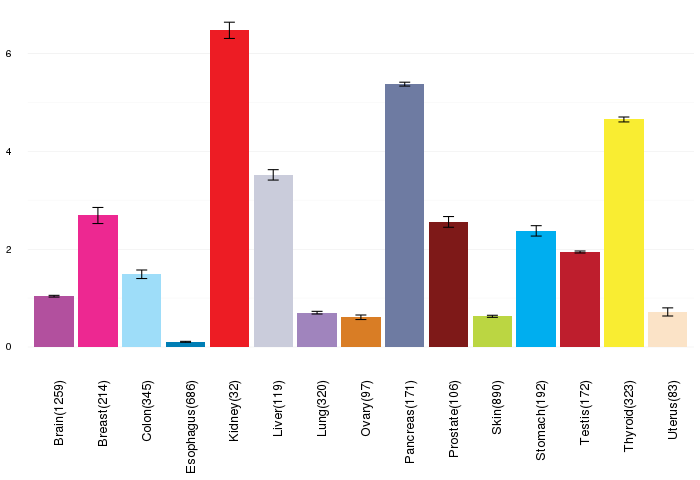
| Gene expressions across normal tissues of GTEx data (GTEx GTEx_Analysis_v6_RNA-seq_RNA-SeQCv1.1.8_gene_rpkm.gct) - Here, we shows the matched tissue types only among our 28 cancer types. |
 |
| Different expressions across 14 cancer types with more than 10 samples between matched tumors and normals (X-axis: cancer type and Y-axis: log2(norm_counts+1)) (TCGA IlluminaHiSeq_RNASeqV2, pan-cancer normalized log2(norm_counts+1) data, version 2016-08-16) |
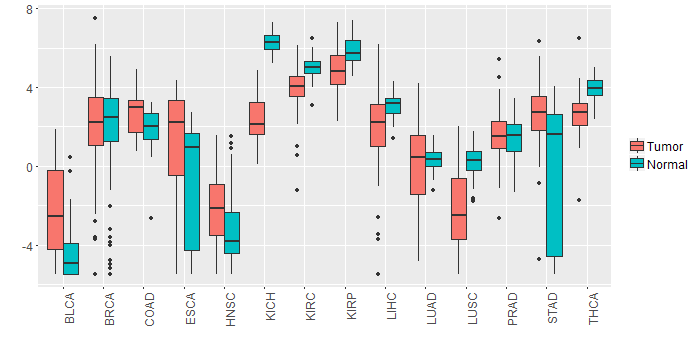 |
| - Significantly differentially expressed cancer types and information. (|Fold change|>1 and FDR<0.05) |
| Cancer type | Mean(exp) in tumor | Mean(exp) in matched normal | Log2FC | P-val. | FDR |
| LUSC | -2.226146817 | 0.209361026 | -2.435507843 | 1.50E-11 | 6.13E-11 |
| KICH | 2.490080242 | 6.315208242 | -3.825128 | 2.78E-15 | 6.07E-14 |
| THCA | 2.655642615 | 3.958800242 | -1.303157627 | 6.27E-12 | 4.92E-11 |
| KIRC | 3.903986353 | 5.036261353 | -1.132275 | 7.30E-11 | 2.64E-10 |
| BLCA | -2.307926074 | -4.239805021 | 1.931878947 | 0.00893 | 0.041289647 |
| STAD | 2.484431492 | -0.530093508 | 3.014525 | 0.000147 | 0.00108751 |
| LIHC | 1.782266242 | 3.088130242 | -1.305864 | 0.000164 | 0.000538822 |
| KIRP | 4.837903367 | 5.872218992 | -1.034315625 | 4.46E-05 | 0.000165278 |
| Top |
| TissGene-miRNA for KIF12 |
| Significantly anti-correlated miRNAs of TissGene across 28 cancer types (Gene-miRNA relations from TargetScanHuman Relsease 7.1, Conserved_Site_Context_Scores.txt.zip, 06.01.2016) (TCGA IlluminaHiSeq_miRNASeq, log2(RPM+1) data, version 2016-11-21) (TCGA IlluminaHiSeq_RNASeqV2, log2(normalized_count+1) data, version 2016-08-16) (Spearman’s Rank Correlation (p-value<0.05 and coefficient<-0.25)) |
| Cancer type | miRNA id | miRNA accession | P-val. | Coeff. | # samples |
| Top |
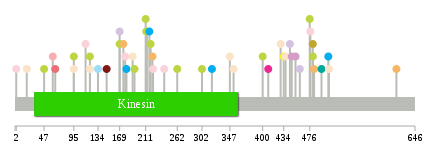
| TissGeneMut for KIF12 |
| TissGeneSNV for KIF12 |
| nsSNV counts per each loci. Different colors of circles represent different cancer types. Circle size denotes number of samples. (TCGA somatic mutation (SNPs and small INDELs) data, version 2016-04-25) * Click on the image to enlarge it in a new window. |
 |
 |
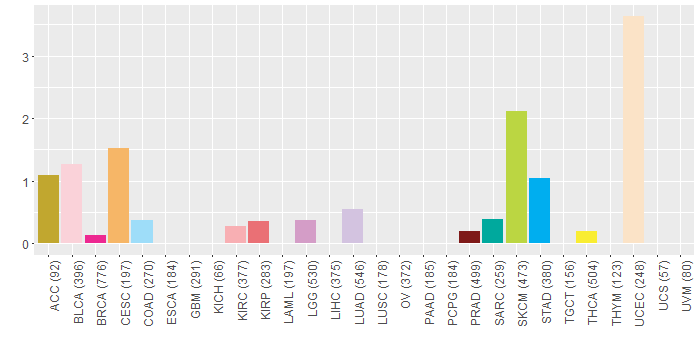
| Somatic nucleotide variants of TissGene across 28 cancer types (X-axis: cancer type and Y-axis: % of mutated samples) The numbers in parentheses are numbers of samples with mutation (nsSNVs). (TCGA somatic mutation (SNPs and small INDELs) data, version 2016-04-25) |
 |
| - nsSNVs sorted by frequency. |
| AAchange | Cancer type | # samples |
| p.Q477H | BLCA | 1 |
| p.S114F | BLCA | 1 |
| p.L148P | PRAD | 1 |
| p.R61G | KIRC | 1 |
| p.S134T | COAD | 1 |
| p.P175S | CESC | 1 |
| p.A481V | SKCM | 1 |
| p.A481D | ACC | 1 |
| p.G507D | UCEC | 1 |
| p.P121S | SKCM | 1 |
| p.L211R | SKCM | 1 |
| p.V19I | UCEC | 1 |
| p.P347S | UCEC | 1 |
| p.E213K | SKCM | 1 |
| p.E73K | HNSC | 1 |
| p.D190N | UCEC | 1 |
| p.E447D | LGG | 1 |
| p.I153M | HNSC | 1 |
| p.R318C | STAD | 1 |
| p.Q2H | BLCA | 1 |
| p.R223* | BLCA | 1 |
| p.G193R | SKCM | 1 |
| p.G121E | UCEC | 1 |
| p.T217A | STAD | 1 |
| p.L222V | CESC | 1 |
| p.V47A | SKCM | 1 |
| p.R437Q | UCEC | 1 |
| p.P460L | LUAD | 1 |
| p.P212S | SKCM | 1 |
| p.A400V | SKCM | 1 |
| p.D169Y | LUAD | 1 |
| p.F65I | KIRP | 1 |
| p.P178L | BLCA | 1 |
| p.Q262* | SKCM | 1 |
| p.T444M | LUAD | 1 |
| p.S429R | UCEC | 1 |
| p.R95Q | SKCM | 1 |
| p.Q241H | BLCA | 1 |
| p.D169N | SKCM | 1 |
| p.P506S | STAD | 1 |
| p.P453S | LGG | 1 |
| p.T434S | THCA | 1 |
| p.R409Q | BRCA | 1 |
| p.R616K | CESC | 1 |
| p.R180W | STAD | 1 |
| p.A476T | SKCM | 1 |
| p.A353T | UCEC | 1 |
| p.E302K | SKCM | 1 |
| p.S495R | SARC | 1 |
| p.R95Q | UCEC | 1 |
| p.R483K | CESC | 1 |
| p.R219Q | SKCM | 1 |
| Top |
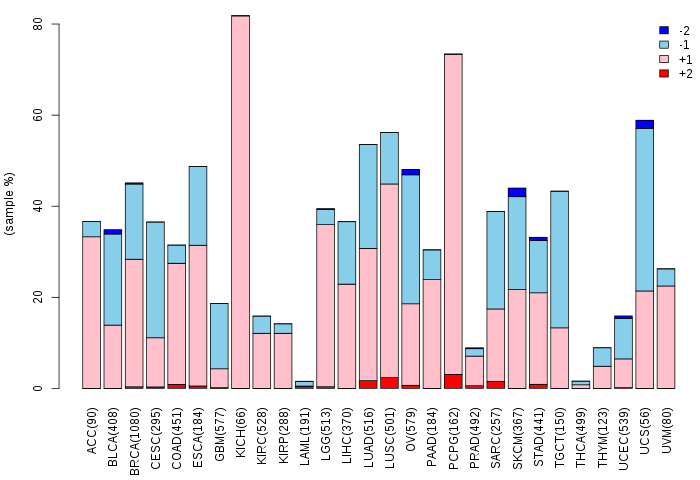
| TissGeneCNV for KIF12 |
| Copy number variations of TissGene across 28 cancer types (X-axis: cancer type and Y-axis: % of CNV samples) (TCGA Gistic2_CopyNumber_Gistic2_all_data_by_genes, Gistic2 copy number data, version 2016-08-16) |
 |
| Top |
| TissGeneFusions for KIF12 |
| Fusion genes including TissGene (ChimerDB 3.0, 2016-12-01 and TCGA fusion Portal 2015-12-01) |
| Database | Src | Cancer type | Sample | Fusion gene | ORF | 5'-gene BP | 3'-gene BP |
| Top |
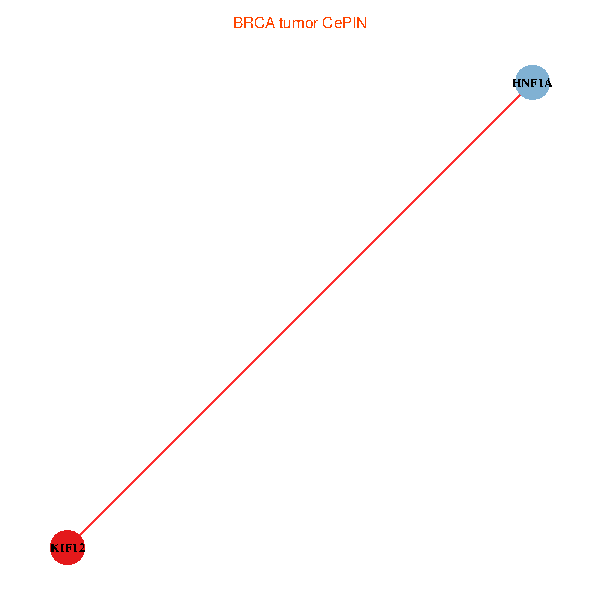
| TissGeneNet for KIF12 |
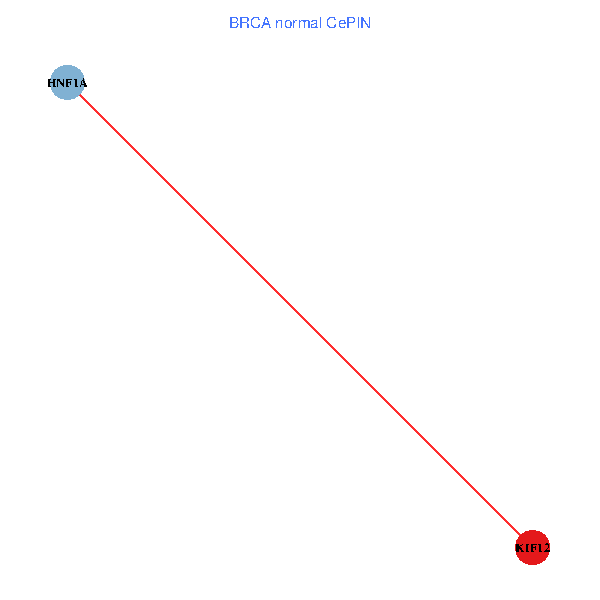
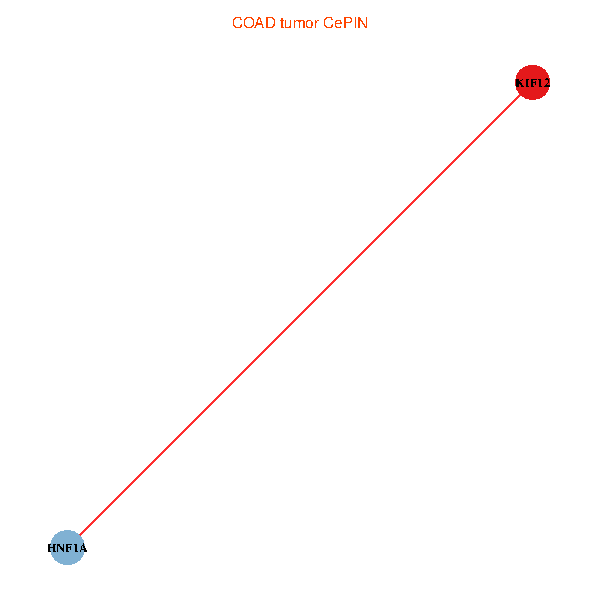
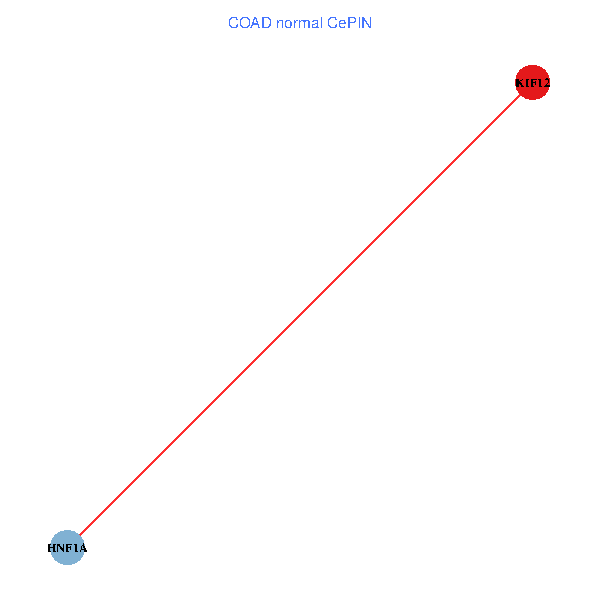
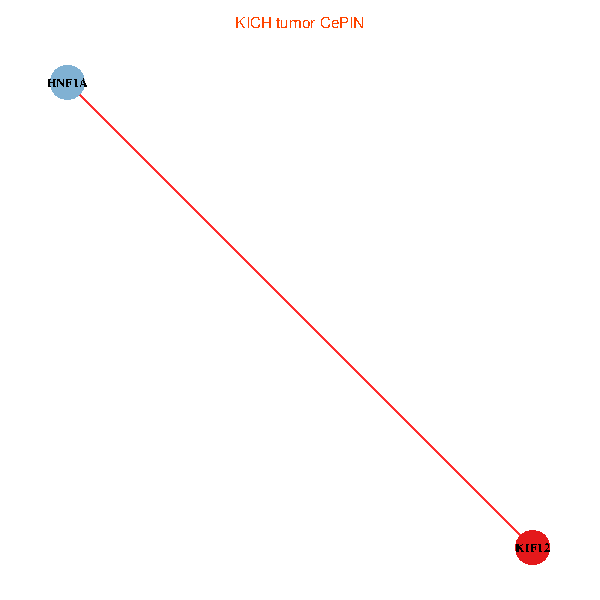
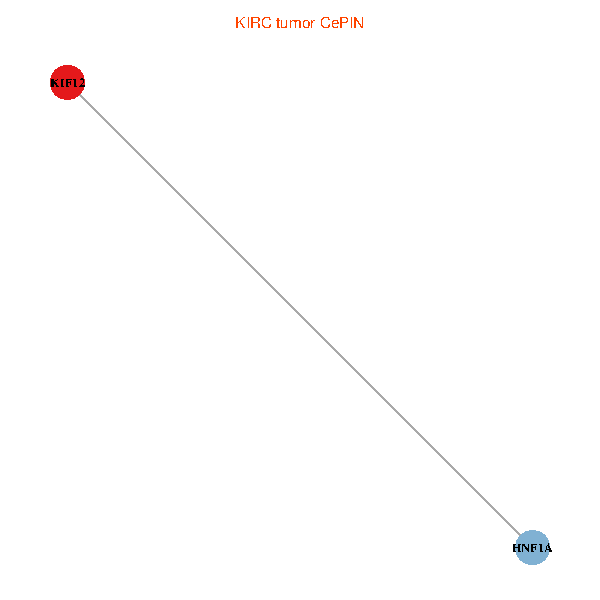
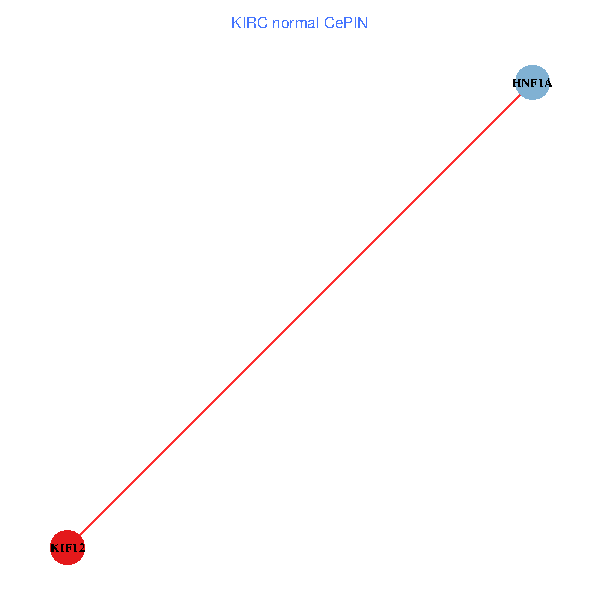
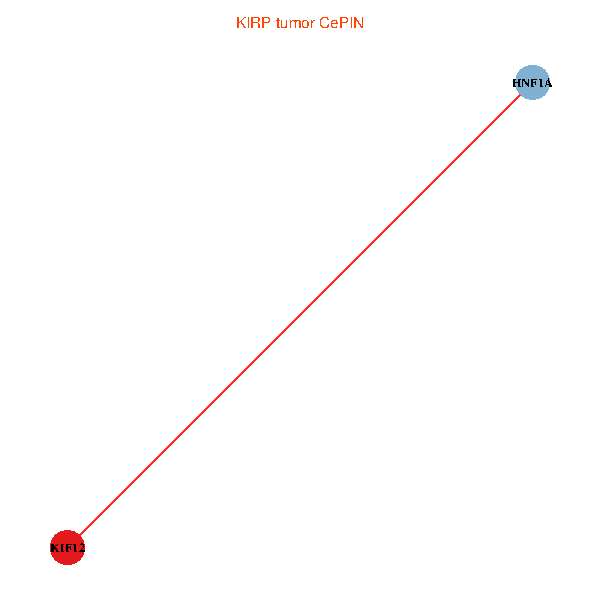
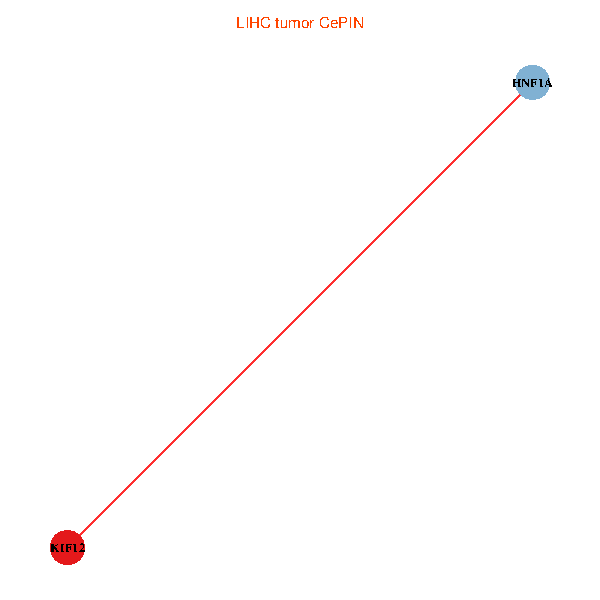
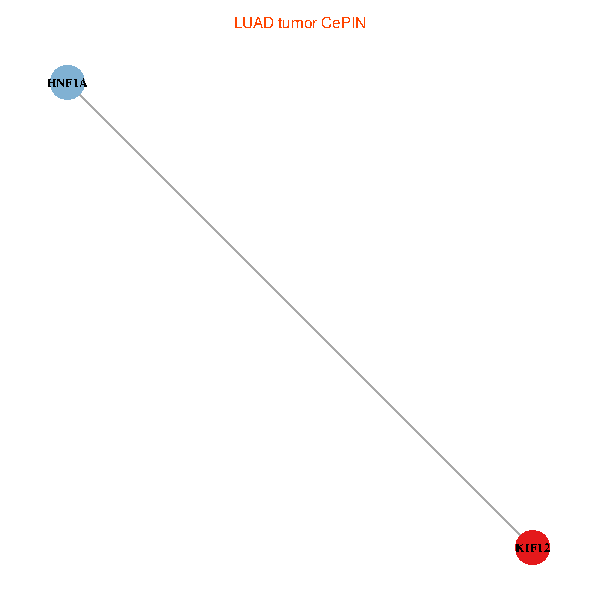
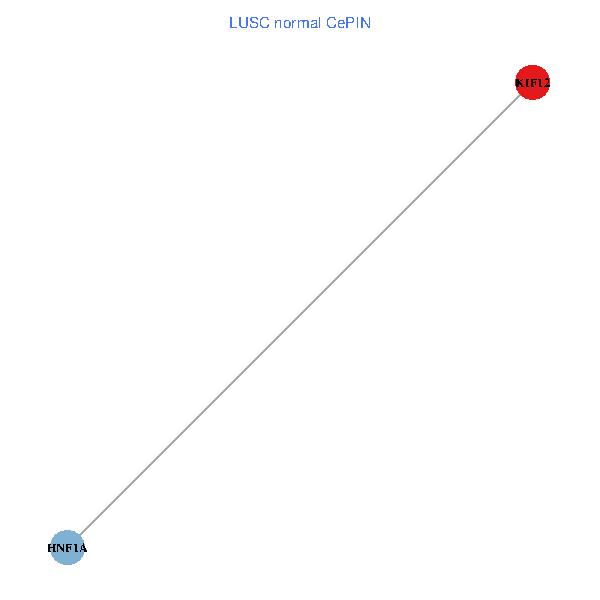
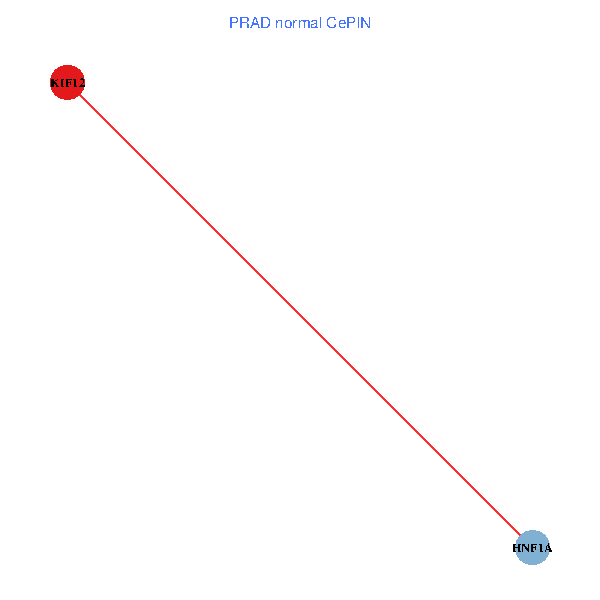
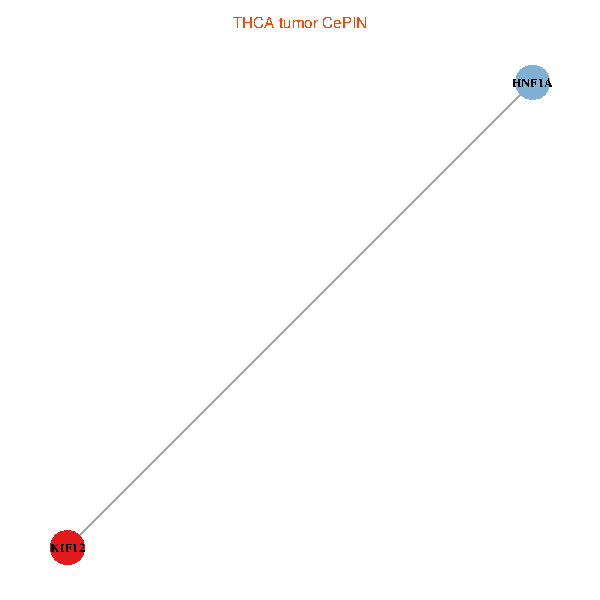
| Co-expressed gene networks based on protein-protein interaction data (CePIN) (TCGA IlluminaHiSeq_RNASeqV2, pan-cancer normalized log2(norm_counts+1) data, version 2016-08-16) (PINA2 ppi data) |
| BRCA (tumor) | BRCA (normal) |
| KIF12, HNF1A (tumor) | KIF12, HNF1A (normal) |
 |  |
| COAD (tumor) | COAD (normal) |
| KIF12, HNF1A (tumor) | KIF12, HNF1A (normal) |
 |  |
| HNSC (tumor) | HNSC (normal) |
| KIF12, HNF1A (tumor) | KIF12, HNF1A (normal) |
 |  |
| KICH (tumor) | KICH (normal) |
| KIF12, HNF1A (tumor) | KIF12, HNF1A (normal) |
 |  |
| KIRC (tumor) | KIRC (normal) |
| KIF12, HNF1A (tumor) | KIF12, HNF1A (normal) |
 |  |
| KIRP (tumor) | KIRP (normal) |
| KIF12, HNF1A (tumor) | KIF12, HNF1A (normal) |
 |  |
| LIHC (tumor) | LIHC (normal) |
| KIF12, HNF1A (tumor) | KIF12, HNF1A (normal) |
 |  |
| LUAD (tumor) | LUAD (normal) |
| KIF12, HNF1A (tumor) | KIF12, HNF1A (normal) |
 |  |
| LUSC (tumor) | LUSC (normal) |
| KIF12, HNF1A (tumor) | KIF12, HNF1A (normal) |
 |  |
| PRAD (tumor) | PRAD (normal) |
| KIF12, HNF1A (tumor) | KIF12, HNF1A (normal) |
 |  |
| STAD (tumor) | STAD (normal) |
| KIF12, HNF1A (tumor) | KIF12, HNF1A (normal) |
 |  |
| THCA (tumor) | THCA (normal) |
| KIF12, HNF1A (tumor) | KIF12, HNF1A (normal) |
 |  |
| Top |
| TissGeneProg for KIF12 |
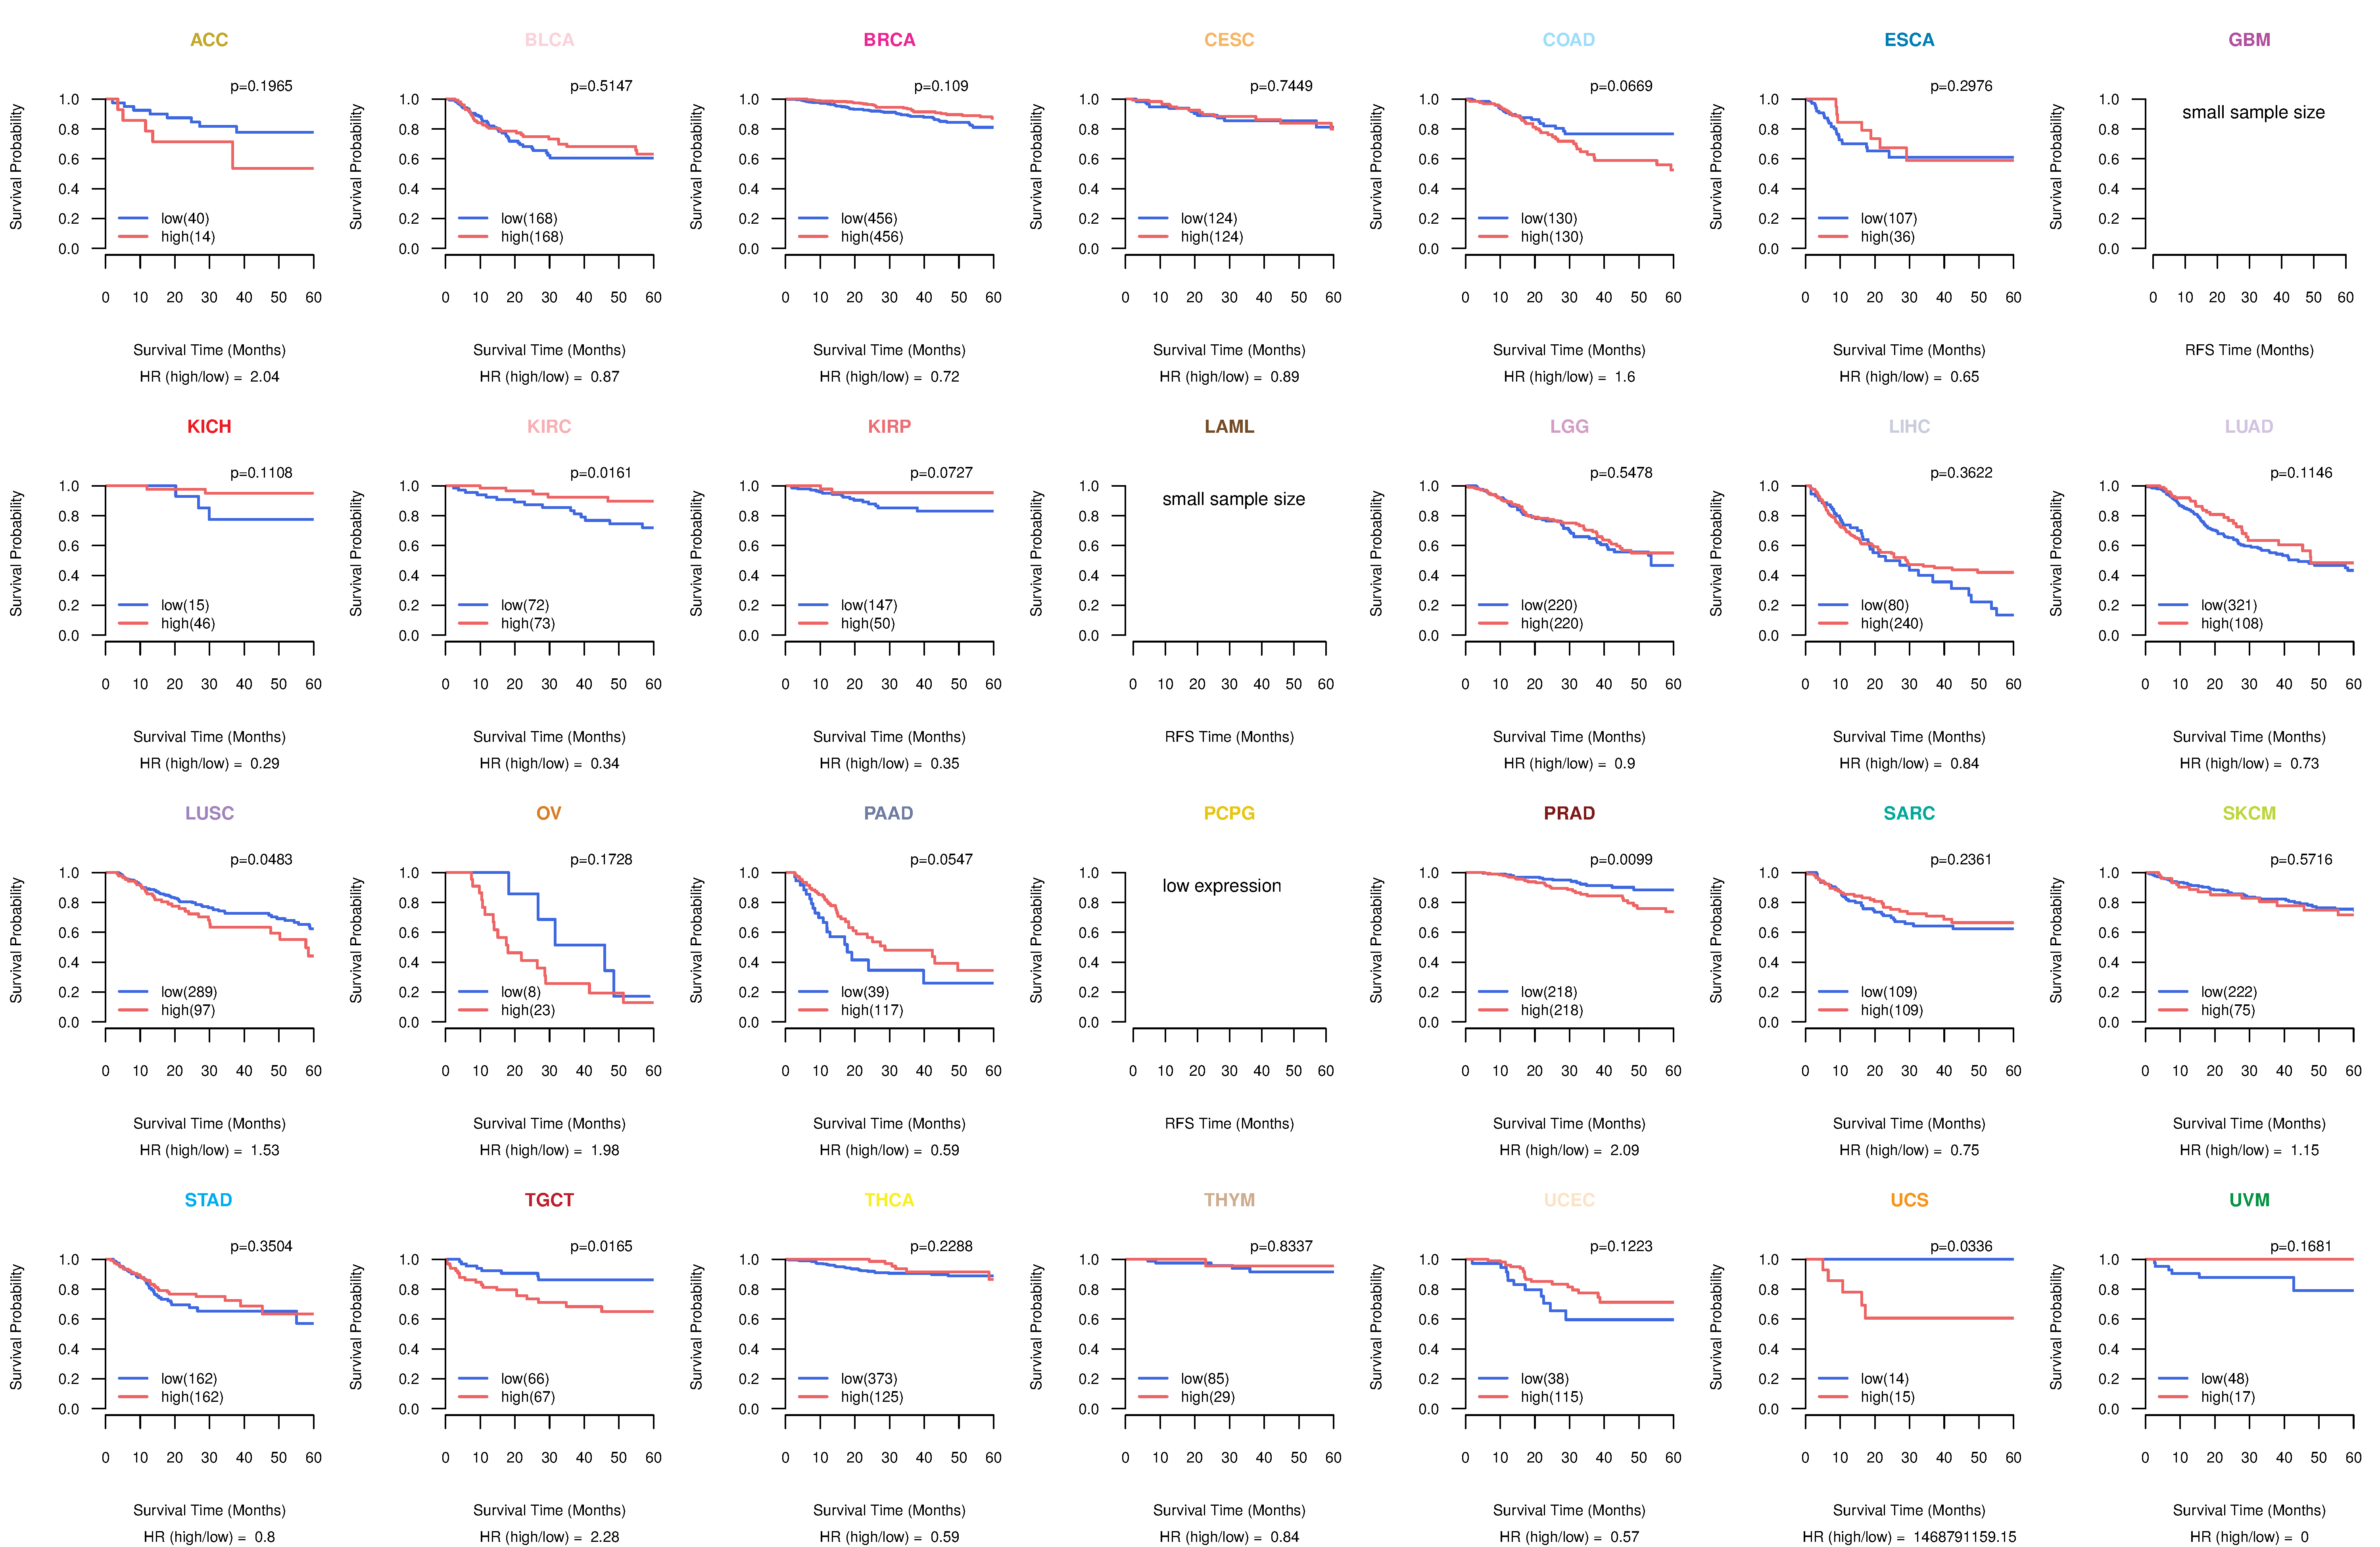
| Kaplan-Meier plots with logrank tests of overall survival (OS) using 28 cancer types (TCGA IlluminaHiSeq_RNASeqV2, pan-cancer normalized log2(norm_counts+1) data, version 2016-08-16) (TCGA clinicalMatrix, phenotype data, version 2016-04-27) * Click on the image to enlarge it in a new window. |
 |
| Kaplan-Meier plots with logrank test of relapse free survival (RFS) using 28 cancer types (TCGA IlluminaHiSeq_RNASeqV2, pan-cancer normalized log2(norm_counts+1) data, version 2016-08-16) (TCGA clinicalMatrix, phenotype data, version 2016-04-27) * Click on the image enlarge it in a new window. |
 |
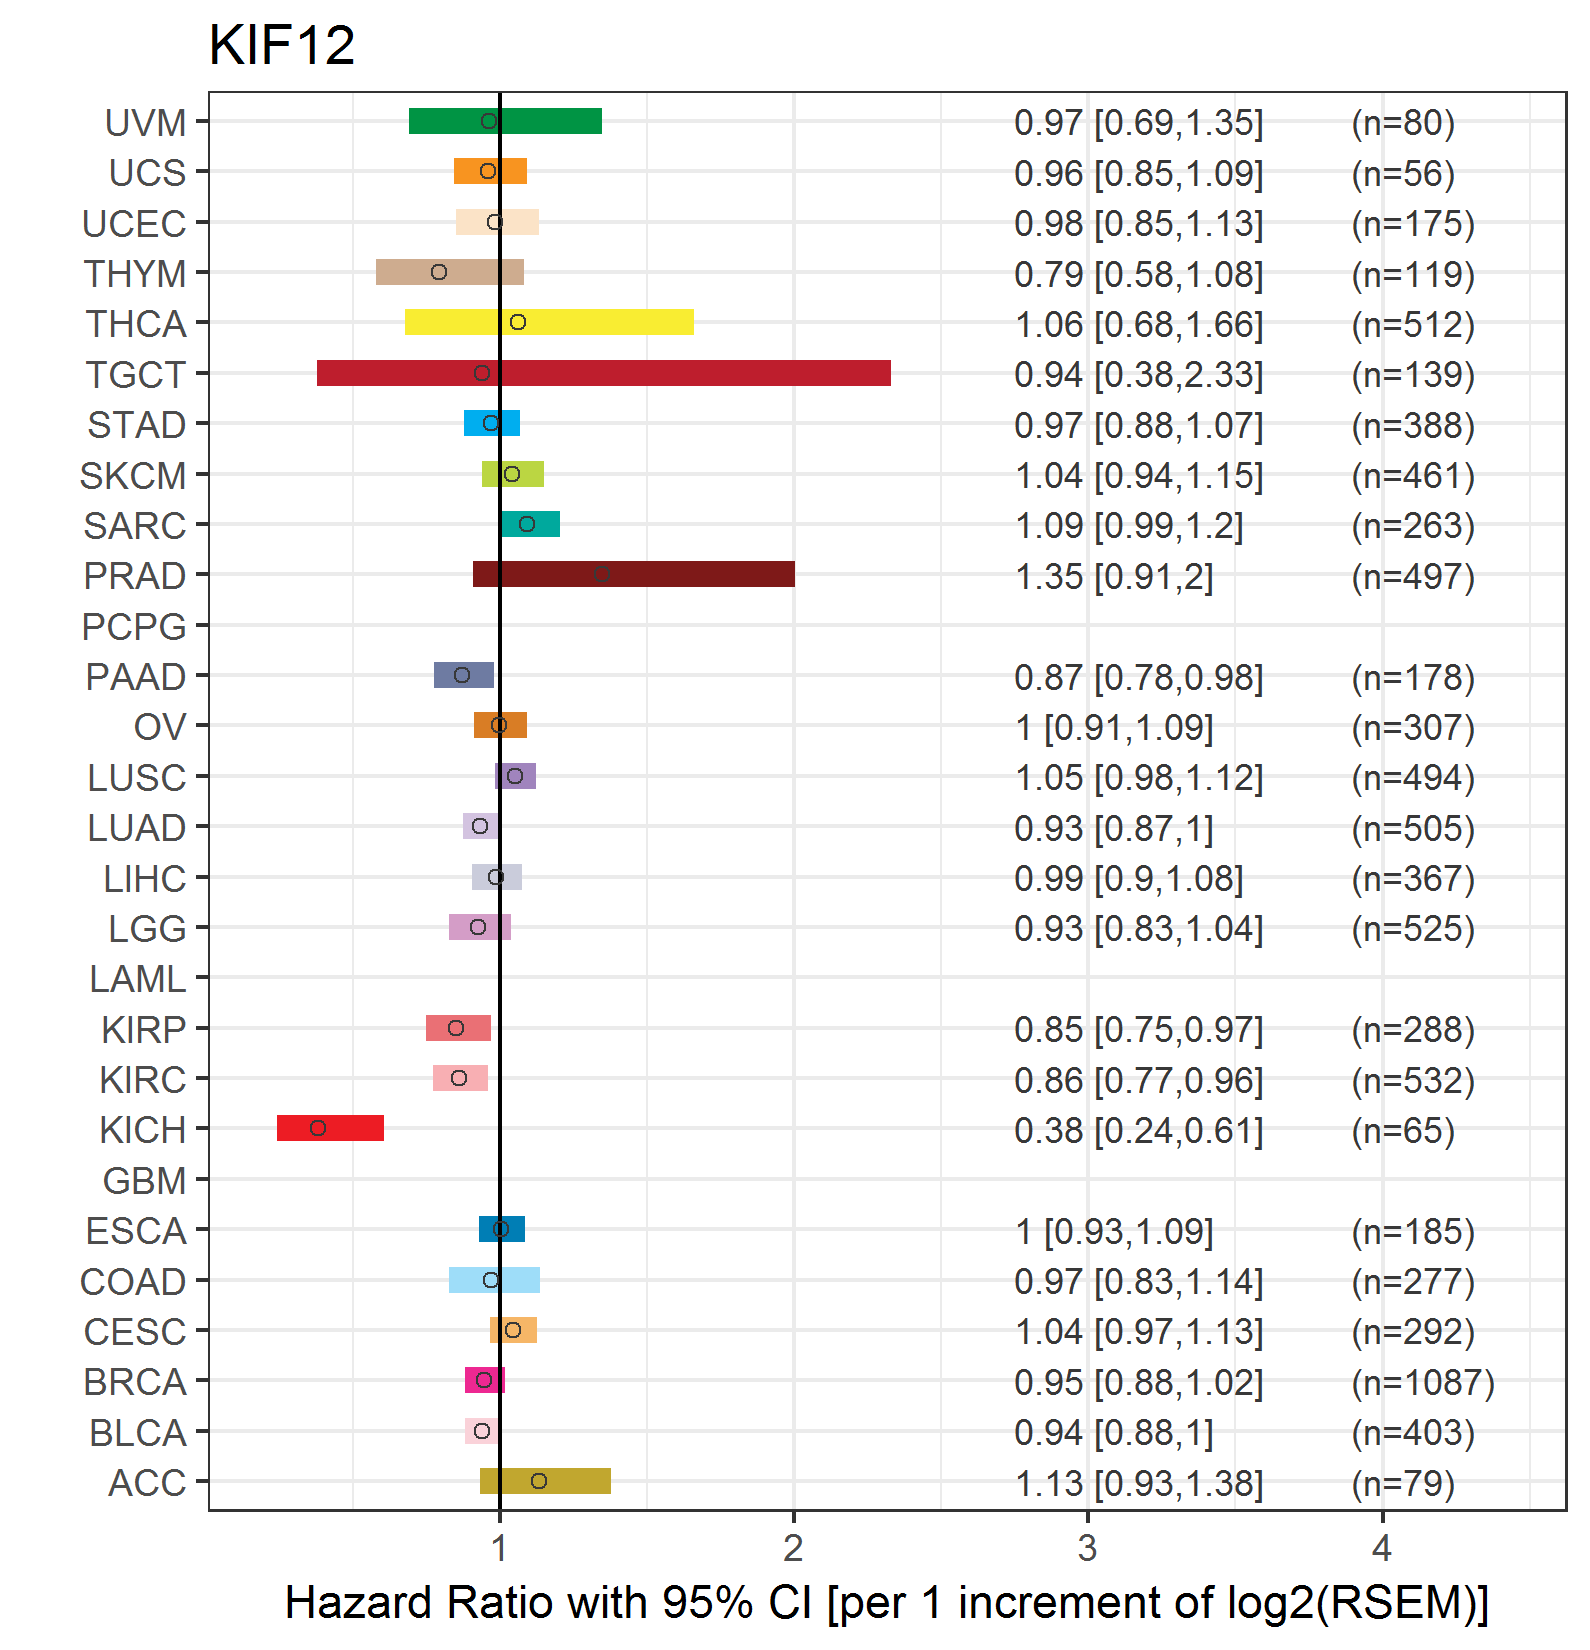
| Forest plot of Cox proportional hazard ratio (HR) and 95% CI of overall survival (OS) using 28 cancer types (TCGA IlluminaHiSeq_RNASeqV2, pan-cancer normalized log2(norm_counts+1) data, version 2016-08-16) (TCGA clinicalMatrix, phenotype data, version 2016-04-27) * Click on the image enlarge it in a new window. |
 |
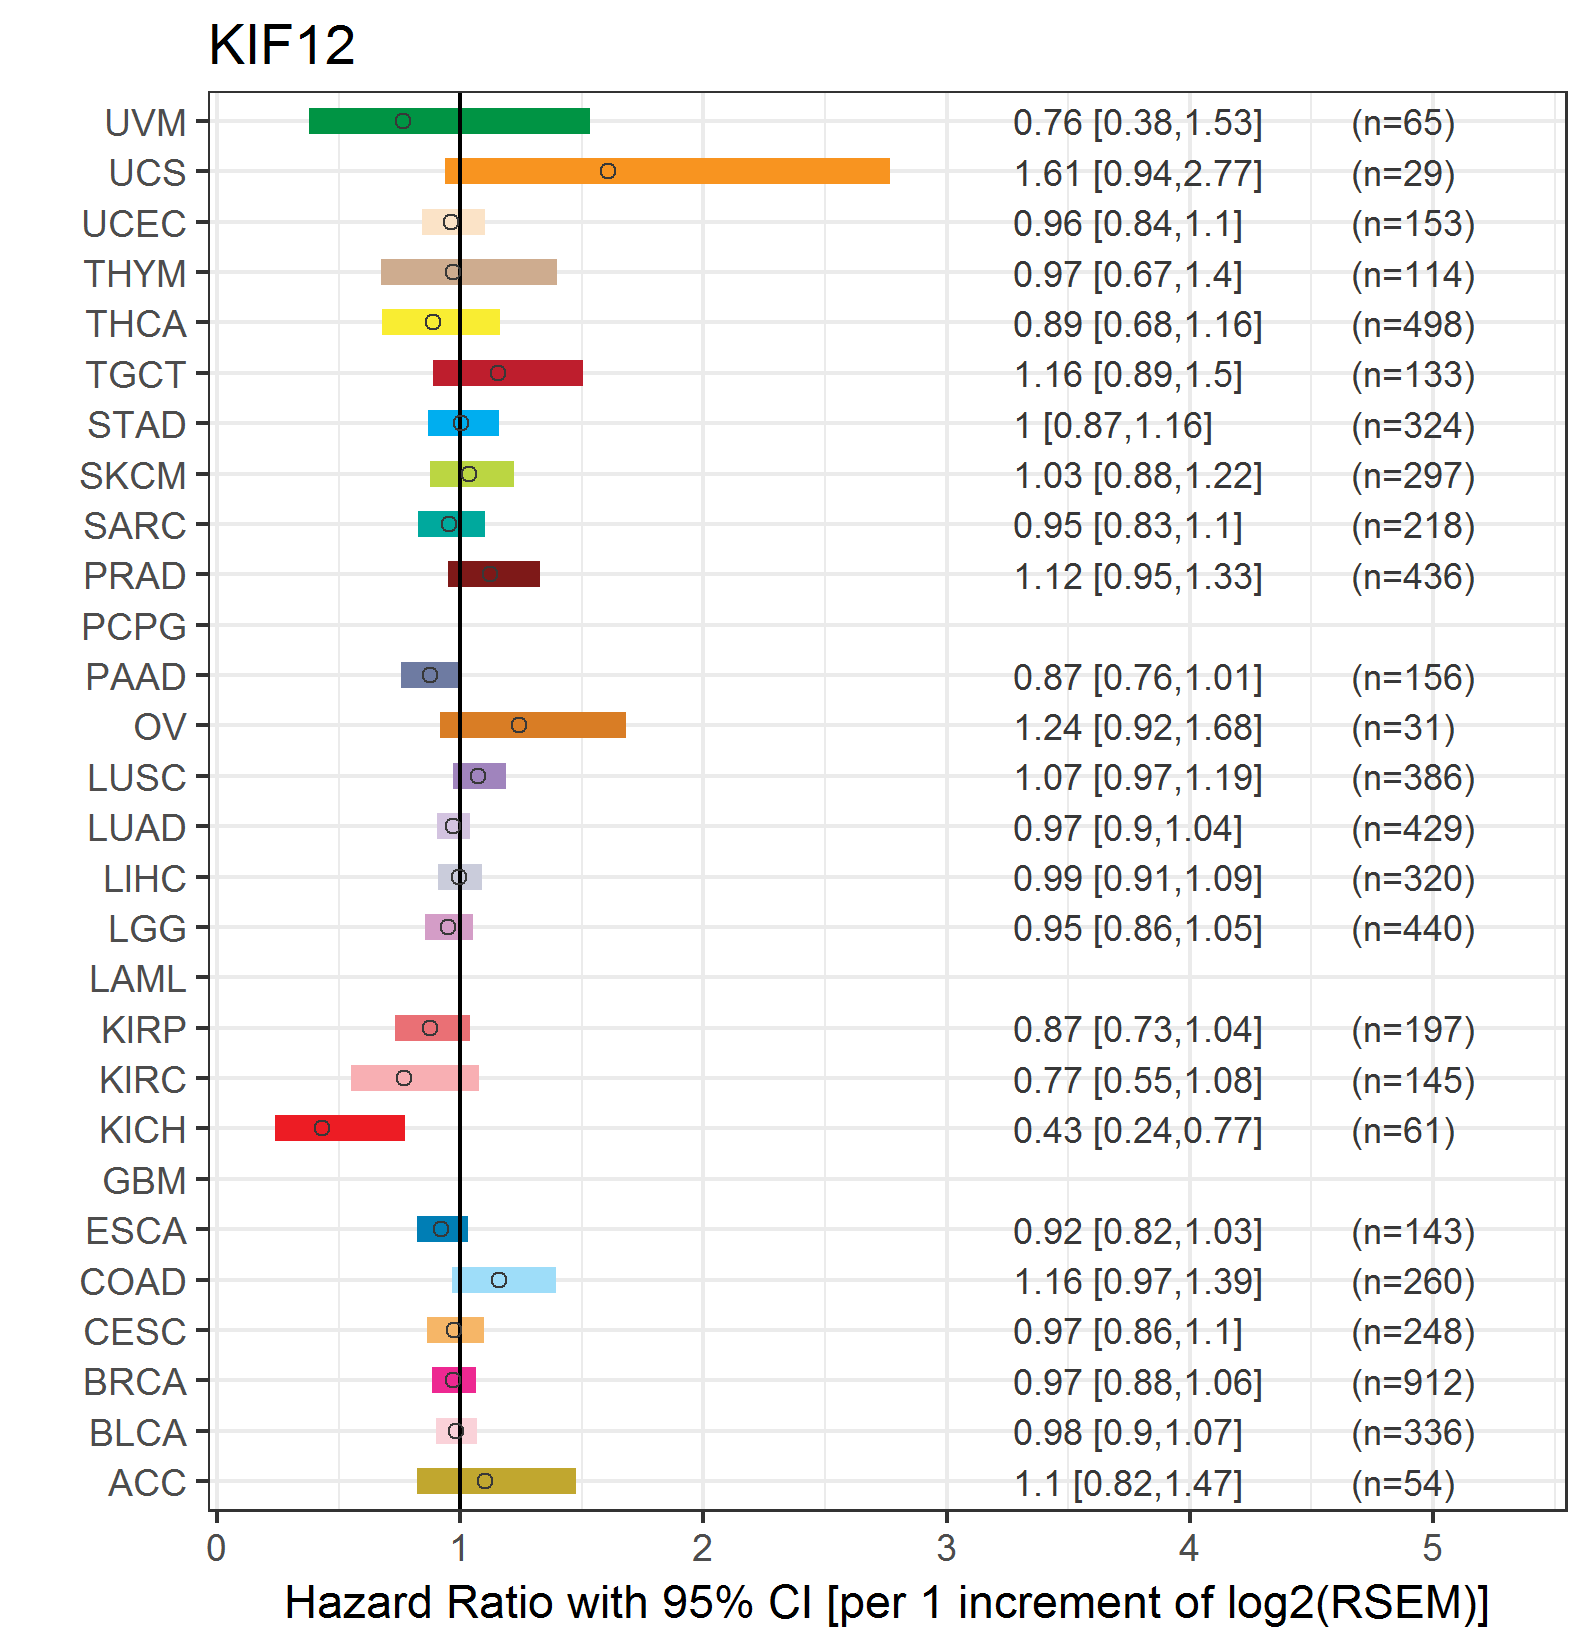
| Forest plot of Cox proportional hazard ratio (HR) and 95% CI of relapse free survival (RFS) using 28 cancer types (TCGA IlluminaHiSeq_RNASeqV2, pan-cancer normalized log2(norm_counts+1) data, version 2016-08-16) (TCGA clinicalMatrix, phenotype data, version 2016-04-27) * Click on the image enlarge it in a new window. |
 |
| Top |
| TissGeneClin for KIF12 |
| TissGeneDrug for KIF12 |
| Drug information targeting TissGene (DrugBank Version 5.0.6, 2017-04-01) |
| DrugBank ID | Drug name | Drug activity | Drug type | Drug status |
| Top |
| TissGeneDisease for KIF12 |
| Disease information associated with TissGene (DisGeNet, 2016-06-01) |
| Disease ID | Disease name | # pubmeds | Source |
|
Copyright 2016-Present - The University of Texas Health Science Center at Houston (UTHealth) Web File Viewing | How to Report, Fraud, Waste and Abuse | State of Texas | Statewide Search | Texas Homeland Security | Site Policies |