 |
| |
| |
| |
| |
| |
| |
|

| TissGeneSummary for CLNK |
 Gene summary Gene summary |
| Basic gene information | Gene symbol | CLNK |
| Gene name | cytokine-dependent hematopoietic cell linker | |
| Synonyms | MIST | |
| Cytomap | UCSC genome browser: 4p16.1 | |
| Type of gene | protein-coding | |
| RefGenes | NM_052964.2, | |
| Description | mast cell immunoreceptor signal transducer | |
| Modification date | 20141207 | |
| dbXrefs | MIM : 611434 | |
| HGNC : HGNC | ||
| Ensembl : ENSG00000109684 | ||
| HPRD : 14720 | ||
| Protein | UniProt: go to UniProt's Cross Reference DB Table | |
| Expression | CleanEX: HS_CLNK | |
| BioGPS: 116449 | ||
| Pathway | NCI Pathway Interaction Database: CLNK | |
| KEGG: CLNK | ||
| REACTOME: CLNK | ||
| Pathway Commons: CLNK | ||
| Context | iHOP: CLNK | |
| ligand binding site mutation search in PubMed: CLNK | ||
| UCL Cancer Institute: CLNK | ||
| Assigned class in TissGDB* | C | |
| Included tissue-specific gene expression resources | TiGER,GTEx | |
| Specific-tissues in normal samples (assigned by TissGDB using HPA, TiGER, and GTEx) | Kidney | |
| Cancer types related to the specific-tissues in cancer samples (assigned by TissGDB using TCGA) | KIRC,KIRP,KICH | |
| Reference showing the relevant tissue of CLNK | ||
| Description by TissGene annotations | Cancer gene | |
| * Class A consists of genes with literature evidence and is part of the cTissGenes. Class B consists of only cTissGenes without additional evidence. The remaining genes belong to Class C. |
| Gene ontology having evidence of Inferred from Direct Assay (IDA) from Entrez |
| GO ID | GO term | PubMed ID | GO:0035556 | intracellular signal transduction | 10744659 | GO:0035556 | intracellular signal transduction | 10744659 |
| Top |
| TissGeneExp for CLNK |
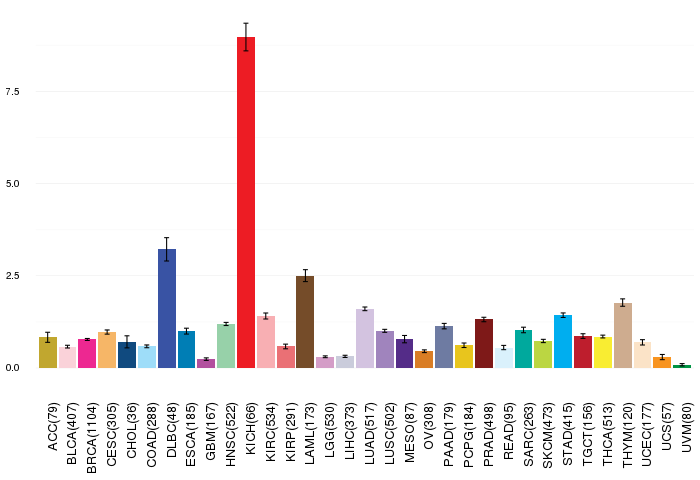
| Gene expressions across 28 cancer types (X-axis: cancer type and Y-axis: log2(norm_counts+1)) (TCGA IlluminaHiSeq_RNASeqV2, pan-cancer normalized log2(norm_counts+1) data, version 2016-08-16) |
 |
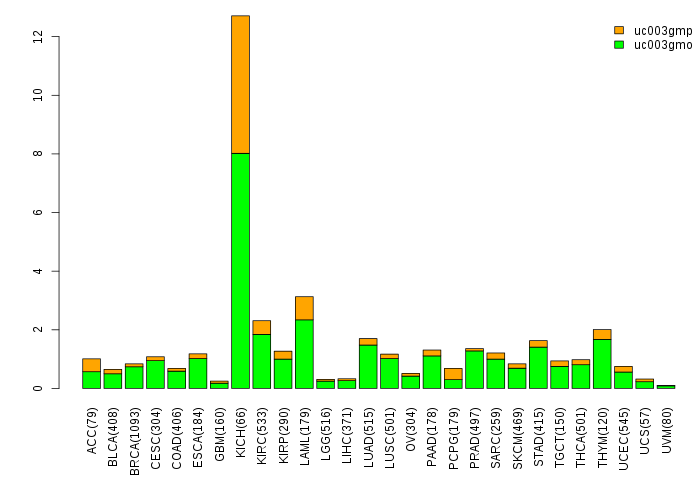
| Gene isoform expressions across 28 cancer types (X-axis: cancer type and Y-axis: log2(norm_counts+1)) (TCGA pan-cancer tcga_rsem_isoform_tpm, version 2016-09-01) |
 |
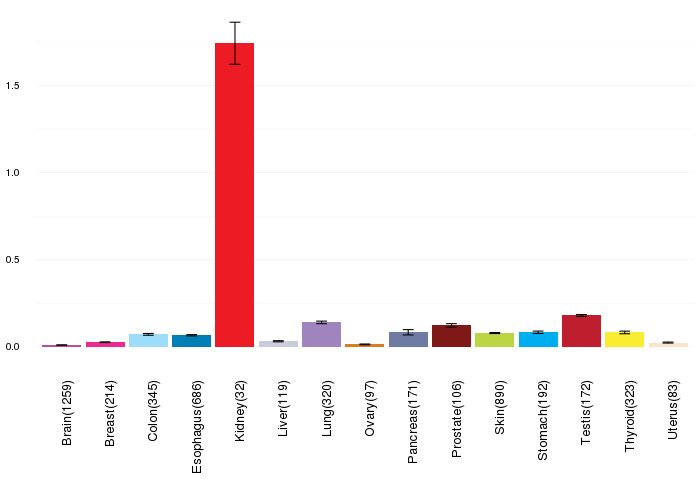
| Gene expressions across normal tissues of GTEx data (GTEx GTEx_Analysis_v6_RNA-seq_RNA-SeQCv1.1.8_gene_rpkm.gct) - Here, we shows the matched tissue types only among our 28 cancer types. |
 |
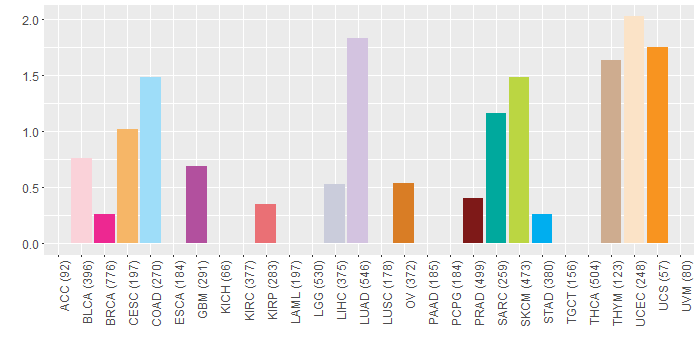
| Different expressions across 14 cancer types with more than 10 samples between matched tumors and normals (X-axis: cancer type and Y-axis: log2(norm_counts+1)) (TCGA IlluminaHiSeq_RNASeqV2, pan-cancer normalized log2(norm_counts+1) data, version 2016-08-16) |
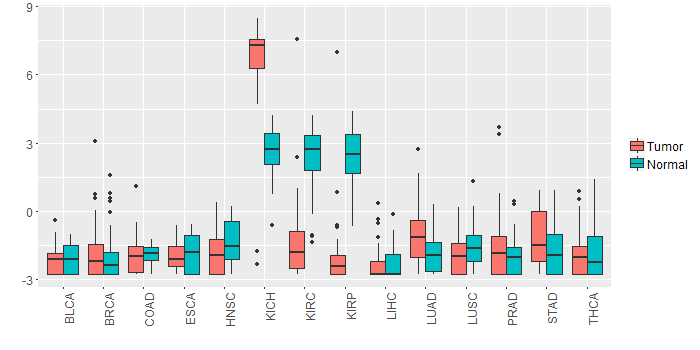 |
| - Significantly differentially expressed cancer types and information. (|Fold change|>1 and FDR<0.05) |
| Cancer type | Mean(exp) in tumor | Mean(exp) in matched normal | Log2FC | P-val. | FDR |
| KICH | 6.326571549 | 2.516247549 | 3.810324 | 2.09E-07 | 9.01E-07 |
| KIRC | -1.429901229 | 2.386293216 | -3.816194444 | 2.47E-33 | 5.89E-32 |
| KIRP | -1.926310951 | 2.475376549 | -4.4016875 | 7.63E-16 | 2.41E-14 |
| Top |
| TissGene-miRNA for CLNK |
| Significantly anti-correlated miRNAs of TissGene across 28 cancer types (Gene-miRNA relations from TargetScanHuman Relsease 7.1, Conserved_Site_Context_Scores.txt.zip, 06.01.2016) (TCGA IlluminaHiSeq_miRNASeq, log2(RPM+1) data, version 2016-11-21) (TCGA IlluminaHiSeq_RNASeqV2, log2(normalized_count+1) data, version 2016-08-16) (Spearman’s Rank Correlation (p-value<0.05 and coefficient<-0.25)) |
| Cancer type | miRNA id | miRNA accession | P-val. | Coeff. | # samples |
| Top |
| TissGeneMut for CLNK |
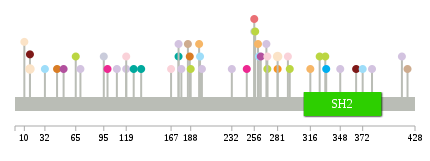
| TissGeneSNV for CLNK |
| nsSNV counts per each loci. Different colors of circles represent different cancer types. Circle size denotes number of samples. (TCGA somatic mutation (SNPs and small INDELs) data, version 2016-04-25) * Click on the image to enlarge it in a new window. |
 |
 |
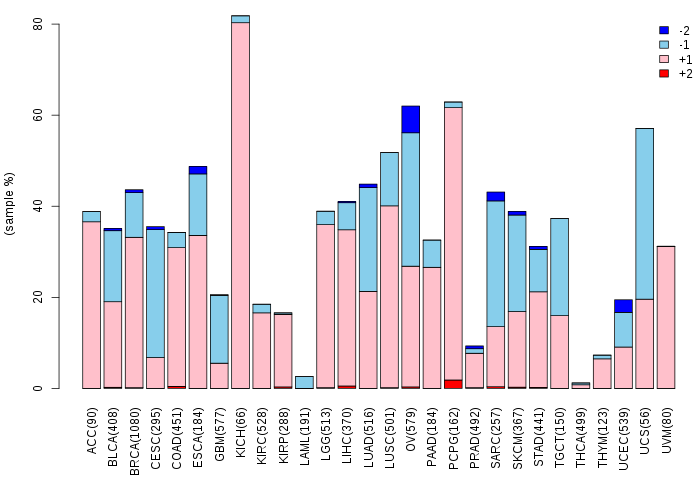
| Somatic nucleotide variants of TissGene across 28 cancer types (X-axis: cancer type and Y-axis: % of mutated samples) The numbers in parentheses are numbers of samples with mutation (nsSNVs). (TCGA somatic mutation (SNPs and small INDELs) data, version 2016-04-25) |
 |
| - nsSNVs sorted by frequency. |
| AAchange | Cancer type | # samples |
| p.D16N | UCEC | 2 |
| p.E281K | UCEC | 2 |
| p.F332I | SKCM | 1 |
| p.L348F | LUAD | 1 |
| p.R292I | READ | 1 |
| p.P109T | LUAD | 1 |
| p.E365X | PRAD | 1 |
| p.E95Q | LIHC | 1 |
| p.H414Q | LUAD | 1 |
| p.S119C | LUAD | 1 |
| p.L187F | OV | 1 |
| p.R257K | SKCM | 1 |
| p.N232K | LUAD | 1 |
| p.S139Y | CHOL | 1 |
| p.Q269K | LUAD | 1 |
| p.N256H | KIRP | 1 |
| p.T248M | BRCA | 1 |
| p.R292K | BLCA | 1 |
| p.M263I | GBM | 1 |
| p.D135E | SARC | 1 |
| p.S188F | SKCM | 1 |
| p.R198I | COAD | 1 |
| p.R260K | CESC | 1 |
| p.P200H | LUAD | 1 |
| p.N256S | LIHC | 1 |
| p.E281K | UCS | 1 |
| p.K45R | OV | 1 |
| p.E326K | SKCM | 1 |
| p.S119F | BLCA | 1 |
| p.L333M | STAD | 1 |
| p.R52G | GBM | 1 |
| p.G261R | COAD | 1 |
| p.R270K | SKCM | 1 |
| p.P420H | THYM | 1 |
| p.P175H | LUAD | 1 |
| p.T10A | UCEC | 1 |
| p.D70Y | LUAD | 1 |
| p.R32H | COAD | 1 |
| p.R270I | BLCA | 1 |
| p.F382L | LUAD | 1 |
| p.D16N | PRAD | 1 |
| p.P31L | DLBC | 1 |
| p.L169H | MESO | 1 |
| p.Q197H | CESC | 1 |
| p.P175H | SARC | 1 |
| p.I167V | BLCA | 1 |
| p.R362C | DLBC | 1 |
| p.T99A | BRCA | 1 |
| p.L372M | COAD | 1 |
| p.S65R | SKCM | 1 |
| p.P178H | LUAD | 1 |
| p.R316H | CESC | 1 |
| p.P294L | SKCM | 1 |
| p.P185T | THYM | 1 |
| p.T127R | SARC | 1 |
| Top |
| TissGeneCNV for CLNK |
| Copy number variations of TissGene across 28 cancer types (X-axis: cancer type and Y-axis: % of CNV samples) (TCGA Gistic2_CopyNumber_Gistic2_all_data_by_genes, Gistic2 copy number data, version 2016-08-16) |
 |
| Top |
| TissGeneFusions for CLNK |
| Fusion genes including TissGene (ChimerDB 3.0, 2016-12-01 and TCGA fusion Portal 2015-12-01) |
| Database | Src | Cancer type | Sample | Fusion gene | ORF | 5'-gene BP | 3'-gene BP |
| Chimerdb3.0 | ChiTaRs | NA | BE698729 | CLNK-CCT4 | chr4:10602096 | chr2:62095716 | |
| Chimerdb3.0 | ChiTaRs | NA | AA225642 | C1orf116-CLNK | chr1:207195372 | chr4:10660219 |
| Top |
| TissGeneNet for CLNK |
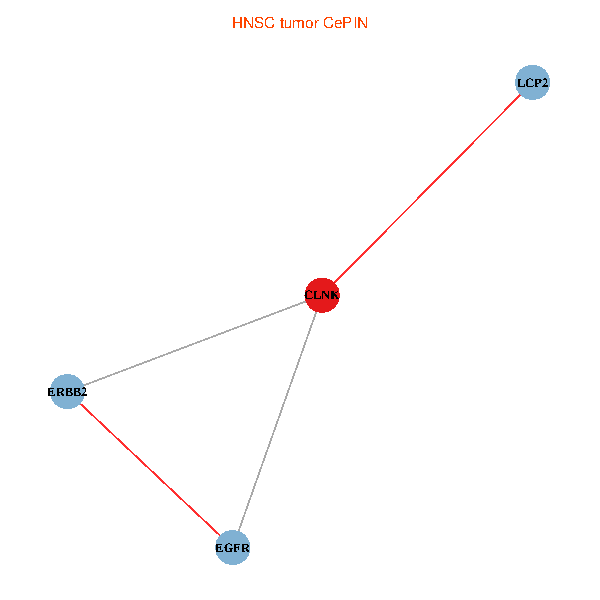
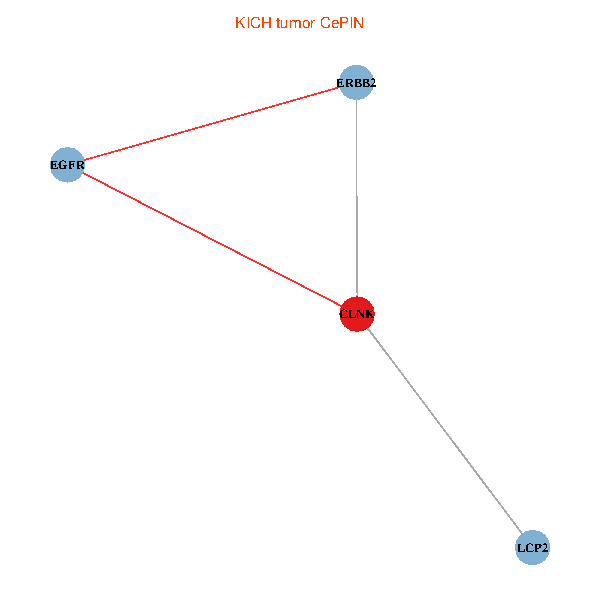
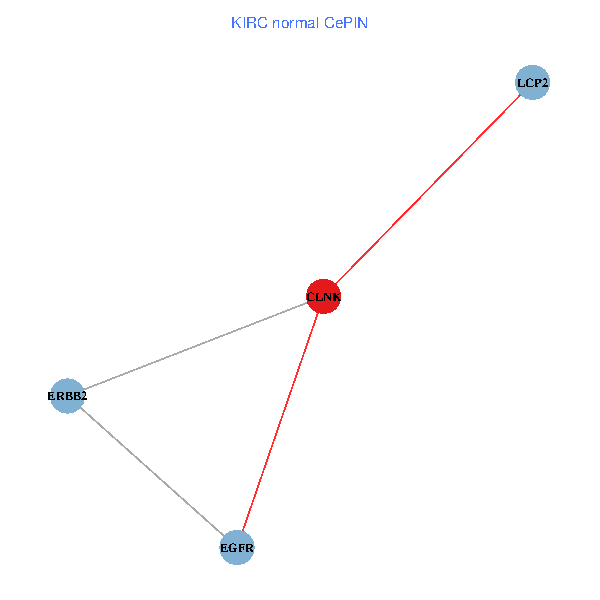
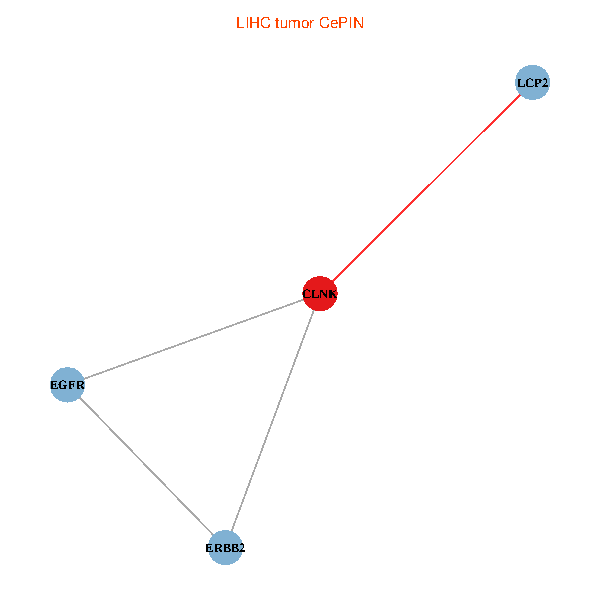
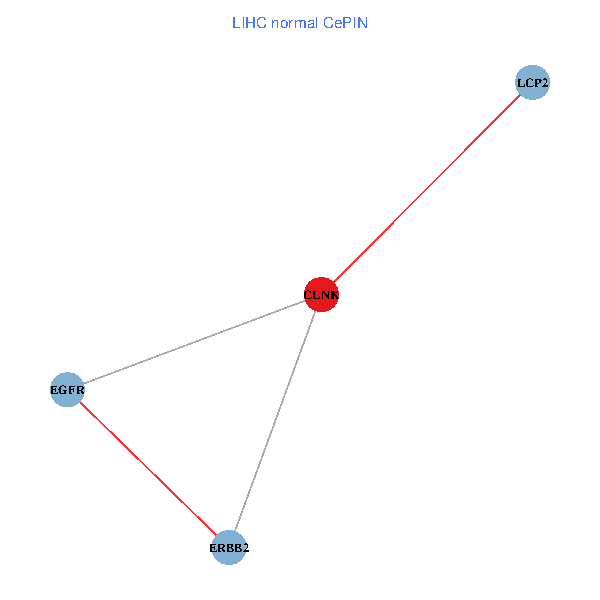
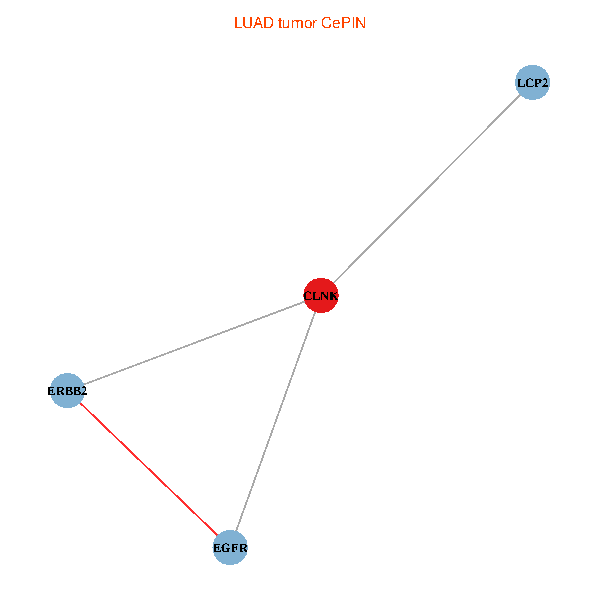
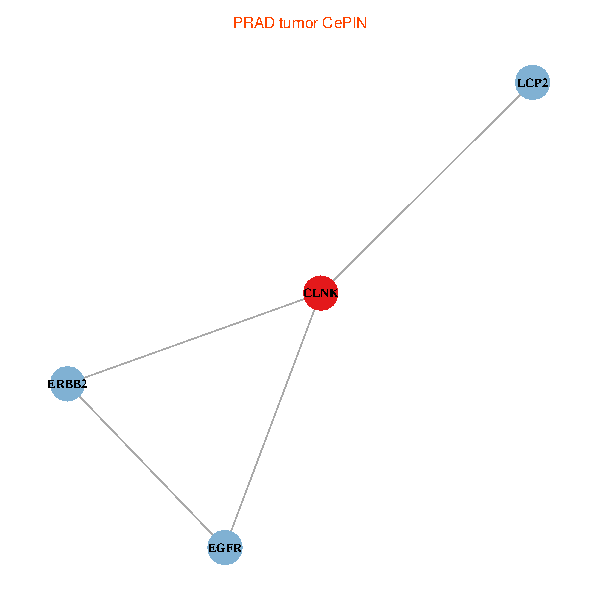
| Co-expressed gene networks based on protein-protein interaction data (CePIN) (TCGA IlluminaHiSeq_RNASeqV2, pan-cancer normalized log2(norm_counts+1) data, version 2016-08-16) (PINA2 ppi data) |
| BRCA (tumor) | BRCA (normal) |
| CLNK, ERBB2, LCP2, EGFR (tumor) | CLNK, ERBB2, LCP2, EGFR (normal) |
 |  |
| COAD (tumor) | COAD (normal) |
| CLNK, ERBB2, LCP2, EGFR (tumor) | CLNK, ERBB2, LCP2, EGFR (normal) |
 |  |
| HNSC (tumor) | HNSC (normal) |
| CLNK, ERBB2, LCP2, EGFR (tumor) | CLNK, ERBB2, LCP2, EGFR (normal) |
 |  |
| KICH (tumor) | KICH (normal) |
| CLNK, ERBB2, LCP2, EGFR (tumor) | CLNK, ERBB2, LCP2, EGFR (normal) |
 |  |
| KIRC (tumor) | KIRC (normal) |
| CLNK, ERBB2, LCP2, EGFR (tumor) | CLNK, ERBB2, LCP2, EGFR (normal) |
 |  |
| KIRP (tumor) | KIRP (normal) |
| CLNK, ERBB2, LCP2, EGFR (tumor) | CLNK, ERBB2, LCP2, EGFR (normal) |
 |  |
| LIHC (tumor) | LIHC (normal) |
| CLNK, ERBB2, LCP2, EGFR (tumor) | CLNK, ERBB2, LCP2, EGFR (normal) |
 |  |
| LUAD (tumor) | LUAD (normal) |
| CLNK, ERBB2, LCP2, EGFR (tumor) | CLNK, ERBB2, LCP2, EGFR (normal) |
 |  |
| LUSC (tumor) | LUSC (normal) |
| CLNK, ERBB2, LCP2, EGFR (tumor) | CLNK, ERBB2, LCP2, EGFR (normal) |
 |  |
| PRAD (tumor) | PRAD (normal) |
| CLNK, ERBB2, LCP2, EGFR (tumor) | CLNK, ERBB2, LCP2, EGFR (normal) |
 |  |
| STAD (tumor) | STAD (normal) |
| CLNK, ERBB2, LCP2, EGFR (tumor) | CLNK, ERBB2, LCP2, EGFR (normal) |
 |  |
| THCA (tumor) | THCA (normal) |
| CLNK, ERBB2, LCP2, EGFR (tumor) | CLNK, ERBB2, LCP2, EGFR (normal) |
 |  |
| Top |
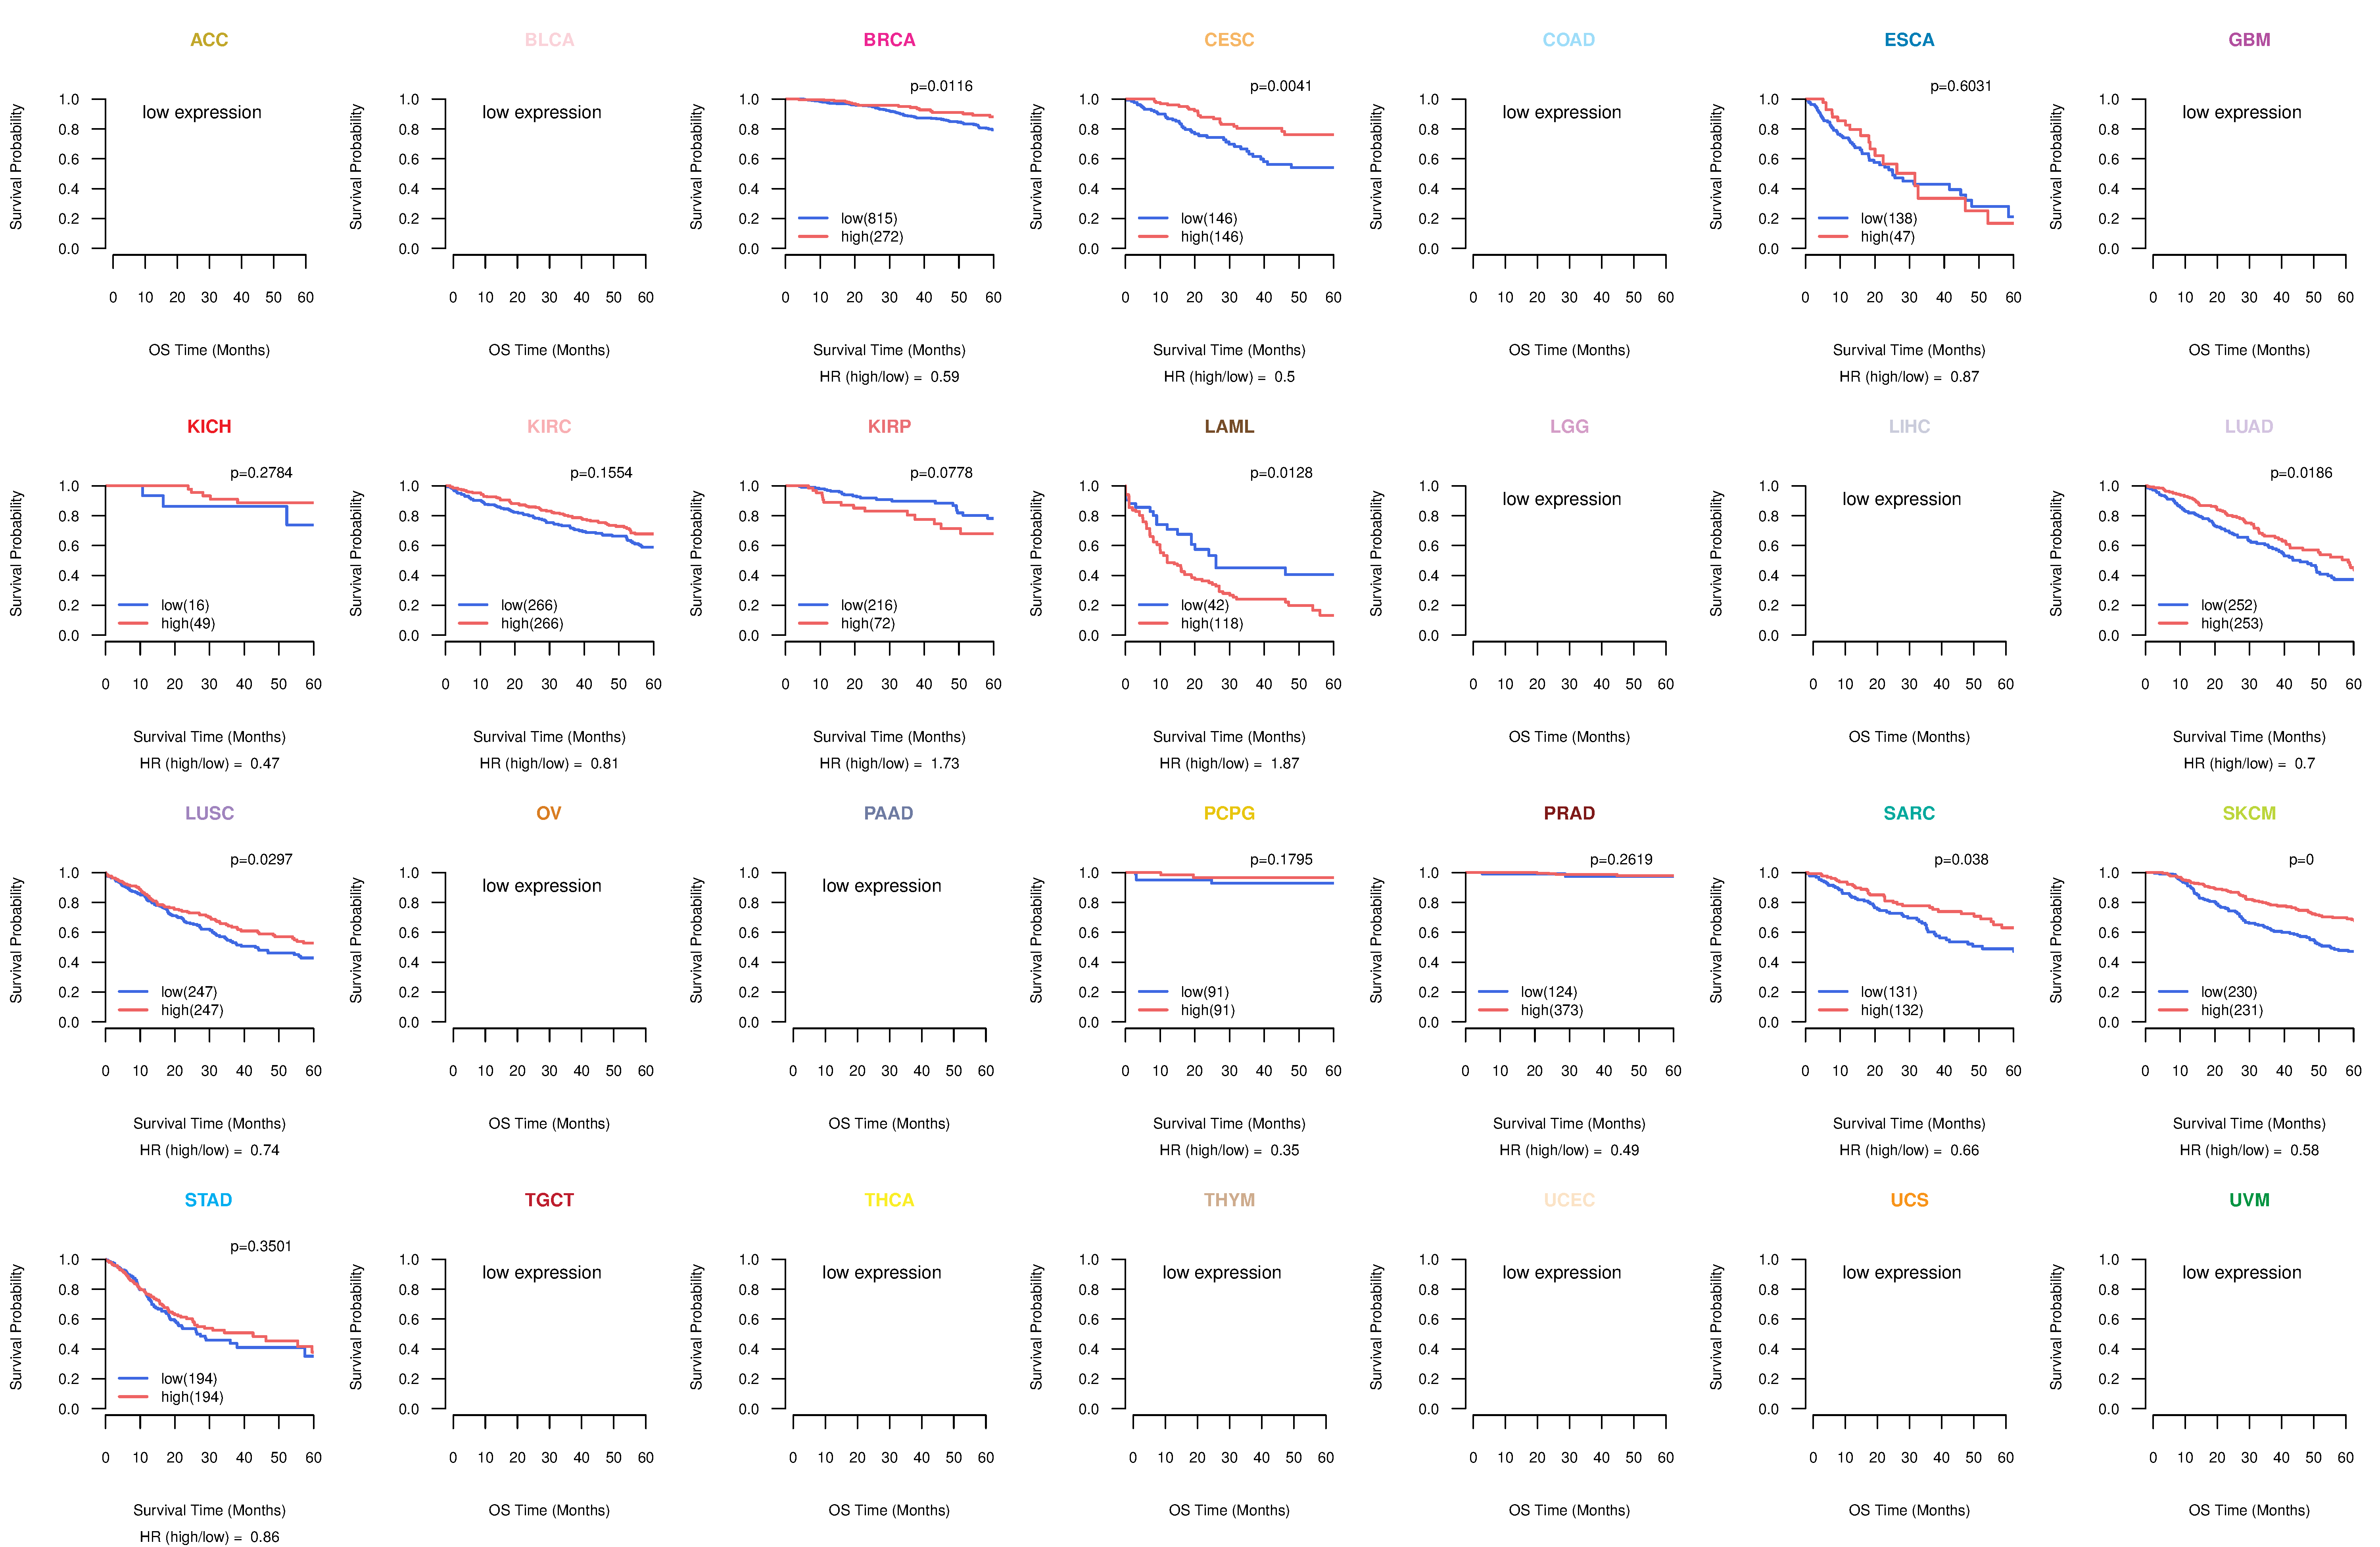
| TissGeneProg for CLNK |
| Kaplan-Meier plots with logrank tests of overall survival (OS) using 28 cancer types (TCGA IlluminaHiSeq_RNASeqV2, pan-cancer normalized log2(norm_counts+1) data, version 2016-08-16) (TCGA clinicalMatrix, phenotype data, version 2016-04-27) * Click on the image to enlarge it in a new window. |
 |
| Kaplan-Meier plots with logrank test of relapse free survival (RFS) using 28 cancer types (TCGA IlluminaHiSeq_RNASeqV2, pan-cancer normalized log2(norm_counts+1) data, version 2016-08-16) (TCGA clinicalMatrix, phenotype data, version 2016-04-27) * Click on the image enlarge it in a new window. |
 |
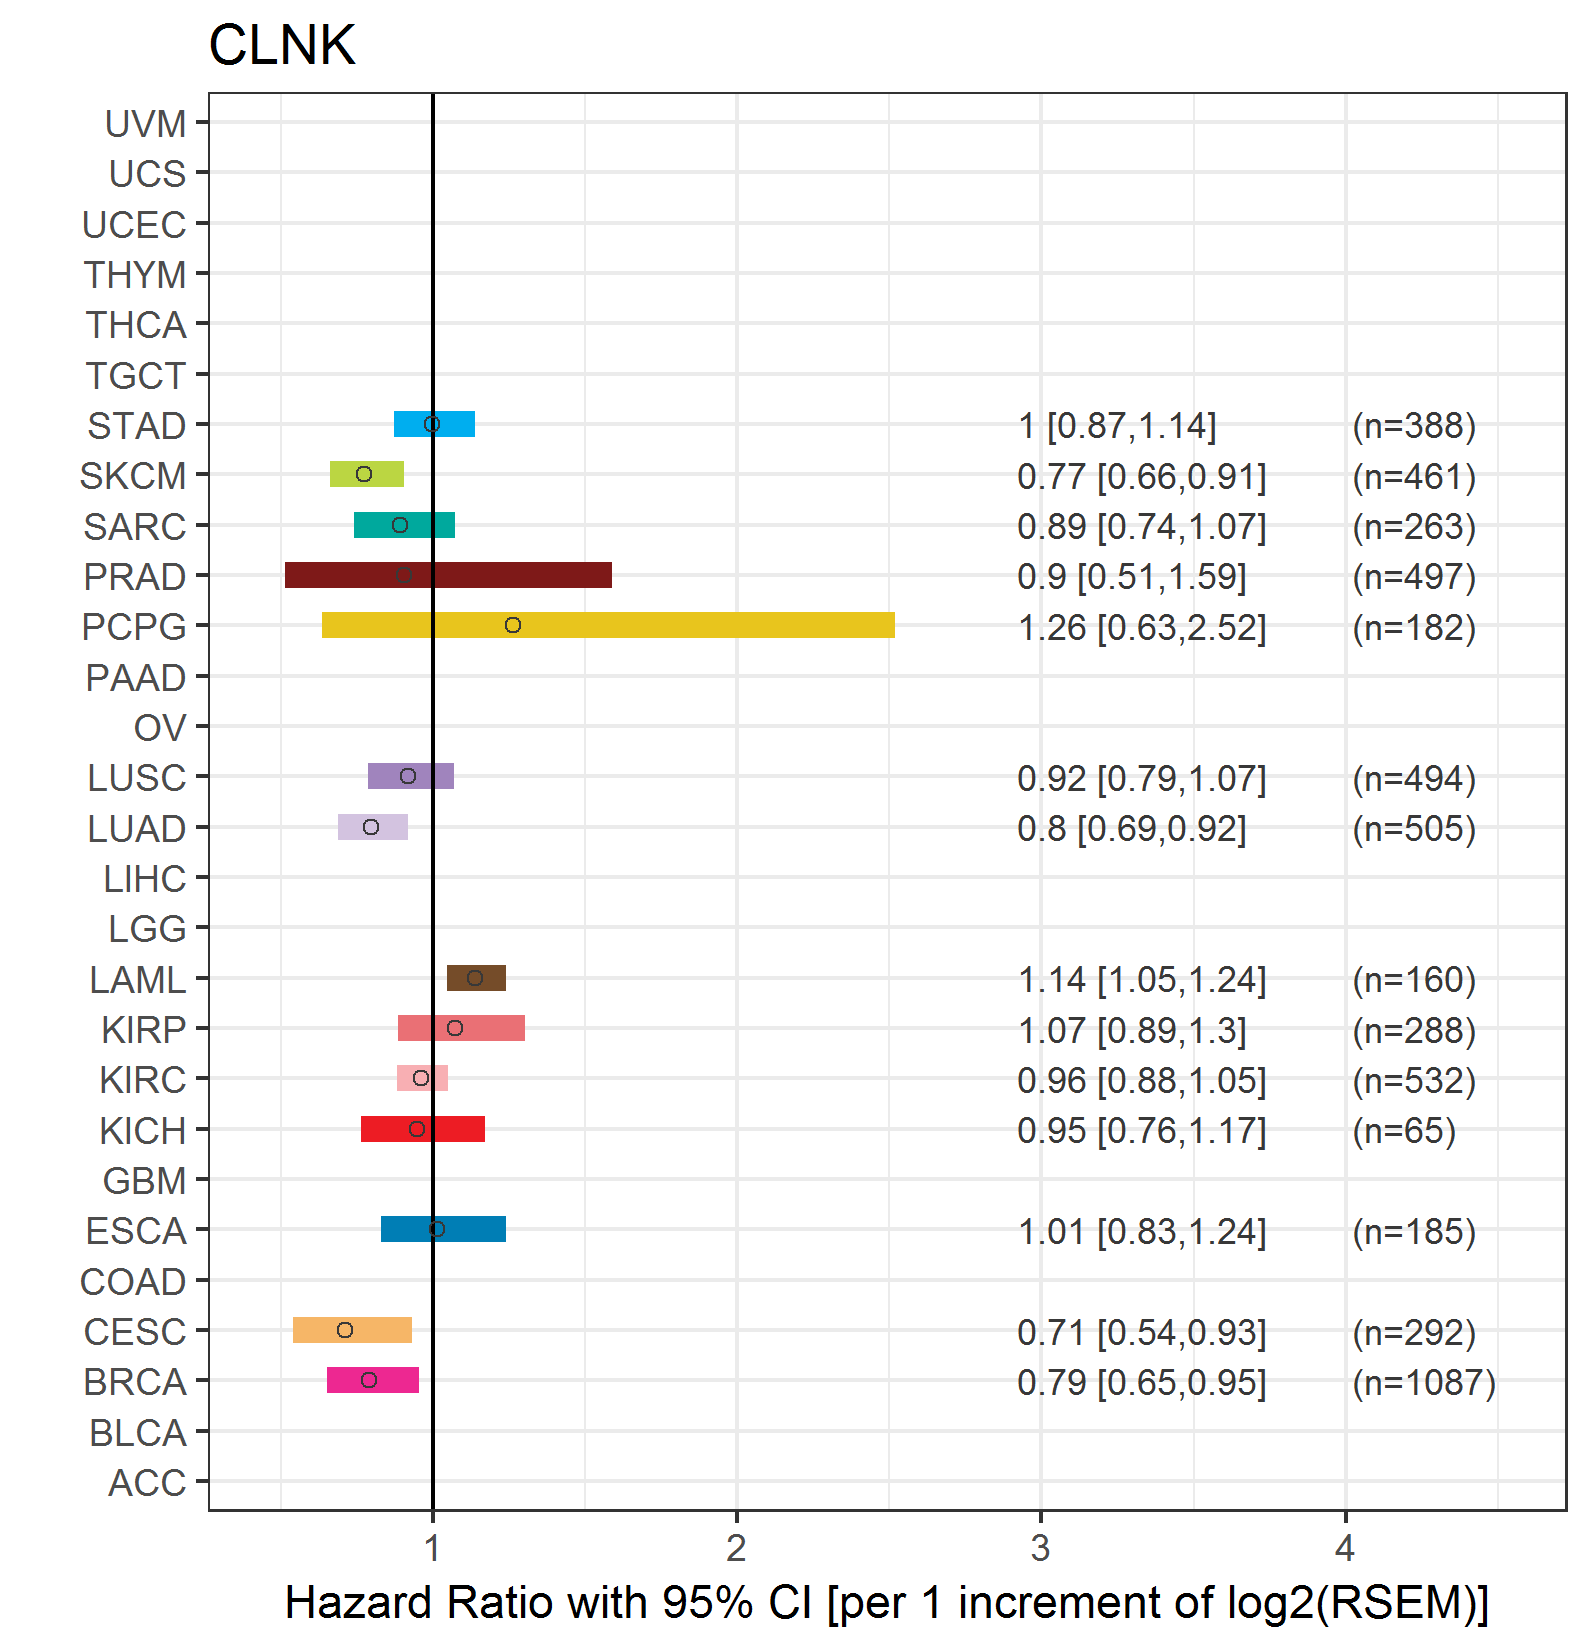
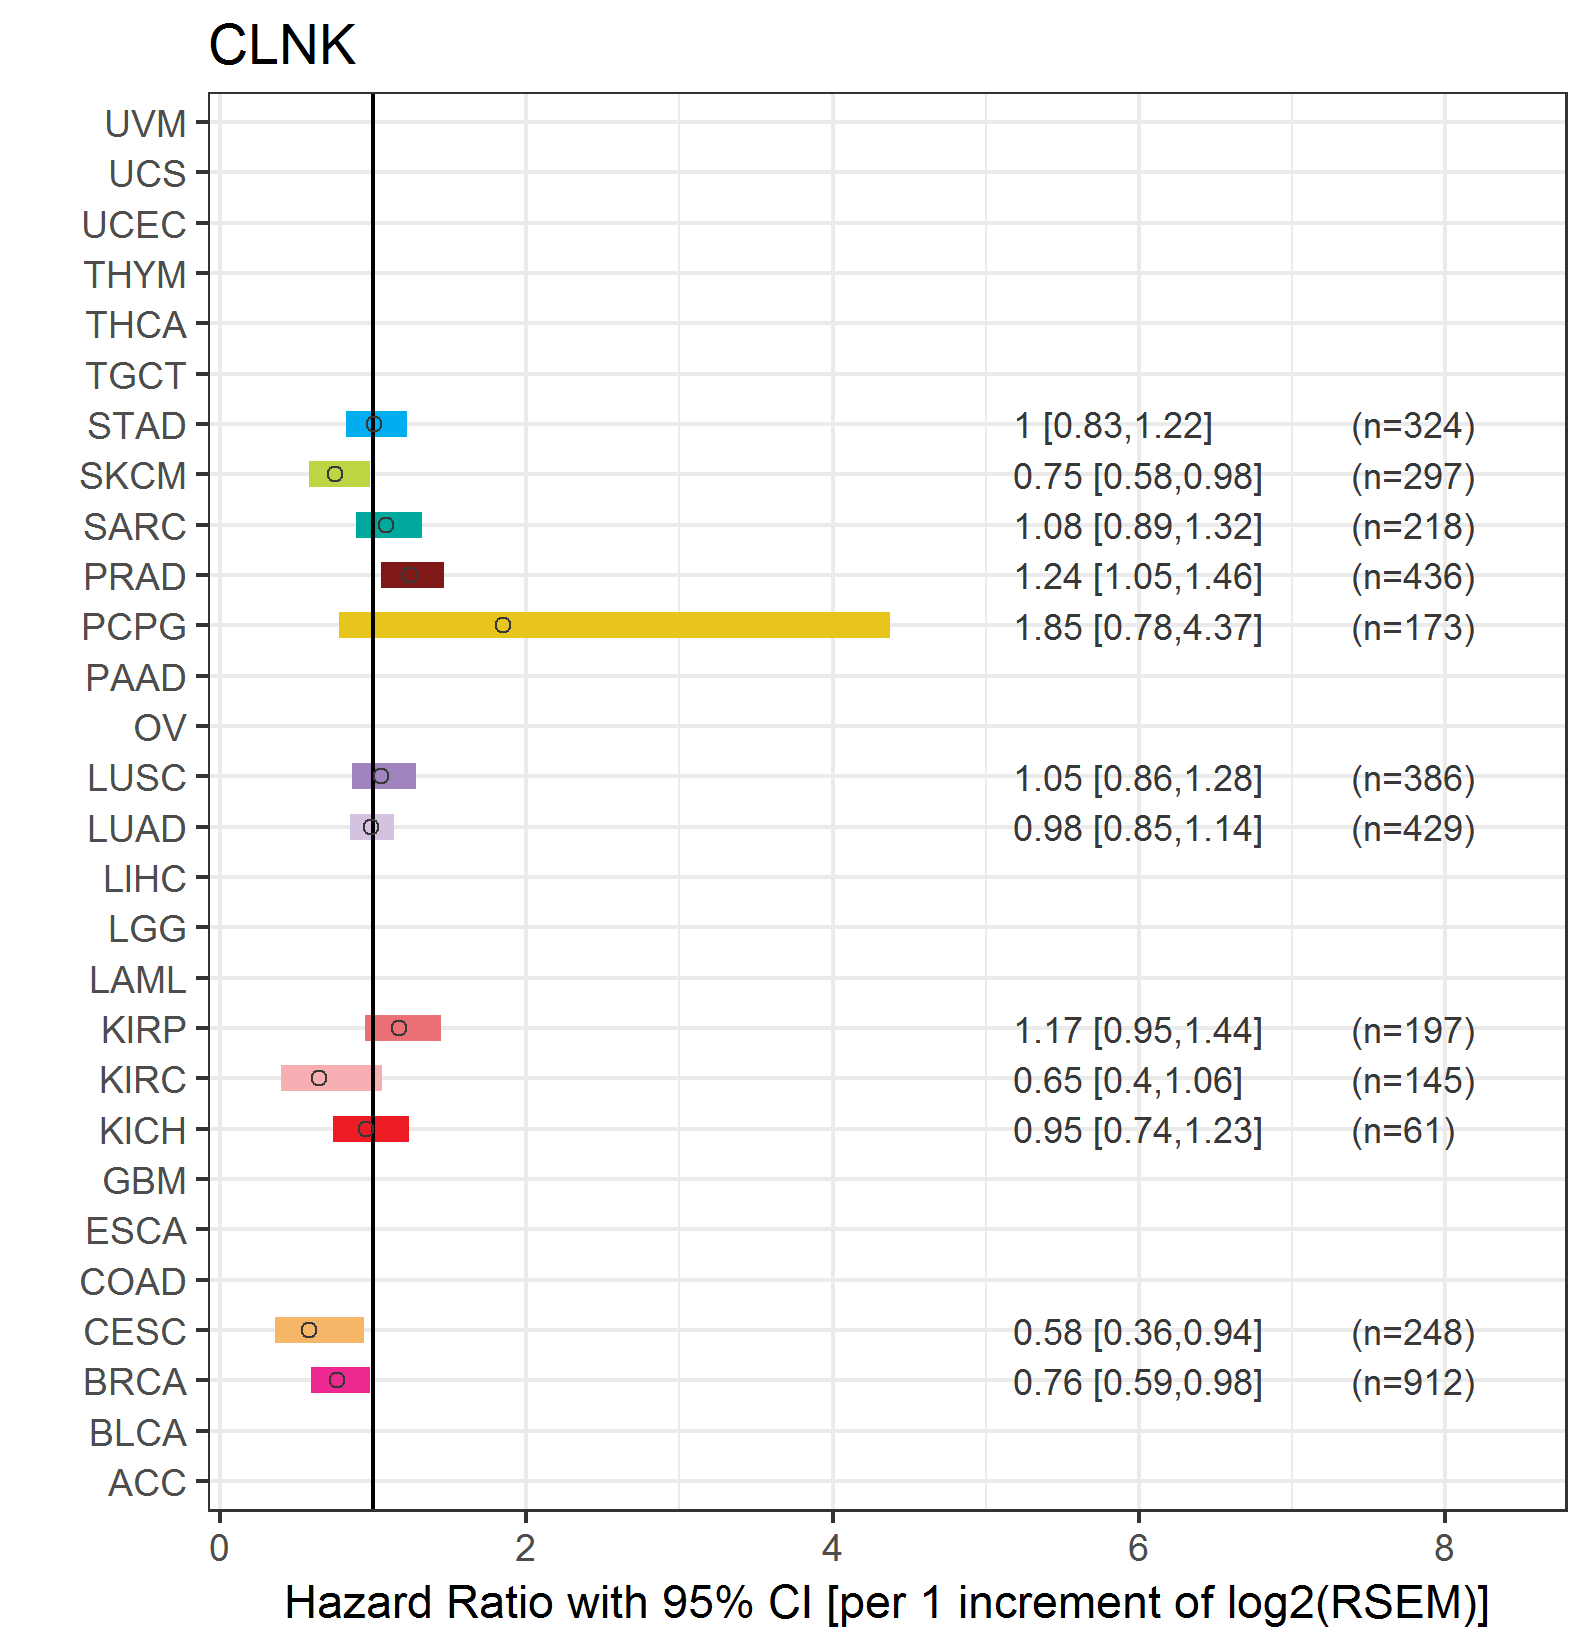
| Forest plot of Cox proportional hazard ratio (HR) and 95% CI of overall survival (OS) using 28 cancer types (TCGA IlluminaHiSeq_RNASeqV2, pan-cancer normalized log2(norm_counts+1) data, version 2016-08-16) (TCGA clinicalMatrix, phenotype data, version 2016-04-27) * Click on the image enlarge it in a new window. |
 |
| Forest plot of Cox proportional hazard ratio (HR) and 95% CI of relapse free survival (RFS) using 28 cancer types (TCGA IlluminaHiSeq_RNASeqV2, pan-cancer normalized log2(norm_counts+1) data, version 2016-08-16) (TCGA clinicalMatrix, phenotype data, version 2016-04-27) * Click on the image enlarge it in a new window. |
 |
| Top |
| TissGeneClin for CLNK |
| TissGeneDrug for CLNK |
| Drug information targeting TissGene (DrugBank Version 5.0.6, 2017-04-01) |
| DrugBank ID | Drug name | Drug activity | Drug type | Drug status |
| Top |
| TissGeneDisease for CLNK |
| Disease information associated with TissGene (DisGeNet, 2016-06-01) |
| Disease ID | Disease name | # pubmeds | Source |
| umls:C0002736 | Amyotrophic Lateral Sclerosis | 2 | GAD |
| umls:C0023890 | Liver Cirrhosis | 1 | BeFree |
| umls:C0023895 | Liver diseases | 1 | BeFree |
| umls:C0042900 | Vitiligo | 1 | CTD_human |
| umls:C1623038 | Cirrhosis | 1 | BeFree |
|
Copyright 2016-Present - The University of Texas Health Science Center at Houston (UTHealth) Web File Viewing | How to Report, Fraud, Waste and Abuse | State of Texas | Statewide Search | Texas Homeland Security | Site Policies |