 |
| |
| |
| |
| |
| |
| |
|

| TissGeneSummary for TDRD9 |
 Gene summary Gene summary |
| Basic gene information | Gene symbol | TDRD9 |
| Gene name | tudor domain containing 9 | |
| Synonyms | C14orf75|HIG-1|NET54 | |
| Cytomap | UCSC genome browser: 14q32.33 | |
| Type of gene | protein-coding | |
| RefGenes | NM_153046.2, | |
| Description | hypoxia-inducible HIG-1putative ATP-dependent RNA helicase TDRD9tudor domain-containing protein 9 | |
| Modification date | 20141207 | |
| dbXrefs | HGNC : HGNC | |
| Ensembl : ENSG00000156414 | ||
| HPRD : 15484 | ||
| Vega : OTTHUMG00000152876 | ||
| Protein | UniProt: go to UniProt's Cross Reference DB Table | |
| Expression | CleanEX: HS_TDRD9 | |
| BioGPS: 122402 | ||
| Pathway | NCI Pathway Interaction Database: TDRD9 | |
| KEGG: TDRD9 | ||
| REACTOME: TDRD9 | ||
| Pathway Commons: TDRD9 | ||
| Context | iHOP: TDRD9 | |
| ligand binding site mutation search in PubMed: TDRD9 | ||
| UCL Cancer Institute: TDRD9 | ||
| Assigned class in TissGDB* | C | |
| Included tissue-specific gene expression resources | TiGER,GTEx | |
| Specific-tissues in normal samples (assigned by TissGDB using HPA, TiGER, and GTEx) | PancreasTestis | |
| Cancer types related to the specific-tissues in cancer samples (assigned by TissGDB using TCGA) | PAADTGCT | |
| Reference showing the relevant tissue of TDRD9 | ||
| Description by TissGene annotations | ||
| * Class A consists of genes with literature evidence and is part of the cTissGenes. Class B consists of only cTissGenes without additional evidence. The remaining genes belong to Class C. |
| Gene ontology having evidence of Inferred from Direct Assay (IDA) from Entrez |
| GO ID | GO term | PubMed ID |
| Top |
| TissGeneExp for TDRD9 |
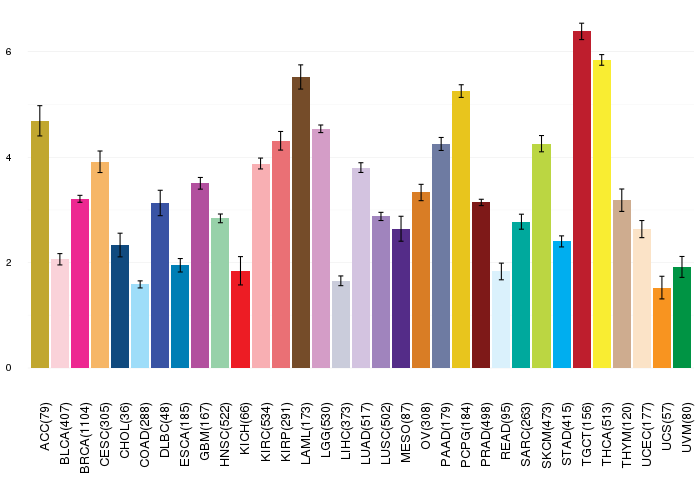
| Gene expressions across 28 cancer types (X-axis: cancer type and Y-axis: log2(norm_counts+1)) (TCGA IlluminaHiSeq_RNASeqV2, pan-cancer normalized log2(norm_counts+1) data, version 2016-08-16) |
 |
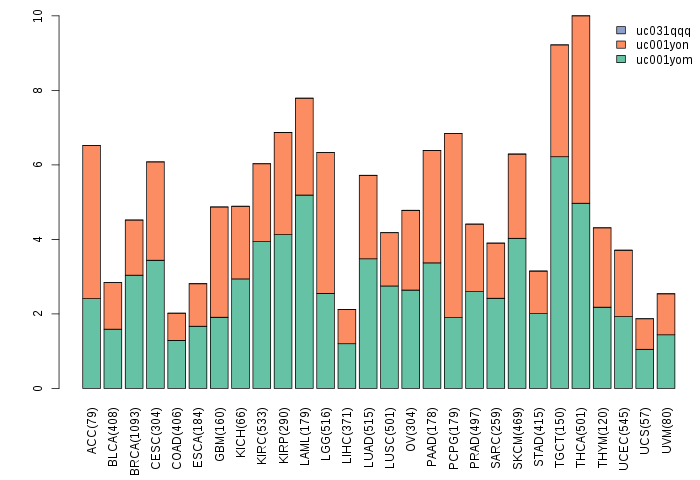
| Gene isoform expressions across 28 cancer types (X-axis: cancer type and Y-axis: log2(norm_counts+1)) (TCGA pan-cancer tcga_rsem_isoform_tpm, version 2016-09-01) |
 |
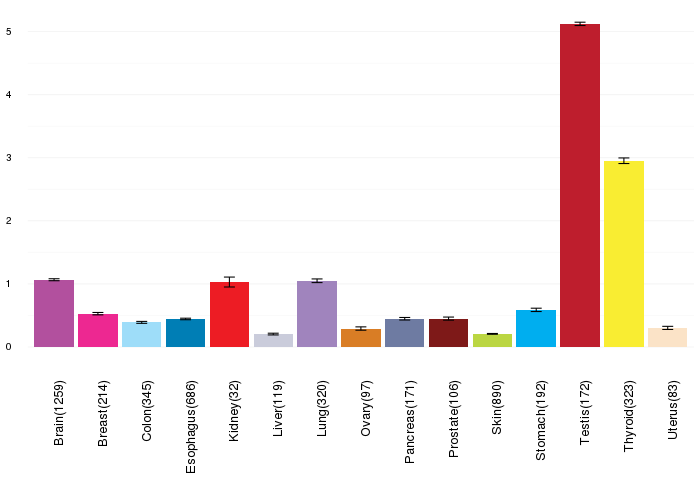
| Gene expressions across normal tissues of GTEx data (GTEx GTEx_Analysis_v6_RNA-seq_RNA-SeQCv1.1.8_gene_rpkm.gct) - Here, we shows the matched tissue types only among our 28 cancer types. |
 |
| Different expressions across 14 cancer types with more than 10 samples between matched tumors and normals (X-axis: cancer type and Y-axis: log2(norm_counts+1)) (TCGA IlluminaHiSeq_RNASeqV2, pan-cancer normalized log2(norm_counts+1) data, version 2016-08-16) |
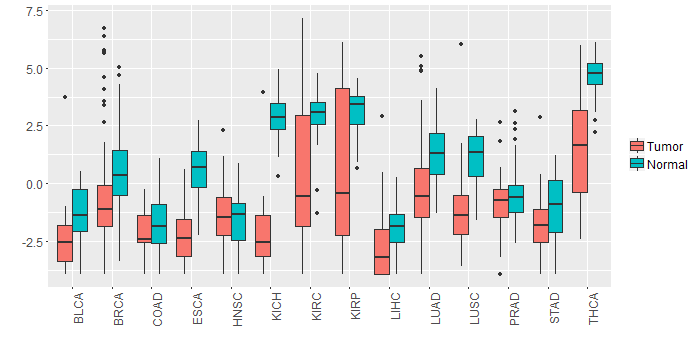 |
| - Significantly differentially expressed cancer types and information. (|Fold change|>1 and FDR<0.05) |
| Cancer type | Mean(exp) in tumor | Mean(exp) in matched normal | Log2FC | P-val. | FDR |
| KICH | -2.257333275 | 2.894494725 | -5.151828 | 2.55E-16 | 7.40E-15 |
| BRCA | -0.564281065 | 0.508532971 | -1.072814035 | 1.79E-05 | 4.33E-05 |
| KIRC | 0.410225003 | 3.026426392 | -2.616201389 | 6.65E-12 | 2.63E-11 |
| LUAD | -0.178118723 | 1.372084725 | -1.550203448 | 7.56E-06 | 2.25E-05 |
| LUSC | -1.046243706 | 1.191730803 | -2.23797451 | 4.63E-12 | 2.01E-11 |
| THCA | 1.562488962 | 4.691409301 | -3.128920339 | 1.27E-15 | 1.80E-14 |
| ESCA | -2.14101073 | 0.51468927 | -2.6557 | 0.000581 | 0.010120062 |
| KIRP | 0.88850035 | 3.107259725 | -2.218759375 | 0.00122 | 0.003287548 |
| Top |
| TissGene-miRNA for TDRD9 |
| Significantly anti-correlated miRNAs of TissGene across 28 cancer types (Gene-miRNA relations from TargetScanHuman Relsease 7.1, Conserved_Site_Context_Scores.txt.zip, 06.01.2016) (TCGA IlluminaHiSeq_miRNASeq, log2(RPM+1) data, version 2016-11-21) (TCGA IlluminaHiSeq_RNASeqV2, log2(normalized_count+1) data, version 2016-08-16) (Spearman’s Rank Correlation (p-value<0.05 and coefficient<-0.25)) |
| Cancer type | miRNA id | miRNA accession | P-val. | Coeff. | # samples |
| Top |
| TissGeneMut for TDRD9 |
| TissGeneSNV for TDRD9 |
| nsSNV counts per each loci. Different colors of circles represent different cancer types. Circle size denotes number of samples. (TCGA somatic mutation (SNPs and small INDELs) data, version 2016-04-25) * Click on the image to enlarge it in a new window. |
 |
 |
| Somatic nucleotide variants of TissGene across 28 cancer types (X-axis: cancer type and Y-axis: % of mutated samples) The numbers in parentheses are numbers of samples with mutation (nsSNVs). (TCGA somatic mutation (SNPs and small INDELs) data, version 2016-04-25) |
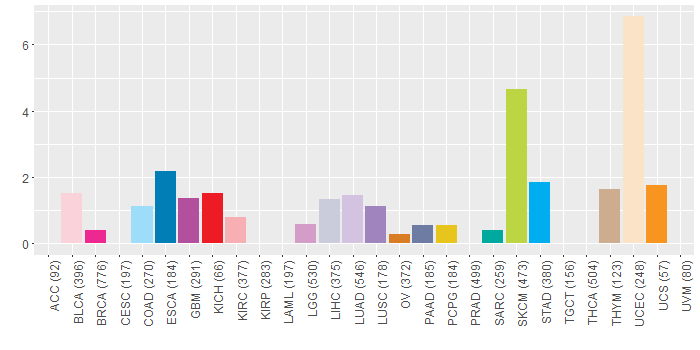 |
| - nsSNVs sorted by frequency. |
| AAchange | Cancer type | # samples |
| p.R699I | UCEC | 2 |
| p.E844K | COAD | 1 |
| p.T878M | LGG | 1 |
| p.V1172I | COAD | 1 |
| p.P166Q | ESCA | 1 |
| p.V1050I | SKCM | 1 |
| p.D1269N | BRCA | 1 |
| p.L465F | BLCA | 1 |
| p.D959Y | SKCM | 1 |
| p.R725* | GBM | 1 |
| p.L1046F | SKCM | 1 |
| p.L630P | STAD | 1 |
| p.P346L | LUAD | 1 |
| p.P772L | SKCM | 1 |
| p.L591F | UCEC | 1 |
| p.P881S | SKCM | 1 |
| p.D520N | SKCM | 1 |
| p.T826I | LIHC | 1 |
| p.W914G | UCS | 1 |
| p.T878K | SKCM | 1 |
| p.H1055Y | LUAD | 1 |
| p.W484L | KIRC | 1 |
| p.R528C | CHOL | 1 |
| p.S451F | ESCA | 1 |
| p.Q605E | LUSC | 1 |
| p.V665A | PCPG | 1 |
| p.L795P | BRCA | 1 |
| p.V1077I | UCEC | 1 |
| p.S842L | BLCA | 1 |
| p.G915E | SKCM | 1 |
| p.E590D | BLCA | 1 |
| p.A1033V | UCEC | 1 |
| p.E1346K | SKCM | 1 |
| p.D1275N | READ | 1 |
| p.M638I | PAAD | 1 |
| p.D771G | UCEC | 1 |
| p.G911* | LUAD | 1 |
| p.E344K | SKCM | 1 |
| p.I733T | STAD | 1 |
| p.P942S | BRCA | 1 |
| p.S1093P | GBM | 1 |
| p.F1370C | SKCM | 1 |
| p.V862I | GBM | 1 |
| p.G394V | LIHC | 1 |
| p.A1319V | STAD | 1 |
| p.L787I | STAD | 1 |
| p.T349N | UCEC | 1 |
| p.H1161Y | SARC | 1 |
| p.S555Y | SKCM | 1 |
| p.R176C | KICH | 1 |
| p.G785R | SKCM | 1 |
| p.L710S | UCEC | 1 |
| p.P954L | LGG | 1 |
| p.A485S | UCEC | 1 |
| p.R1290S | LUAD | 1 |
| p.D645N | SKCM | 1 |
| p.C471S | UCEC | 1 |
| p.M543I | SKCM | 1 |
| p.S987Y | LGG | 1 |
| p.R496G | UCEC | 1 |
| p.R385* | ESCA | 1 |
| p.P1338S | SKCM | 1 |
| p.L1307I | LUAD | 1 |
| p.E314D | UCEC | 1 |
| p.P1018L | SKCM | 1 |
| p.R385X | ESCA | 1 |
| p.T868S | KIRC | 1 |
| p.V616A | UCEC | 1 |
| p.R737* | UCEC | 1 |
| p.M1016I | BLCA | 1 |
| p.W914* | SKCM | 1 |
| p.K1331T | UCEC | 1 |
| p.T260A | LIHC | 1 |
| p.E1285K | UCEC | 1 |
| p.R259Q | COAD | 1 |
| p.I290V | LUAD | 1 |
| p.K770X | THYM | 1 |
| p.R564H | UCEC | 1 |
| p.L482F | BLCA | 1 |
| p.P546Q | LUAD | 1 |
| p.A667T | UCEC | 1 |
| p.R823I | UCEC | 1 |
| p.L1078F | SKCM | 1 |
| p.G544S | SKCM | 1 |
| p.R818L | UCEC | 1 |
| p.R528C | UCEC | 1 |
| p.D948N | COAD | 1 |
| p.L536W | SKCM | 1 |
| p.W689* | BLCA | 1 |
| p.S159G | LIHC | 1 |
| p.A812V | THYM | 1 |
| p.R725Q | STAD | 1 |
| p.E525Q | LUSC | 1 |
| p.V1276I | LIHC | 1 |
| p.H848Y | ESCA | 1 |
| p.S715L | HNSC | 1 |
| p.Q1007* | SKCM | 1 |
| p.V989A | UCEC | 1 |
| p.L601F | SKCM | 1 |
| p.C1328S | UCEC | 1 |
| p.P1338L | SKCM | 1 |
| p.V870L | LUAD | 1 |
| p.Q606* | BLCA | 1 |
| p.E1334K | SKCM | 1 |
| p.P166L | COAD | 1 |
| p.N373S | STAD | 1 |
| p.L899F | SKCM | 1 |
| p.D1269N | UCEC | 1 |
| p.H521R | HNSC | 1 |
| p.R259Q | UCEC | 1 |
| p.G396D | LGG | 1 |
| p.Q1321P | GBM | 1 |
| p.C292S | KIRC | 1 |
| p.R385* | OV | 1 |
| p.P434S | STAD | 1 |
| Top |
| TissGeneCNV for TDRD9 |
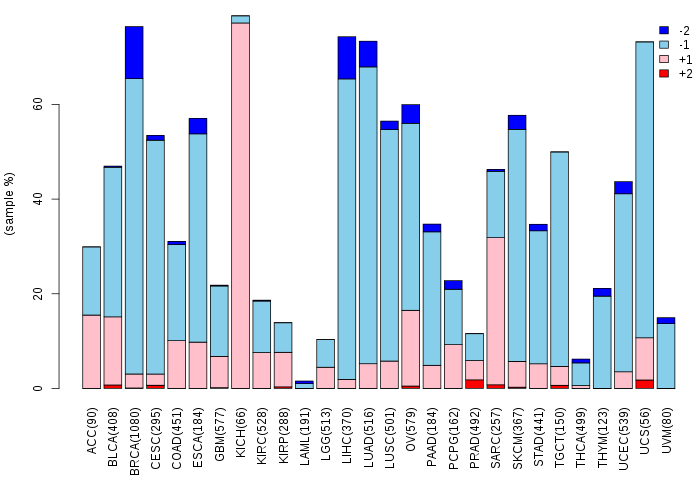
| Copy number variations of TissGene across 28 cancer types (X-axis: cancer type and Y-axis: % of CNV samples) (TCGA Gistic2_CopyNumber_Gistic2_all_data_by_genes, Gistic2 copy number data, version 2016-08-16) |
 |
| Top |
| TissGeneFusions for TDRD9 |
| Fusion genes including TissGene (ChimerDB 3.0, 2016-12-01 and TCGA fusion Portal 2015-12-01) |
| Database | Src | Cancer type | Sample | Fusion gene | ORF | 5'-gene BP | 3'-gene BP |
| Chimerdb3.0 | FusionScan | LUSC | TCGA-77-7139-01A | MARK3-TDRD9 | In-Frame | chr14:103958371 | chr14:104506532 |
| Top |
| TissGeneNet for TDRD9 |
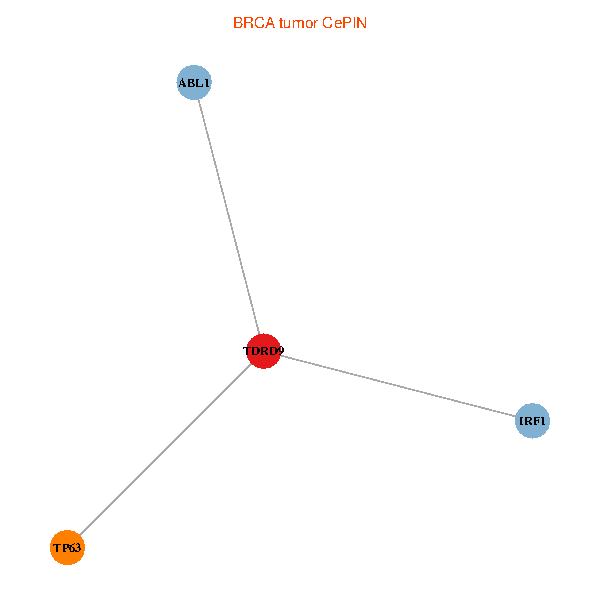
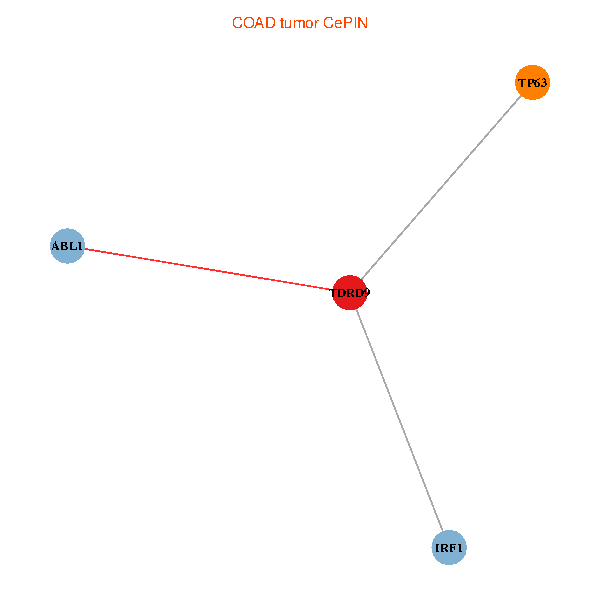
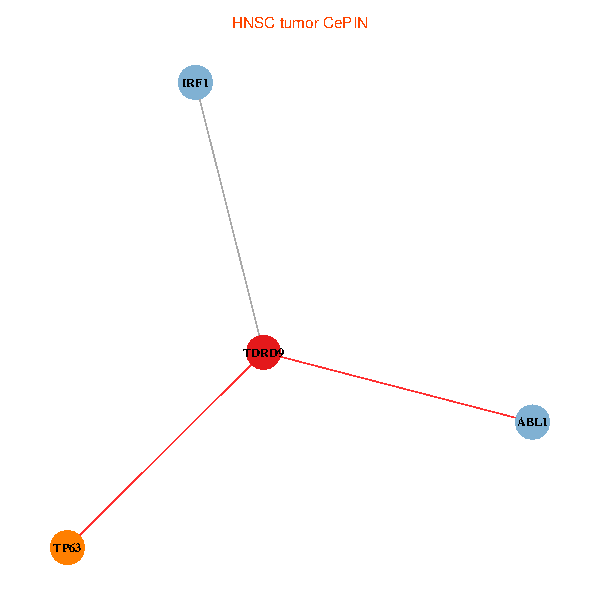
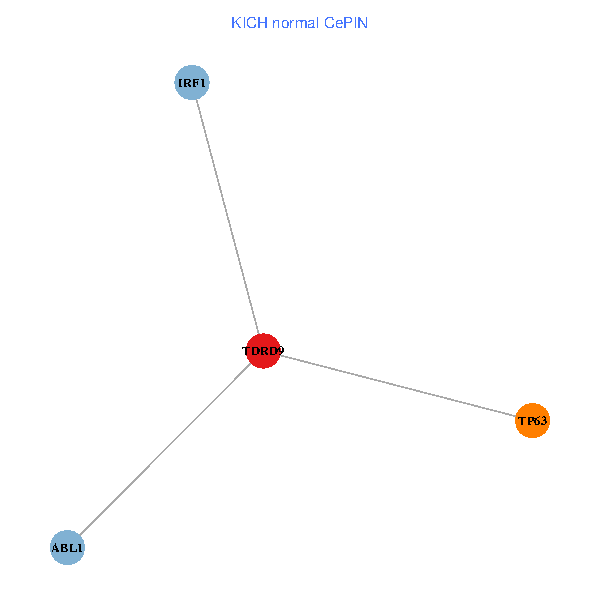
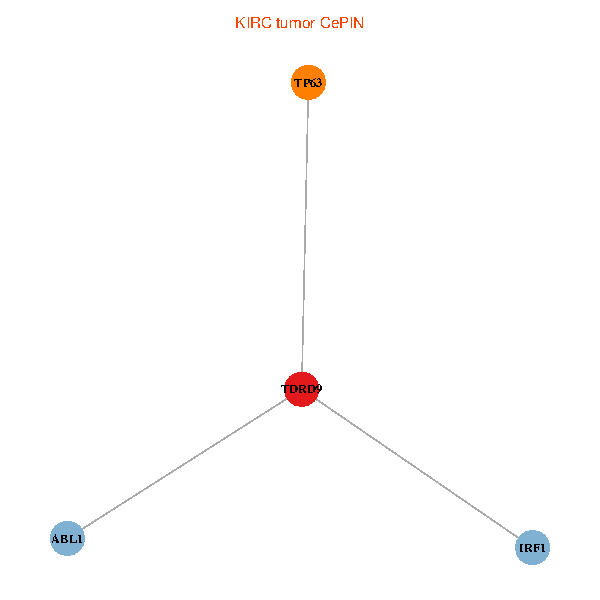
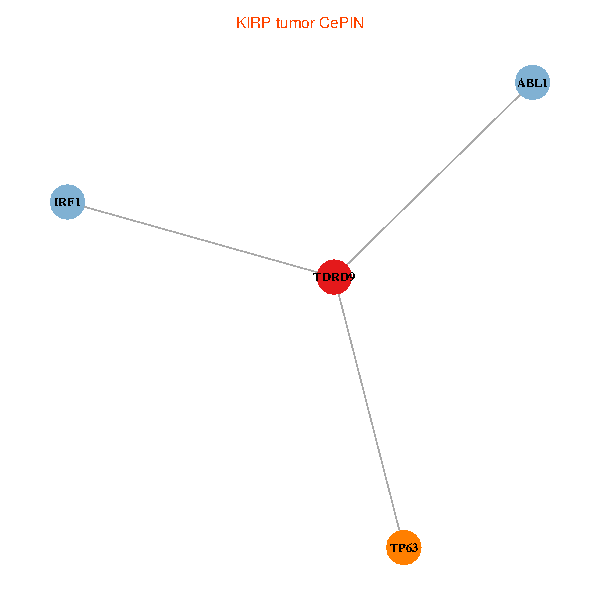
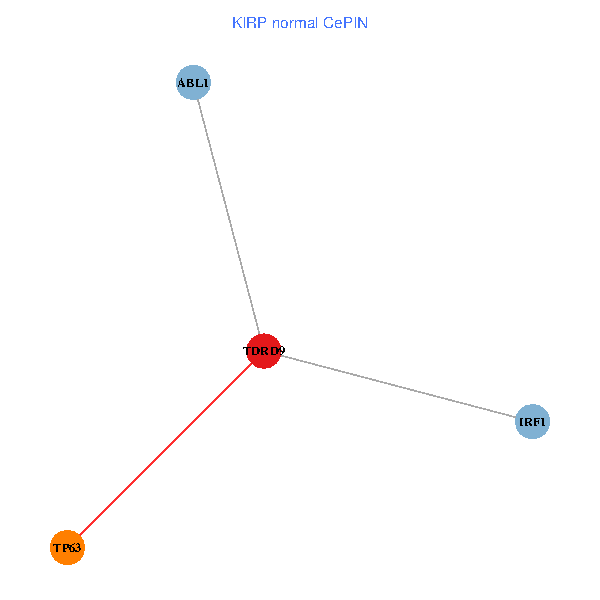
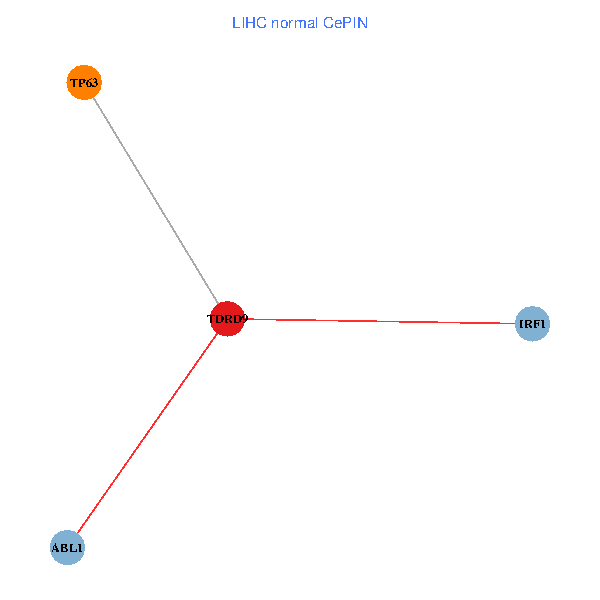
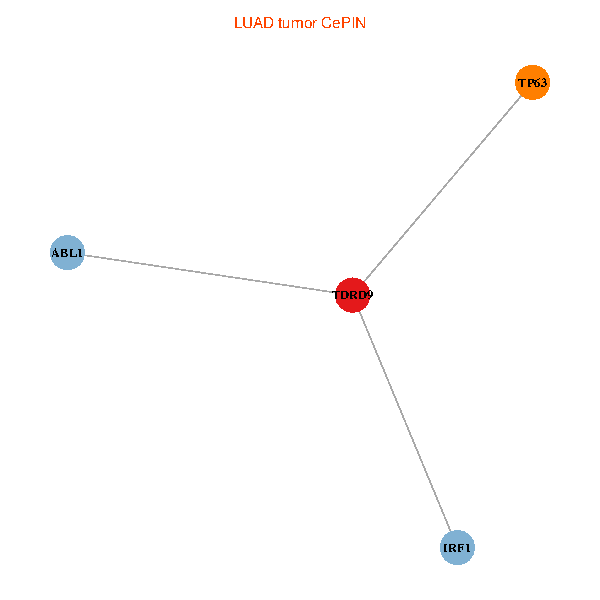
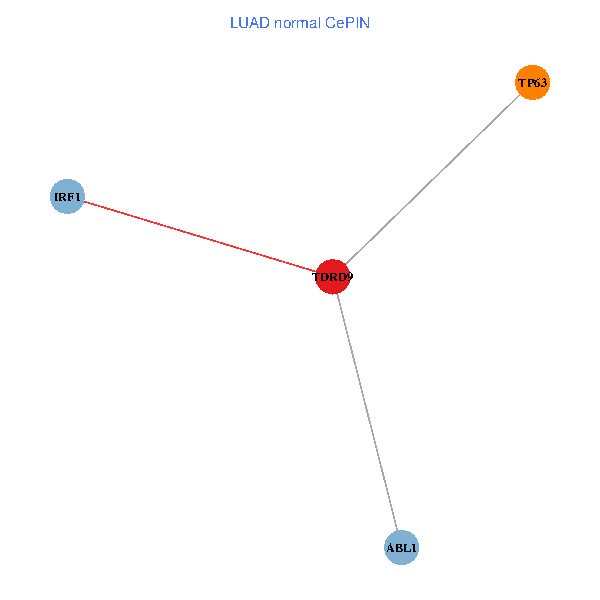
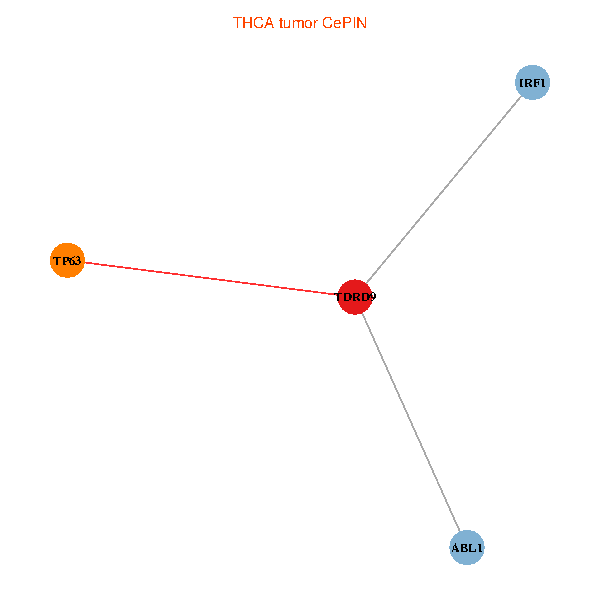
| Co-expressed gene networks based on protein-protein interaction data (CePIN) (TCGA IlluminaHiSeq_RNASeqV2, pan-cancer normalized log2(norm_counts+1) data, version 2016-08-16) (PINA2 ppi data) |
| BRCA (tumor) | BRCA (normal) |
| TDRD9, TP63, IRF1, ABL1 (tumor) | TDRD9, TP63, IRF1, ABL1 (normal) |
 |  |
| COAD (tumor) | COAD (normal) |
| TDRD9, TP63, IRF1, ABL1 (tumor) | TDRD9, TP63, IRF1, ABL1 (normal) |
 |  |
| HNSC (tumor) | HNSC (normal) |
| TDRD9, TP63, IRF1, ABL1 (tumor) | TDRD9, TP63, IRF1, ABL1 (normal) |
 |  |
| KICH (tumor) | KICH (normal) |
| TDRD9, TP63, IRF1, ABL1 (tumor) | TDRD9, TP63, IRF1, ABL1 (normal) |
 |  |
| KIRC (tumor) | KIRC (normal) |
| TDRD9, TP63, IRF1, ABL1 (tumor) | TDRD9, TP63, IRF1, ABL1 (normal) |
 |  |
| KIRP (tumor) | KIRP (normal) |
| TDRD9, TP63, IRF1, ABL1 (tumor) | TDRD9, TP63, IRF1, ABL1 (normal) |
 |  |
| LIHC (tumor) | LIHC (normal) |
| TDRD9, TP63, IRF1, ABL1 (tumor) | TDRD9, TP63, IRF1, ABL1 (normal) |
 |  |
| LUAD (tumor) | LUAD (normal) |
| TDRD9, TP63, IRF1, ABL1 (tumor) | TDRD9, TP63, IRF1, ABL1 (normal) |
 |  |
| LUSC (tumor) | LUSC (normal) |
| TDRD9, TP63, IRF1, ABL1 (tumor) | TDRD9, TP63, IRF1, ABL1 (normal) |
 |  |
| PRAD (tumor) | PRAD (normal) |
| TDRD9, TP63, IRF1, ABL1 (tumor) | TDRD9, TP63, IRF1, ABL1 (normal) |
 |  |
| STAD (tumor) | STAD (normal) |
| TDRD9, TP63, IRF1, ABL1 (tumor) | TDRD9, TP63, IRF1, ABL1 (normal) |
 |  |
| THCA (tumor) | THCA (normal) |
| TDRD9, TP63, IRF1, ABL1 (tumor) | TDRD9, TP63, IRF1, ABL1 (normal) |
 |  |
| Top |
| TissGeneProg for TDRD9 |
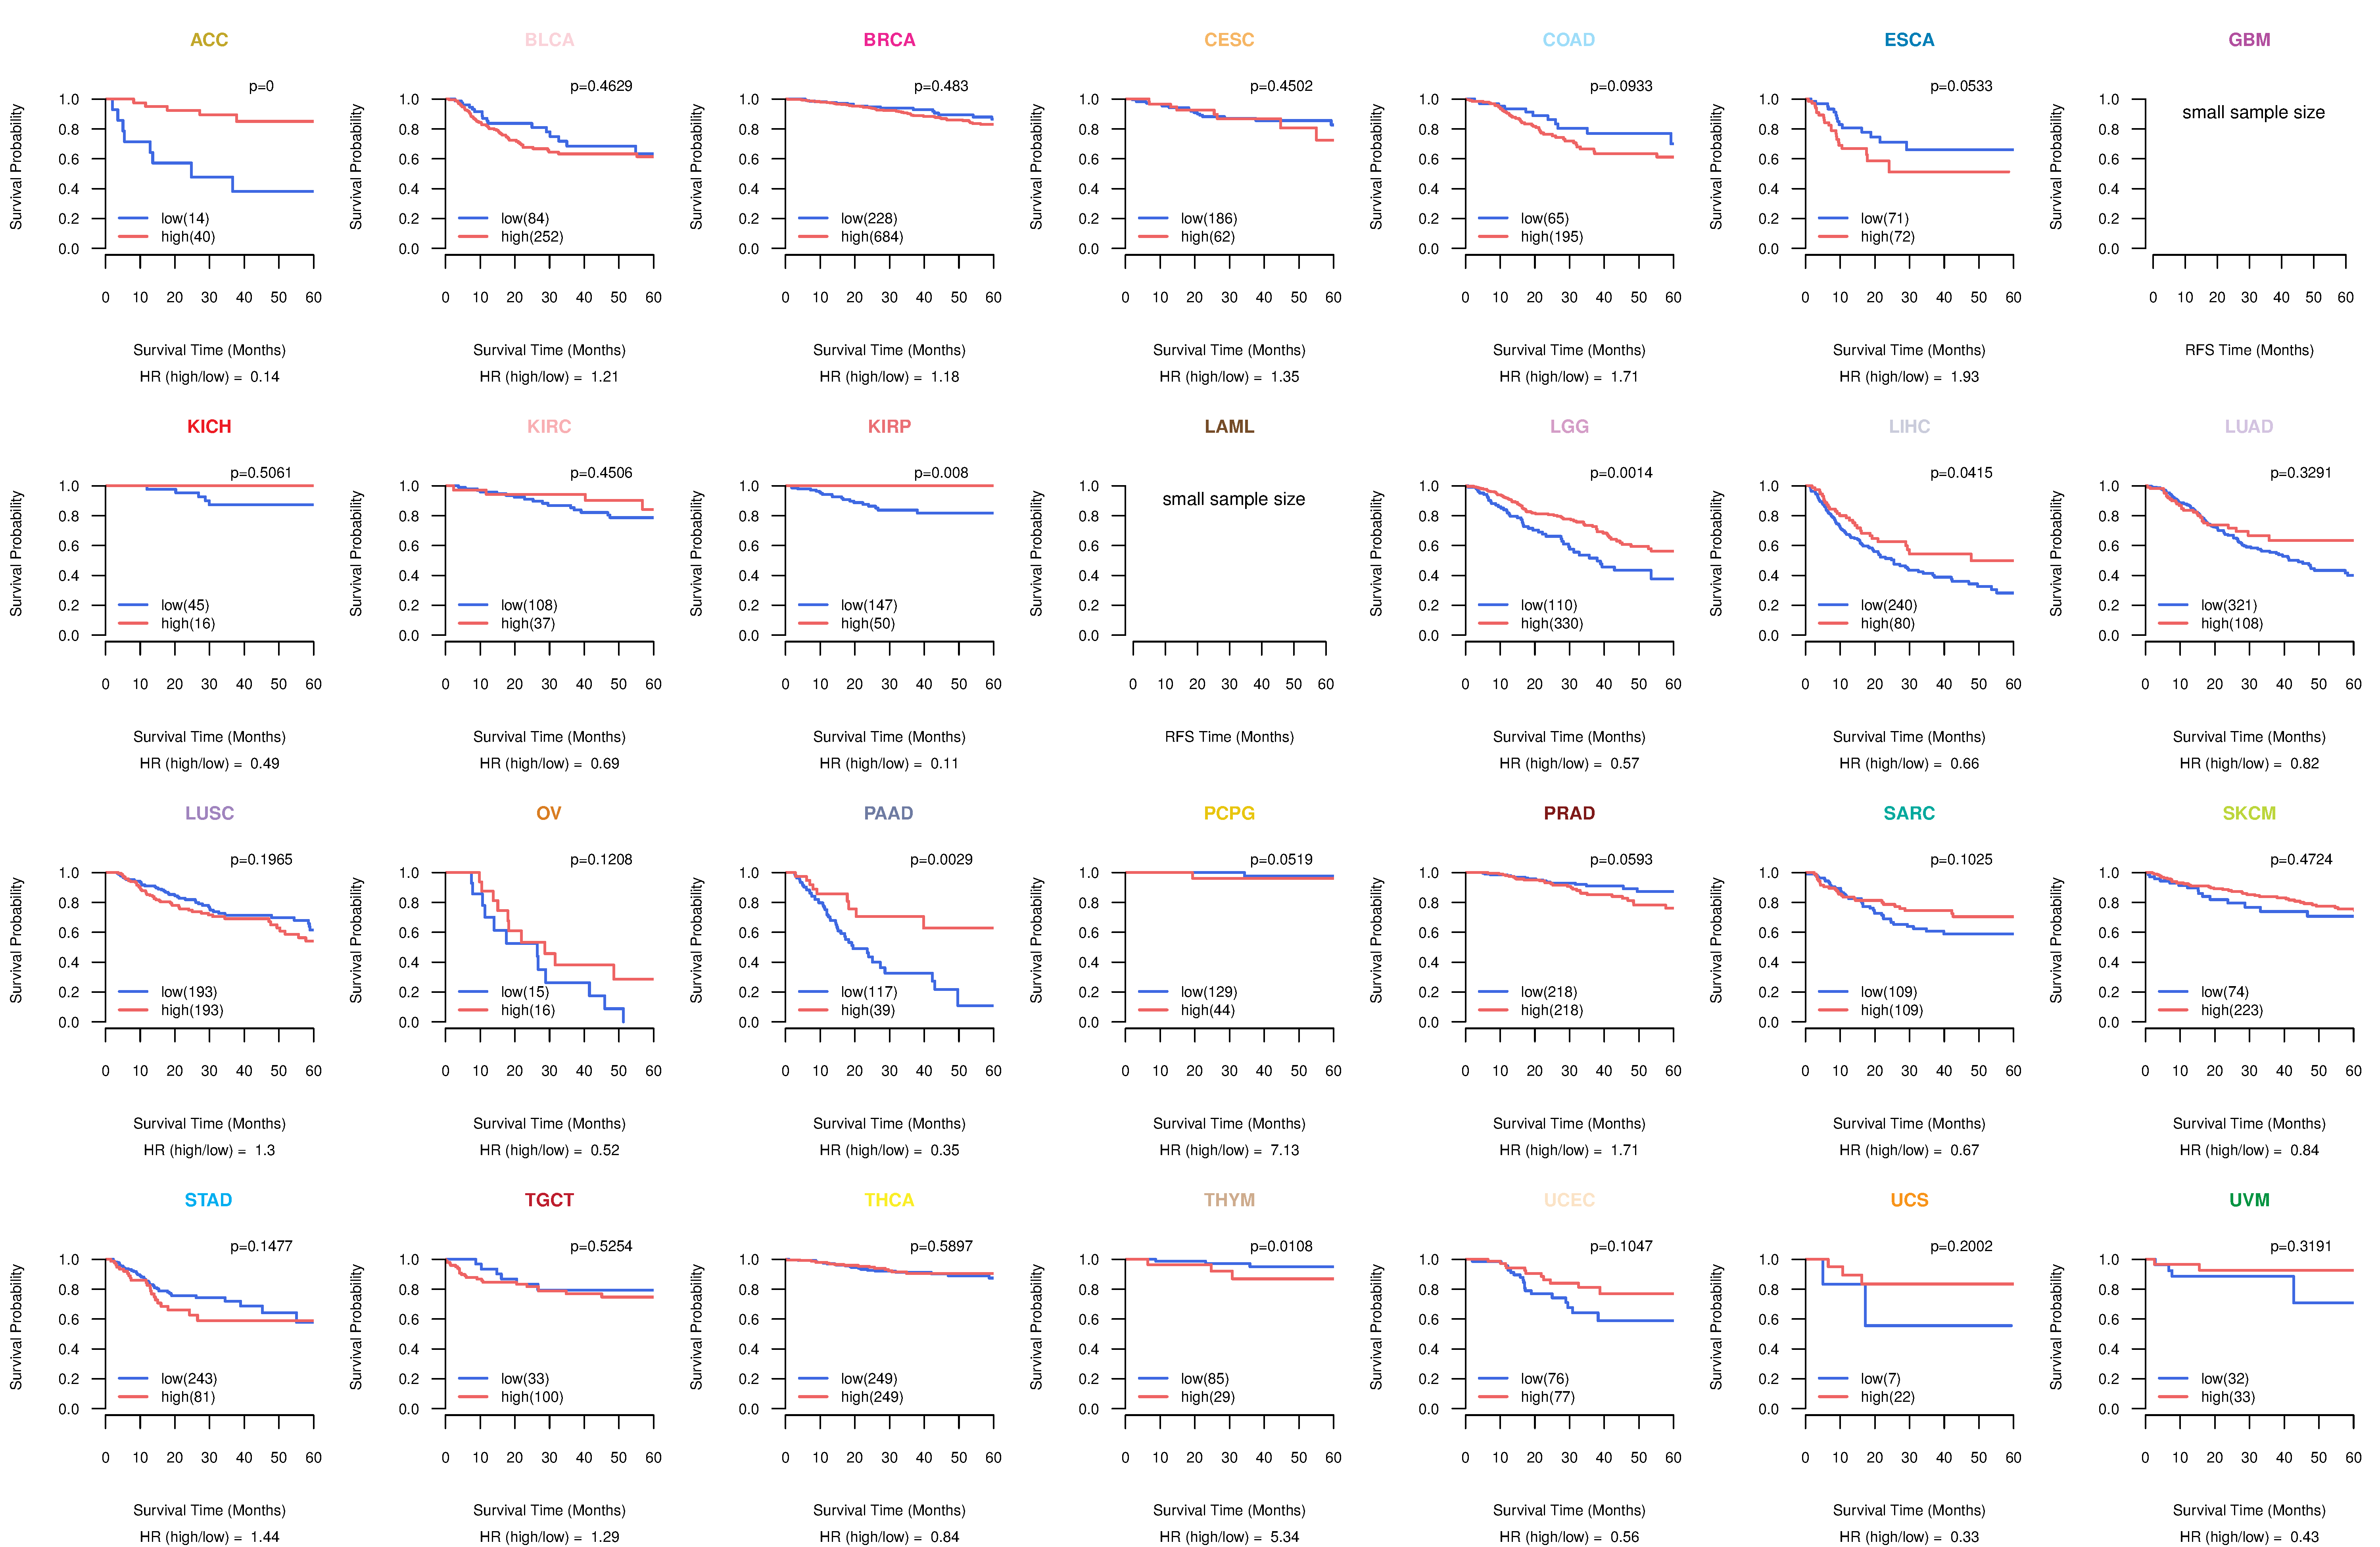
| Kaplan-Meier plots with logrank tests of overall survival (OS) using 28 cancer types (TCGA IlluminaHiSeq_RNASeqV2, pan-cancer normalized log2(norm_counts+1) data, version 2016-08-16) (TCGA clinicalMatrix, phenotype data, version 2016-04-27) * Click on the image to enlarge it in a new window. |
 |
| Kaplan-Meier plots with logrank test of relapse free survival (RFS) using 28 cancer types (TCGA IlluminaHiSeq_RNASeqV2, pan-cancer normalized log2(norm_counts+1) data, version 2016-08-16) (TCGA clinicalMatrix, phenotype data, version 2016-04-27) * Click on the image enlarge it in a new window. |
 |
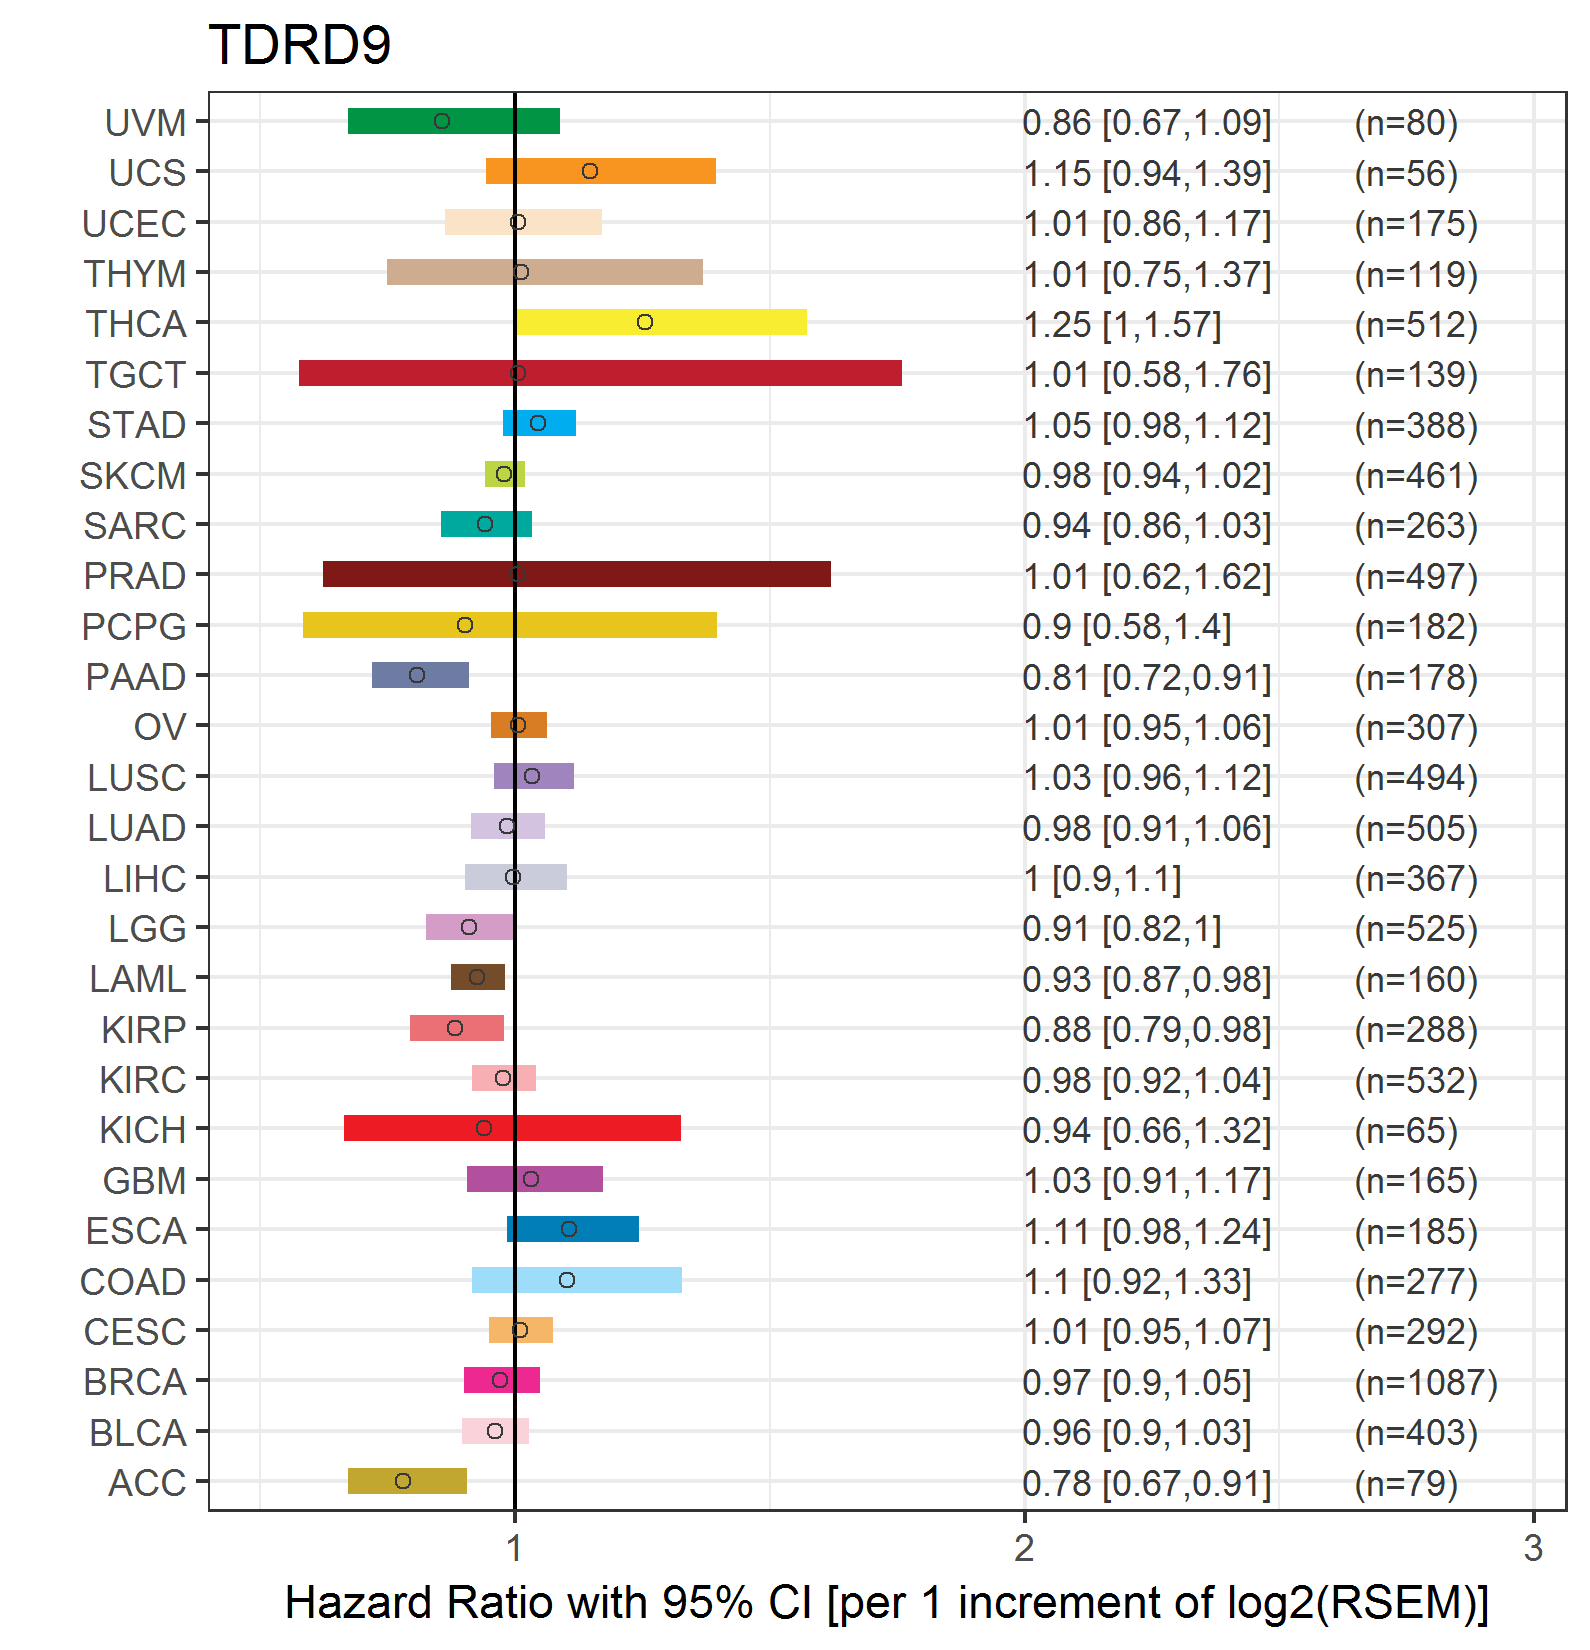
| Forest plot of Cox proportional hazard ratio (HR) and 95% CI of overall survival (OS) using 28 cancer types (TCGA IlluminaHiSeq_RNASeqV2, pan-cancer normalized log2(norm_counts+1) data, version 2016-08-16) (TCGA clinicalMatrix, phenotype data, version 2016-04-27) * Click on the image enlarge it in a new window. |
 |
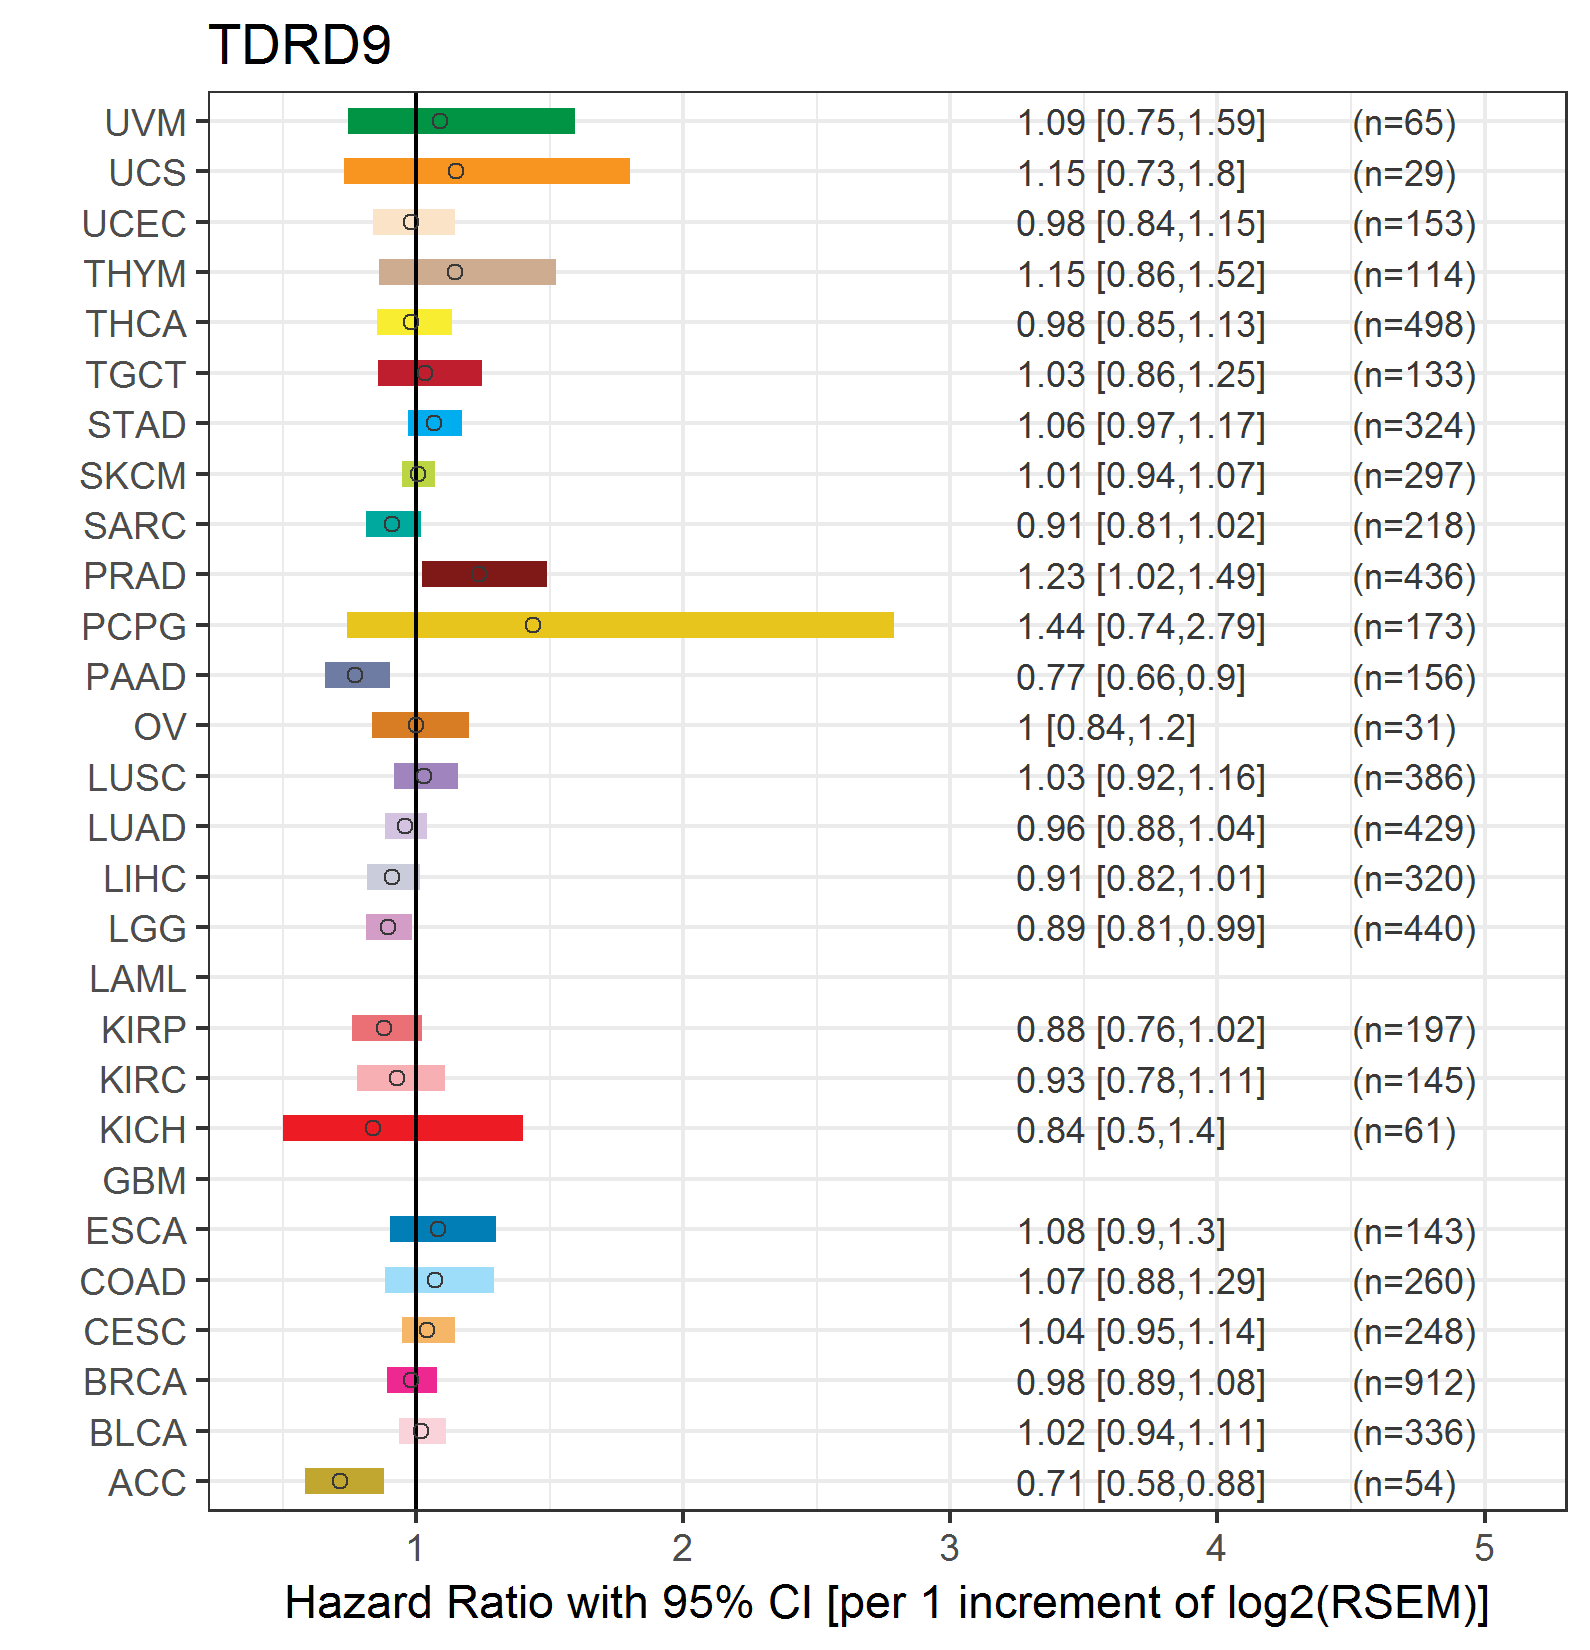
| Forest plot of Cox proportional hazard ratio (HR) and 95% CI of relapse free survival (RFS) using 28 cancer types (TCGA IlluminaHiSeq_RNASeqV2, pan-cancer normalized log2(norm_counts+1) data, version 2016-08-16) (TCGA clinicalMatrix, phenotype data, version 2016-04-27) * Click on the image enlarge it in a new window. |
 |
| Top |
| TissGeneClin for TDRD9 |
| TissGeneDrug for TDRD9 |
| Drug information targeting TissGene (DrugBank Version 5.0.6, 2017-04-01) |
| DrugBank ID | Drug name | Drug activity | Drug type | Drug status |
| Top |
| TissGeneDisease for TDRD9 |
| Disease information associated with TissGene (DisGeNet, 2016-06-01) |
| Disease ID | Disease name | # pubmeds | Source |
| umls:C0005586 | Bipolar Disorder | 4 | GAD |
| umls:C0003873 | Rheumatoid Arthritis | 1 | GAD |
| umls:C0010346 | Crohn Disease | 1 | GAD |
| umls:C0011854 | Diabetes Mellitus, Insulin-Dependent | 1 | GAD |
| umls:C0011860 | Diabetes Mellitus, Non-Insulin-Dependent | 1 | GAD |
| umls:C0020538 | Hypertensive disease | 1 | GAD |
| umls:C1956346 | Coronary Artery Disease | 1 | GAD |
|
Copyright 2016-Present - The University of Texas Health Science Center at Houston (UTHealth) Web File Viewing | How to Report, Fraud, Waste and Abuse | State of Texas | Statewide Search | Texas Homeland Security | Site Policies |