 |
| |
| |
| |
| |
| |
| |
|

| TissGeneSummary for TPPP2 |
 Gene summary Gene summary |
| Basic gene information | Gene symbol | TPPP2 |
| Gene name | tubulin polymerization-promoting protein family member 2 | |
| Synonyms | C14orf8|CT152|P18|p25beta | |
| Cytomap | UCSC genome browser: 14q11.2 | |
| Type of gene | protein-coding | |
| RefGenes | NM_173846.4, | |
| Description | TPPP/p18protein p25-beta | |
| Modification date | 20141207 | |
| dbXrefs | HGNC : HGNC | |
| Ensembl : ENSG00000179636 | ||
| HPRD : 12657 | ||
| Vega : OTTHUMG00000171071 | ||
| Protein | UniProt: go to UniProt's Cross Reference DB Table | |
| Expression | CleanEX: HS_TPPP2 | |
| BioGPS: 122664 | ||
| Pathway | NCI Pathway Interaction Database: TPPP2 | |
| KEGG: TPPP2 | ||
| REACTOME: TPPP2 | ||
| Pathway Commons: TPPP2 | ||
| Context | iHOP: TPPP2 | |
| ligand binding site mutation search in PubMed: TPPP2 | ||
| UCL Cancer Institute: TPPP2 | ||
| Assigned class in TissGDB* | A | |
| Included tissue-specific gene expression resources | HPA,TiGER,GTEx | |
| Specific-tissues in normal samples (assigned by TissGDB using HPA, TiGER, and GTEx) | Testis | |
| Cancer types related to the specific-tissues in cancer samples (assigned by TissGDB using TCGA) | TGCT | |
| Reference showing the relevant tissue of TPPP2 | Scanning of novel cancer/testis proteins by human testis proteomic analysis. Proteomics. 2013 Apr;13(7):1200-10. doi: 10.1002/pmic.201200489. Epub 2013 Mar 6. (pmid:23436708) go to article | |
| Description by TissGene annotations | ||
| * Class A consists of genes with literature evidence and is part of the cTissGenes. Class B consists of only cTissGenes without additional evidence. The remaining genes belong to Class C. |
| Gene ontology having evidence of Inferred from Direct Assay (IDA) from Entrez |
| GO ID | GO term | PubMed ID |
| Top |
| TissGeneExp for TPPP2 |
| Gene expressions across 28 cancer types (X-axis: cancer type and Y-axis: log2(norm_counts+1)) (TCGA IlluminaHiSeq_RNASeqV2, pan-cancer normalized log2(norm_counts+1) data, version 2016-08-16) |
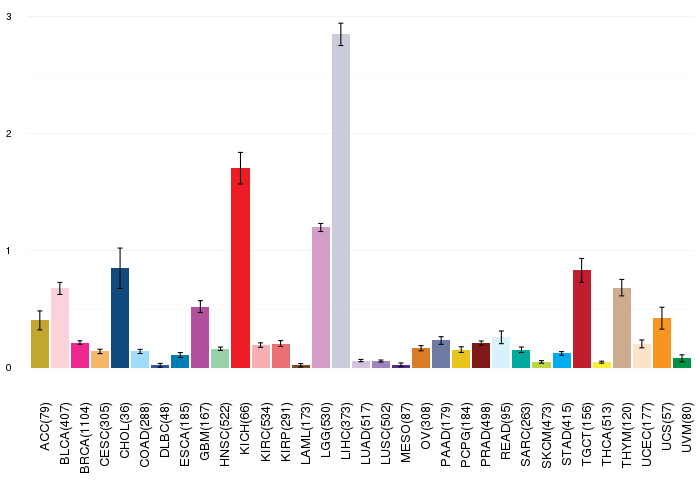 |
| Gene isoform expressions across 28 cancer types (X-axis: cancer type and Y-axis: log2(norm_counts+1)) (TCGA pan-cancer tcga_rsem_isoform_tpm, version 2016-09-01) |
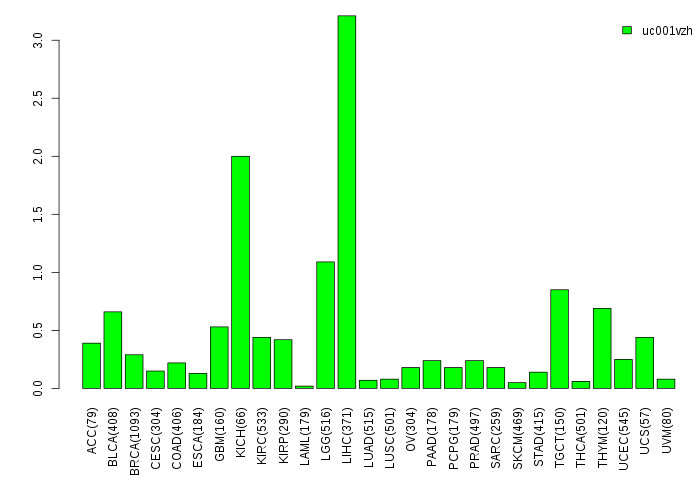 |
| Gene expressions across normal tissues of GTEx data (GTEx GTEx_Analysis_v6_RNA-seq_RNA-SeQCv1.1.8_gene_rpkm.gct) - Here, we shows the matched tissue types only among our 28 cancer types. |
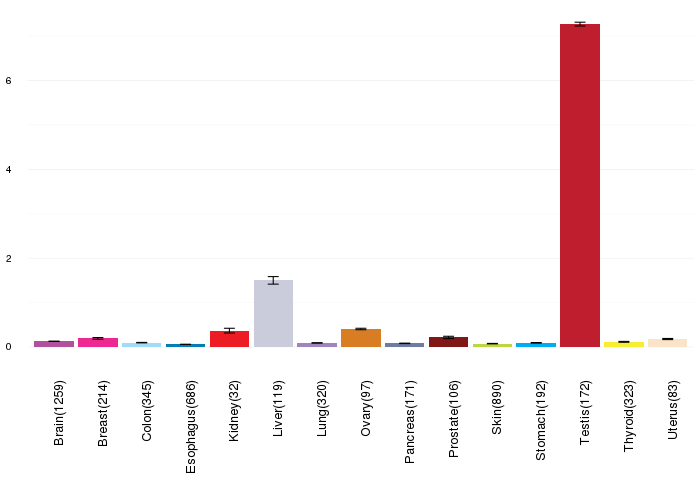 |
| Different expressions across 14 cancer types with more than 10 samples between matched tumors and normals (X-axis: cancer type and Y-axis: log2(norm_counts+1)) (TCGA IlluminaHiSeq_RNASeqV2, pan-cancer normalized log2(norm_counts+1) data, version 2016-08-16) |
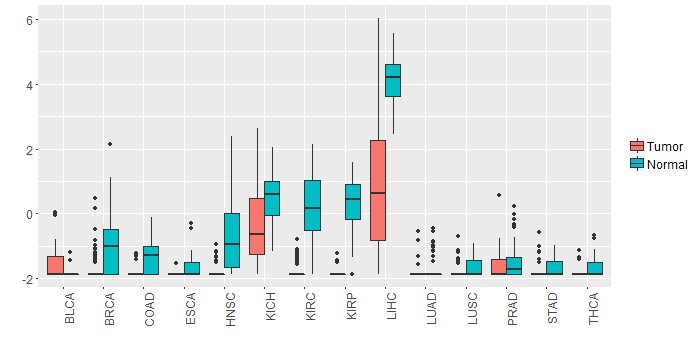 |
| - Significantly differentially expressed cancer types and information. (|Fold change|>1 and FDR<0.05) |
| Cancer type | Mean(exp) in tumor | Mean(exp) in matched normal | Log2FC | P-val. | FDR |
| LIHC | 0.915082801 | 4.141956801 | -3.226874 | 2.28E-14 | 6.33E-13 |
| HNSC | -1.745679478 | -0.679056223 | -1.066623256 | 6.75E-07 | 5.31E-06 |
| KIRC | -1.73807431 | 0.199756245 | -1.937830556 | 1.10E-27 | 1.65E-26 |
| KIRP | -1.773963199 | 0.334477426 | -2.108440625 | 3.45E-16 | 1.21E-14 |
| Top |
| TissGene-miRNA for TPPP2 |
| Significantly anti-correlated miRNAs of TissGene across 28 cancer types (Gene-miRNA relations from TargetScanHuman Relsease 7.1, Conserved_Site_Context_Scores.txt.zip, 06.01.2016) (TCGA IlluminaHiSeq_miRNASeq, log2(RPM+1) data, version 2016-11-21) (TCGA IlluminaHiSeq_RNASeqV2, log2(normalized_count+1) data, version 2016-08-16) (Spearman’s Rank Correlation (p-value<0.05 and coefficient<-0.25)) |
| Cancer type | miRNA id | miRNA accession | P-val. | Coeff. | # samples |
| Top |
| TissGeneMut for TPPP2 |
| TissGeneSNV for TPPP2 |
| nsSNV counts per each loci. Different colors of circles represent different cancer types. Circle size denotes number of samples. (TCGA somatic mutation (SNPs and small INDELs) data, version 2016-04-25) * Click on the image to enlarge it in a new window. |
 |
 |
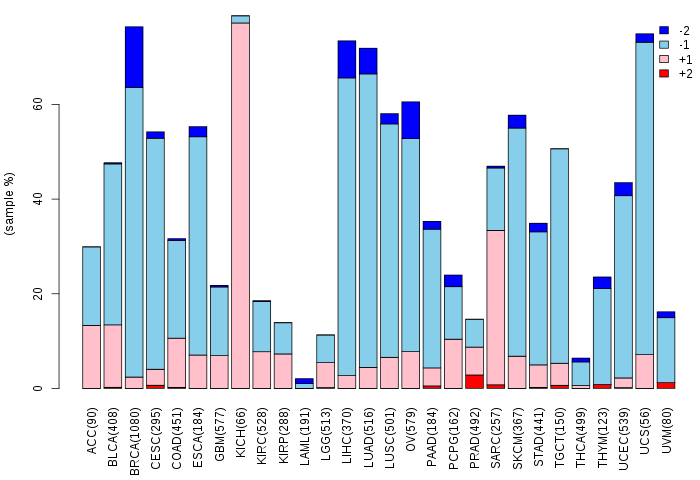
| Somatic nucleotide variants of TissGene across 28 cancer types (X-axis: cancer type and Y-axis: % of mutated samples) The numbers in parentheses are numbers of samples with mutation (nsSNVs). (TCGA somatic mutation (SNPs and small INDELs) data, version 2016-04-25) |
 |
| - nsSNVs sorted by frequency. |
| AAchange | Cancer type | # samples |
| p.E6A | LGG | 2 |
| p.M149I | BRCA | 1 |
| p.A144E | HNSC | 1 |
| p.V45I | UVM | 1 |
| p.S157T | LUSC | 1 |
| p.A73V | COAD | 1 |
| p.K139R | SKCM | 1 |
| p.T123A | COAD | 1 |
| p.R119C | SKCM | 1 |
| p.R63Q | SKCM | 1 |
| p.E76K | SKCM | 1 |
| p.T150A | BRCA | 1 |
| p.E99* | LUAD | 1 |
| p.I94V | STAD | 1 |
| p.K170N | LUAD | 1 |
| p.G22S | PRAD | 1 |
| p.D41E | LIHC | 1 |
| p.R63Q | UCEC | 1 |
| p.E89K | HNSC | 1 |
| p.T150A | LIHC | 1 |
| p.T109I | LUAD | 1 |
| p.G16E | SKCM | 1 |
| p.G42D | COAD | 1 |
| p.R11W | BLCA | 1 |
| p.G38S | LUAD | 1 |
| p.G154C | UCEC | 1 |
| Top |
| TissGeneCNV for TPPP2 |
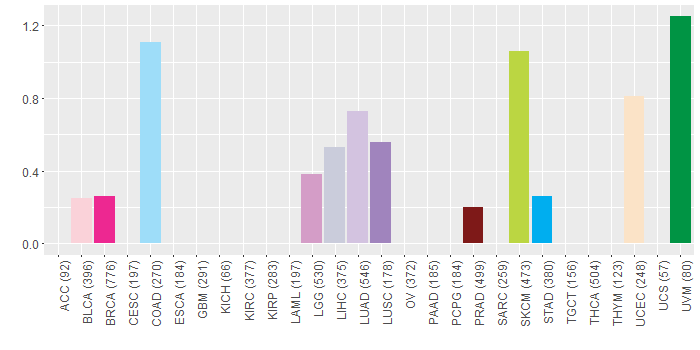
| Copy number variations of TissGene across 28 cancer types (X-axis: cancer type and Y-axis: % of CNV samples) (TCGA Gistic2_CopyNumber_Gistic2_all_data_by_genes, Gistic2 copy number data, version 2016-08-16) |
 |
| Top |
| TissGeneFusions for TPPP2 |
| Fusion genes including TissGene (ChimerDB 3.0, 2016-12-01 and TCGA fusion Portal 2015-12-01) |
| Database | Src | Cancer type | Sample | Fusion gene | ORF | 5'-gene BP | 3'-gene BP |
| Top |
| TissGeneNet for TPPP2 |
| Co-expressed gene networks based on protein-protein interaction data (CePIN) (TCGA IlluminaHiSeq_RNASeqV2, pan-cancer normalized log2(norm_counts+1) data, version 2016-08-16) (PINA2 ppi data) |
| Top |
| TissGeneProg for TPPP2 |
| Kaplan-Meier plots with logrank tests of overall survival (OS) using 28 cancer types (TCGA IlluminaHiSeq_RNASeqV2, pan-cancer normalized log2(norm_counts+1) data, version 2016-08-16) (TCGA clinicalMatrix, phenotype data, version 2016-04-27) * Click on the image to enlarge it in a new window. |
 |
| Kaplan-Meier plots with logrank test of relapse free survival (RFS) using 28 cancer types (TCGA IlluminaHiSeq_RNASeqV2, pan-cancer normalized log2(norm_counts+1) data, version 2016-08-16) (TCGA clinicalMatrix, phenotype data, version 2016-04-27) * Click on the image enlarge it in a new window. |
 |
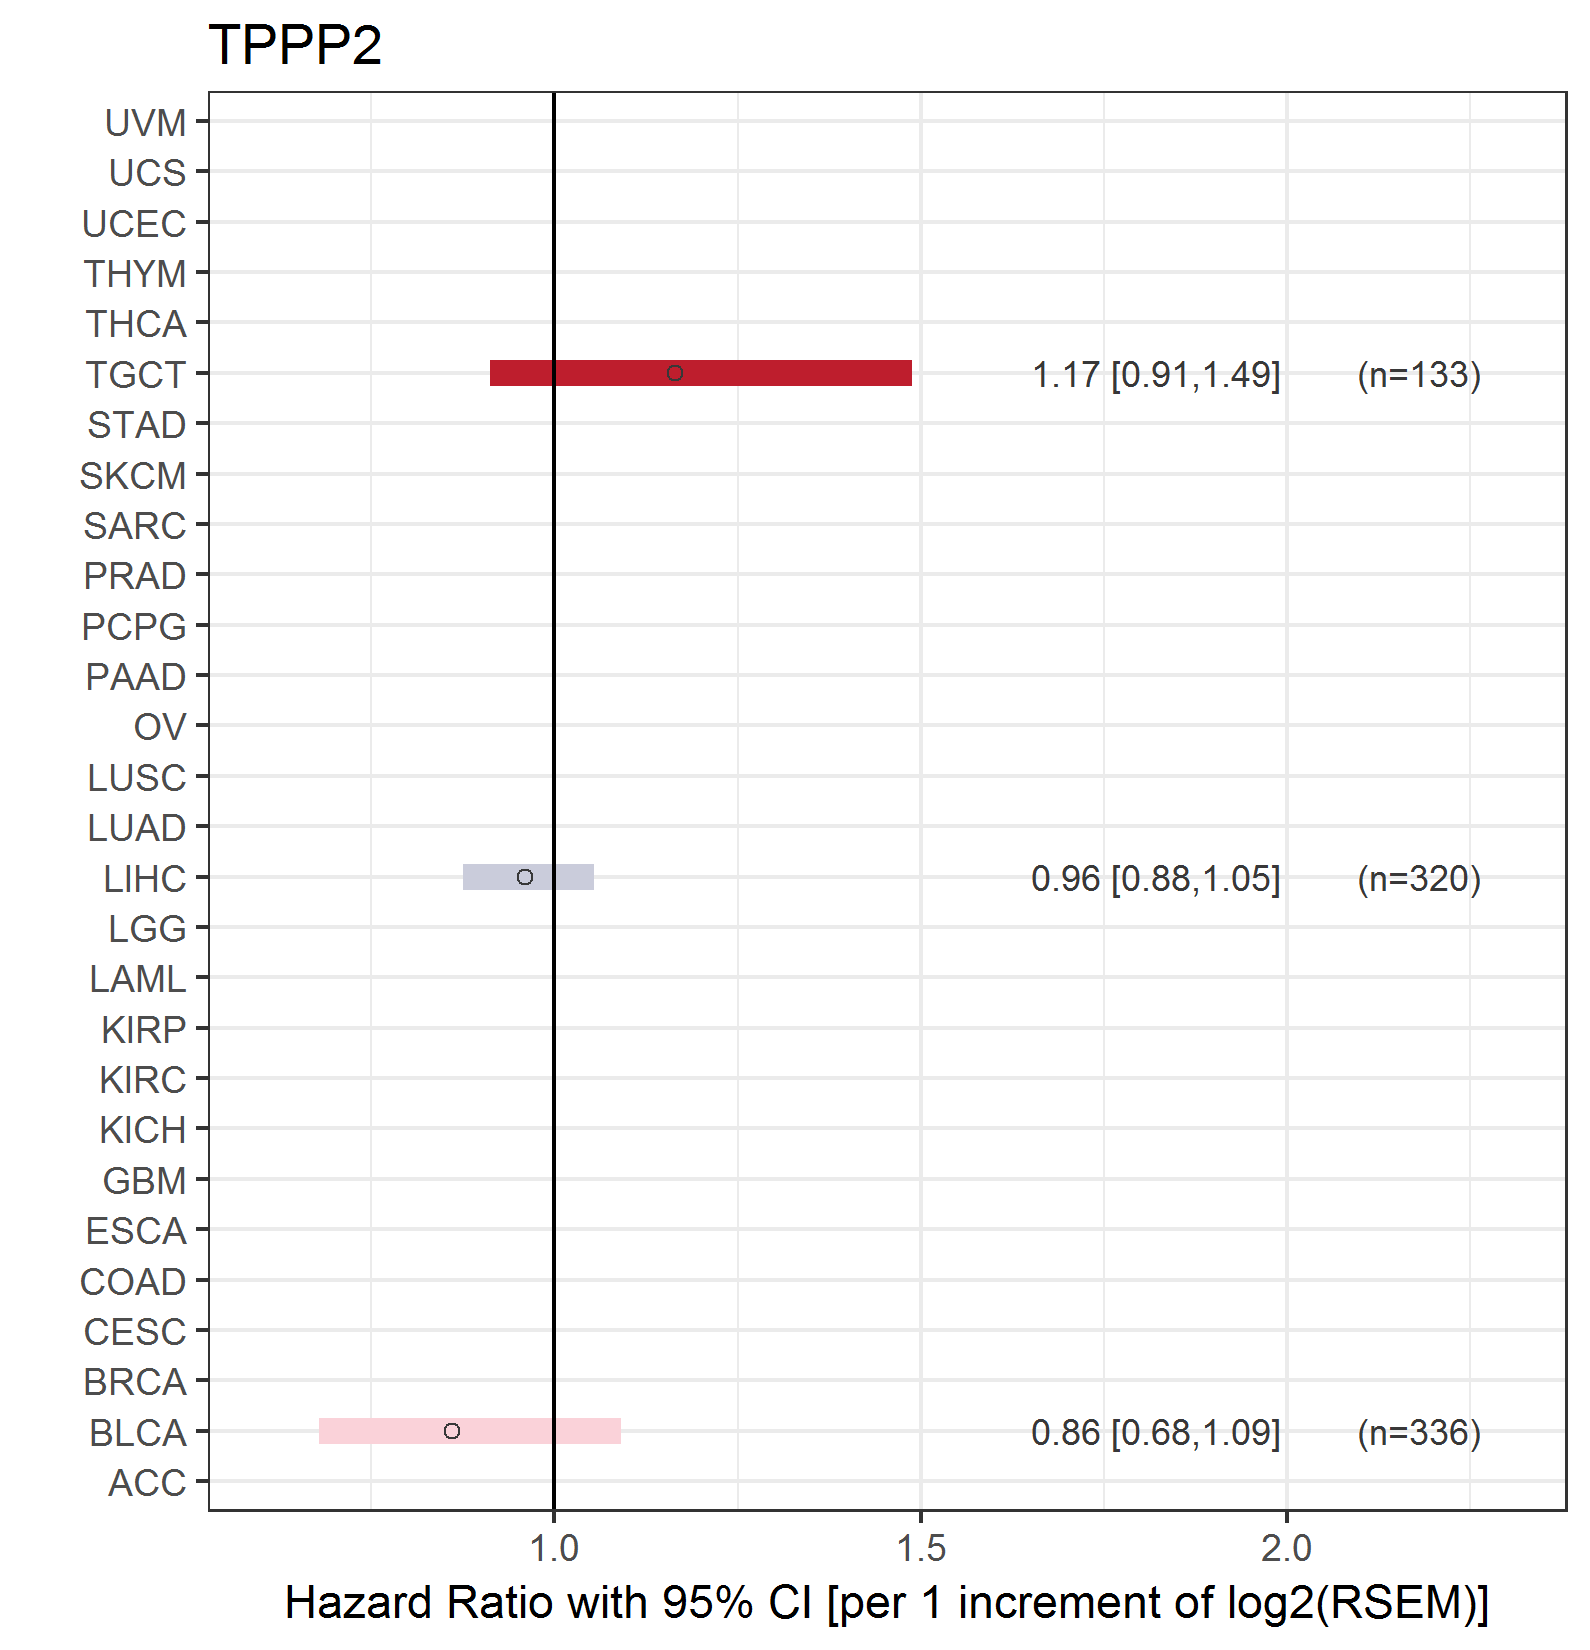
| Forest plot of Cox proportional hazard ratio (HR) and 95% CI of overall survival (OS) using 28 cancer types (TCGA IlluminaHiSeq_RNASeqV2, pan-cancer normalized log2(norm_counts+1) data, version 2016-08-16) (TCGA clinicalMatrix, phenotype data, version 2016-04-27) * Click on the image enlarge it in a new window. |
 |
| Forest plot of Cox proportional hazard ratio (HR) and 95% CI of relapse free survival (RFS) using 28 cancer types (TCGA IlluminaHiSeq_RNASeqV2, pan-cancer normalized log2(norm_counts+1) data, version 2016-08-16) (TCGA clinicalMatrix, phenotype data, version 2016-04-27) * Click on the image enlarge it in a new window. |
 |
| Top |
| TissGeneClin for TPPP2 |
| TissGeneDrug for TPPP2 |
| Drug information targeting TissGene (DrugBank Version 5.0.6, 2017-04-01) |
| DrugBank ID | Drug name | Drug activity | Drug type | Drug status |
| Top |
| TissGeneDisease for TPPP2 |
| Disease information associated with TissGene (DisGeNet, 2016-06-01) |
| Disease ID | Disease name | # pubmeds | Source |
| umls:C0023418 | leukemia | 5 | BeFree |
| umls:C0596263 | Carcinogenesis | 4 | BeFree |
| umls:C0085669 | Acute leukemia | 3 | BeFree |
| umls:C0019104 | Hemorrhagic Fevers, Viral | 2 | BeFree |
| umls:C0025286 | Meningioma | 2 | BeFree |
| umls:C0026764 | Multiple Myeloma | 2 | BeFree |
| umls:C0035344 | Retinopathy of Prematurity | 2 | BeFree |
| umls:C0262587 | Parathyroid Adenoma | 2 | BeFree |
| umls:C2239176 | Liver carcinoma | 2 | BeFree |
| umls:C0007131 | Non-Small Cell Lung Carcinoma | 1 | BeFree |
| umls:C0025202 | melanoma | 1 | BeFree |
| umls:C0028754 | Obesity | 1 | BeFree |
| umls:C0153676 | Secondary malignant neoplasm of lung | 1 | BeFree |
|
Copyright 2016-Present - The University of Texas Health Science Center at Houston (UTHealth) Web File Viewing | How to Report, Fraud, Waste and Abuse | State of Texas | Statewide Search | Texas Homeland Security | Site Policies |