 |
| |
| |
| |
| |
| |
| |
|

| TissGeneSummary for SPACA3 |
 Gene summary Gene summary |
| Basic gene information | Gene symbol | SPACA3 |
| Gene name | sperm acrosome associated 3 | |
| Synonyms | 1700025M08Rik|ALLP17|CT54|LYC3|LYZL3|SLLP1 | |
| Cytomap | UCSC genome browser: 17q11.2 | |
| Type of gene | protein-coding | |
| RefGenes | NM_173847.3, | |
| Description | cancer/testis antigen 54lysozyme-like acrosomal sperm-specific secretory protein ALLP-17lysozyme-like protein 3lysozyme-like sperm-specific secretory protein ALLP17sperm acrosome membrane-associated protein 3sperm lysozyme like protein 1sperm lysozy | |
| Modification date | 20141207 | |
| dbXrefs | MIM : 612749 | |
| HGNC : HGNC | ||
| Ensembl : ENSG00000141316 | ||
| HPRD : 15420 | ||
| Vega : OTTHUMG00000132886 | ||
| Protein | UniProt: go to UniProt's Cross Reference DB Table | |
| Expression | CleanEX: HS_SPACA3 | |
| BioGPS: 124912 | ||
| Pathway | NCI Pathway Interaction Database: SPACA3 | |
| KEGG: SPACA3 | ||
| REACTOME: SPACA3 | ||
| Pathway Commons: SPACA3 | ||
| Context | iHOP: SPACA3 | |
| ligand binding site mutation search in PubMed: SPACA3 | ||
| UCL Cancer Institute: SPACA3 | ||
| Assigned class in TissGDB* | C | |
| Included tissue-specific gene expression resources | HPA,GTEx | |
| Specific-tissues in normal samples (assigned by TissGDB using HPA, TiGER, and GTEx) | Testis | |
| Cancer types related to the specific-tissues in cancer samples (assigned by TissGDB using TCGA) | TGCT | |
| Reference showing the relevant tissue of SPACA3 | ||
| Description by TissGene annotations | Fused withTSGene | |
| * Class A consists of genes with literature evidence and is part of the cTissGenes. Class B consists of only cTissGenes without additional evidence. The remaining genes belong to Class C. |
| Gene ontology having evidence of Inferred from Direct Assay (IDA) from Entrez |
| GO ID | GO term | PubMed ID |
| Top |
| TissGeneExp for SPACA3 |
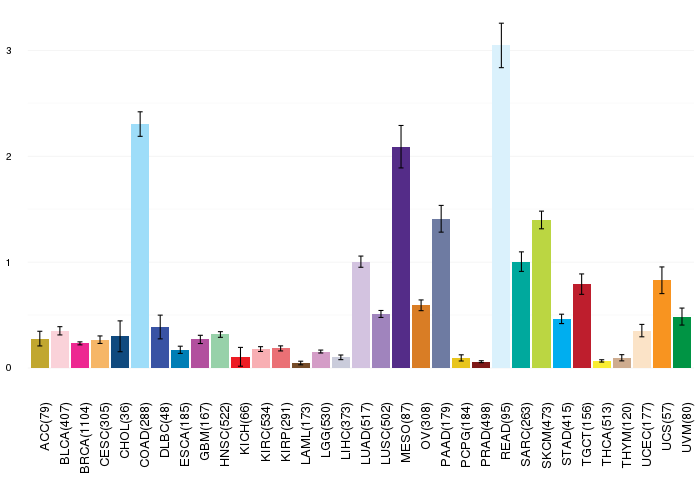
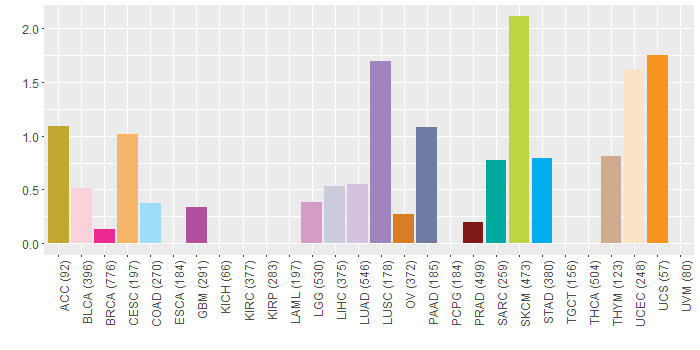
| Gene expressions across 28 cancer types (X-axis: cancer type and Y-axis: log2(norm_counts+1)) (TCGA IlluminaHiSeq_RNASeqV2, pan-cancer normalized log2(norm_counts+1) data, version 2016-08-16) |
 |
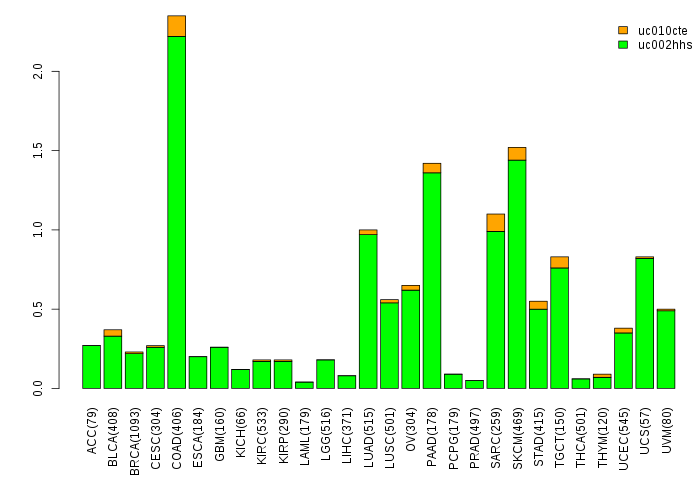
| Gene isoform expressions across 28 cancer types (X-axis: cancer type and Y-axis: log2(norm_counts+1)) (TCGA pan-cancer tcga_rsem_isoform_tpm, version 2016-09-01) |
 |
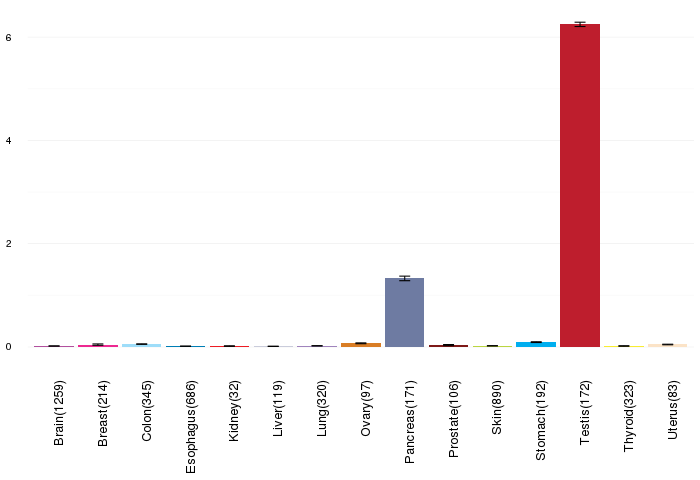
| Gene expressions across normal tissues of GTEx data (GTEx GTEx_Analysis_v6_RNA-seq_RNA-SeQCv1.1.8_gene_rpkm.gct) - Here, we shows the matched tissue types only among our 28 cancer types. |
 |
| Different expressions across 14 cancer types with more than 10 samples between matched tumors and normals (X-axis: cancer type and Y-axis: log2(norm_counts+1)) (TCGA IlluminaHiSeq_RNASeqV2, pan-cancer normalized log2(norm_counts+1) data, version 2016-08-16) |
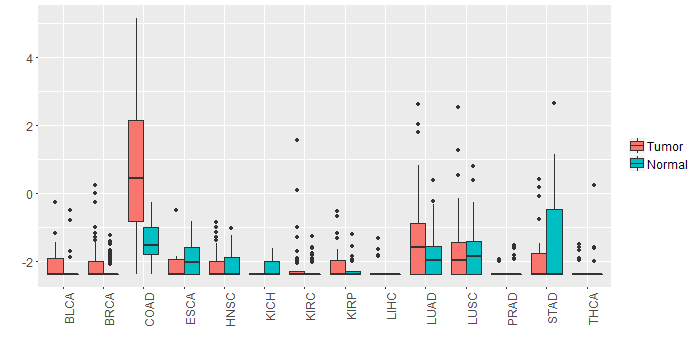 |
| - Significantly differentially expressed cancer types and information. (|Fold change|>1 and FDR<0.05) |
| Cancer type | Mean(exp) in tumor | Mean(exp) in matched normal | Log2FC | P-val. | FDR |
| COAD | 0.747690598 | -1.405509402 | 2.1532 | 9.01E-06 | 4.20E-05 |
| Top |
| TissGene-miRNA for SPACA3 |
| Significantly anti-correlated miRNAs of TissGene across 28 cancer types (Gene-miRNA relations from TargetScanHuman Relsease 7.1, Conserved_Site_Context_Scores.txt.zip, 06.01.2016) (TCGA IlluminaHiSeq_miRNASeq, log2(RPM+1) data, version 2016-11-21) (TCGA IlluminaHiSeq_RNASeqV2, log2(normalized_count+1) data, version 2016-08-16) (Spearman’s Rank Correlation (p-value<0.05 and coefficient<-0.25)) |
| Cancer type | miRNA id | miRNA accession | P-val. | Coeff. | # samples |
| Top |
| TissGeneMut for SPACA3 |
| TissGeneSNV for SPACA3 |
| nsSNV counts per each loci. Different colors of circles represent different cancer types. Circle size denotes number of samples. (TCGA somatic mutation (SNPs and small INDELs) data, version 2016-04-25) * Click on the image to enlarge it in a new window. |
 |
 |
| Somatic nucleotide variants of TissGene across 28 cancer types (X-axis: cancer type and Y-axis: % of mutated samples) The numbers in parentheses are numbers of samples with mutation (nsSNVs). (TCGA somatic mutation (SNPs and small INDELs) data, version 2016-04-25) |
 |
| - nsSNVs sorted by frequency. |
| AAchange | Cancer type | # samples |
| p.G72R | SKCM | 3 |
| p.G22D | SKCM | 2 |
| p.R92H | GBM | 1 |
| p.L105F | BLCA | 1 |
| p.P21H | ACC | 1 |
| p.L20F | LUAD | 1 |
| p.E133K | UCEC | 1 |
| p.Q120H | LGG | 1 |
| p.R92H | READ | 1 |
| p.R6W | BRCA | 1 |
| p.P21S | CESC | 1 |
| p.L82I | CESC | 1 |
| p.M113I | STAD | 1 |
| p.G37R | SKCM | 1 |
| p.M182I | STAD | 1 |
| p.F121L | UCEC | 1 |
| p.N160I | LUSC | 1 |
| p.S15L | PAAD | 1 |
| p.M1I | LUAD | 1 |
| p.G72R | PRAD | 1 |
| p.G124C | LIHC | 1 |
| p.V2A | STAD | 1 |
| p.L174F | BLCA | 1 |
| p.D205N | LUSC | 1 |
| p.N160K | LGG | 1 |
| p.G72E | SKCM | 1 |
| p.G141E | SKCM | 1 |
| p.G37R | PAAD | 1 |
| p.S167L | SKCM | 1 |
| p.G44S | SKCM | 1 |
| p.G91D | SKCM | 1 |
| p.G106R | PAAD | 1 |
| p.P87L | LUAD | 1 |
| p.L174F | THYM | 1 |
| p.S123N | UCEC | 1 |
| p.S78N | UCS | 1 |
| p.A50T | OV | 1 |
| p.G37E | SKCM | 1 |
| p.I145L | STAD | 1 |
| p.L105V | SARC | 1 |
| p.R27Q | BLCA | 1 |
| p.H100R | DLBC | 1 |
| p.G106E | SKCM | 1 |
| p.L112Q | LIHC | 1 |
| p.L191Q | LUSC | 1 |
| p.R6Q | SARC | 1 |
| p.S98L | SKCM | 1 |
| p.N91K | LGG | 1 |
| p.G212D | COAD | 1 |
| p.V18A | UCEC | 1 |
| p.G25R | SKCM | 1 |
| Top |
| TissGeneCNV for SPACA3 |
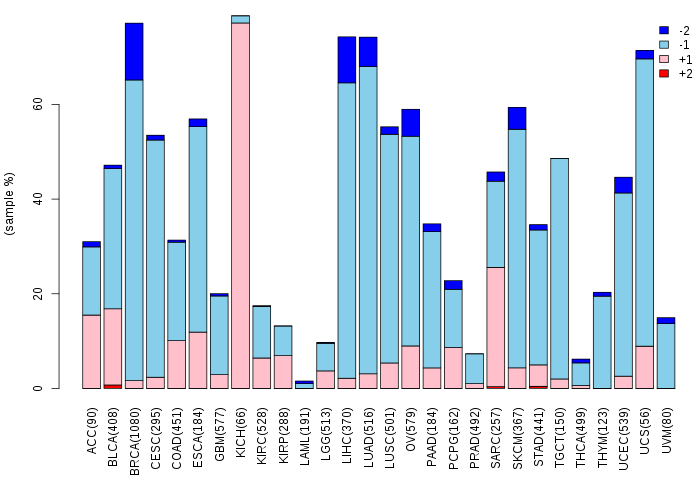
| Copy number variations of TissGene across 28 cancer types (X-axis: cancer type and Y-axis: % of CNV samples) (TCGA Gistic2_CopyNumber_Gistic2_all_data_by_genes, Gistic2 copy number data, version 2016-08-16) |
 |
| Top |
| TissGeneFusions for SPACA3 |
| Fusion genes including TissGene (ChimerDB 3.0, 2016-12-01 and TCGA fusion Portal 2015-12-01) |
| Database | Src | Cancer type | Sample | Fusion gene | ORF | 5'-gene BP | 3'-gene BP |
| Chimerdb3.0 | ChiTaRs | NA | AA398583 | ADCY2-SPACA3 | chr5:7827645 | chr17:31322640 | |
| Chimerdb3.0 | ChiTaRs | NA | AK302371 | PHC3-SPACA3 | chr3:169899535 | chr17:31322450 | |
| TCGAfusionPortal | PRADA | BRCA | TCGA-A8-A06Z-01A | USP22-SPACA3 | Out-of-frame | Chr17:20945978 | Chr17:31323861 |
| Top |
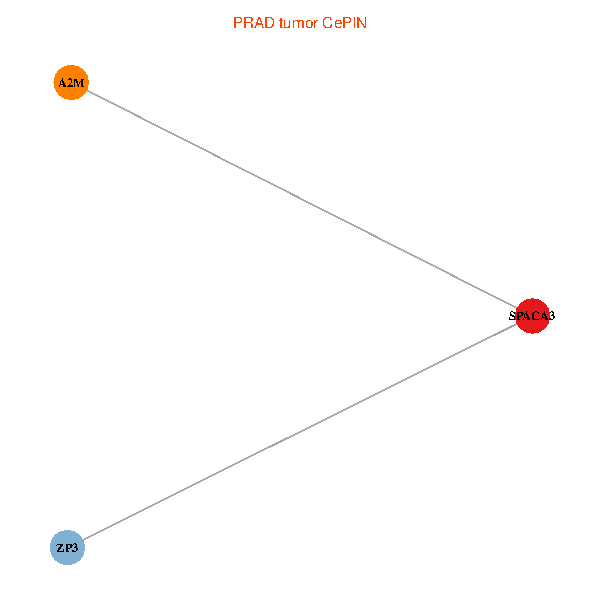
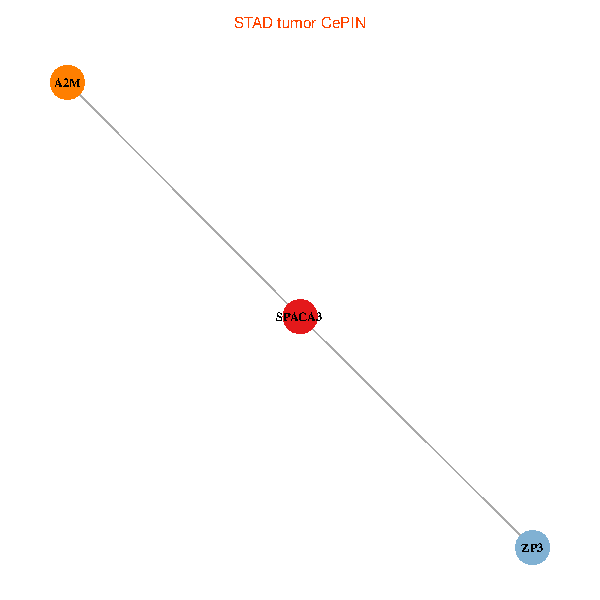
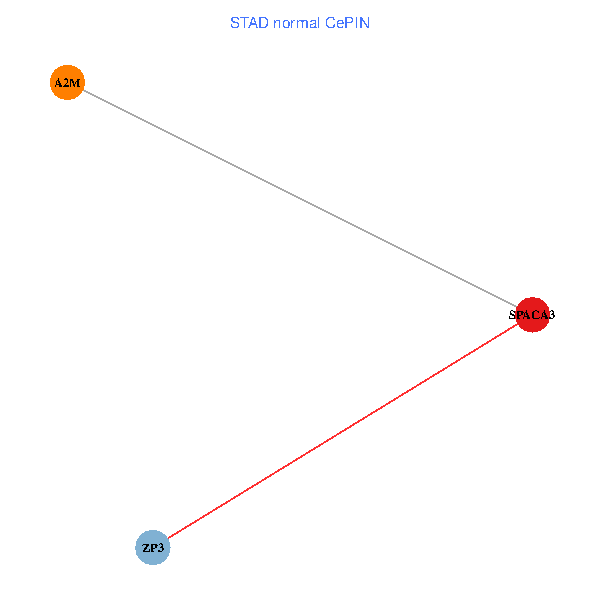
| TissGeneNet for SPACA3 |
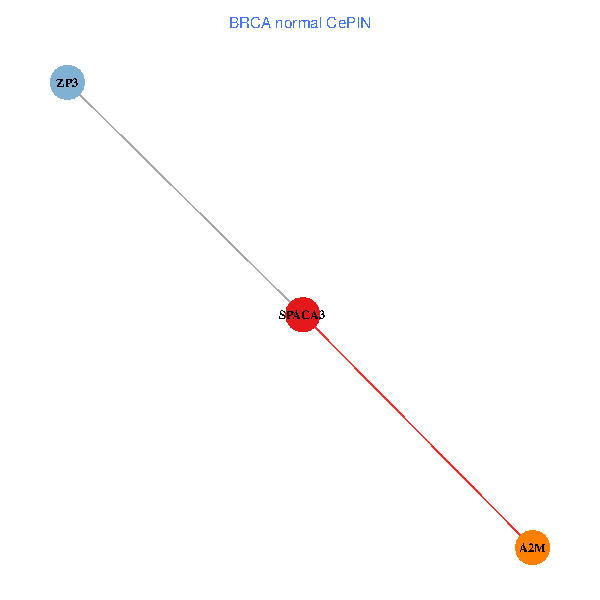
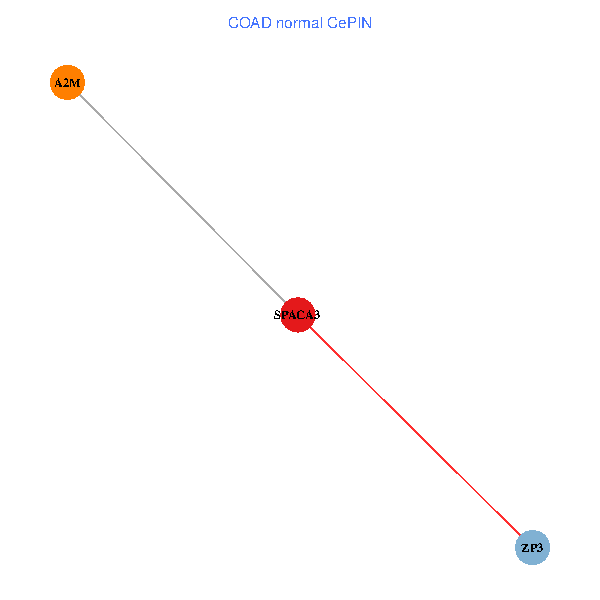
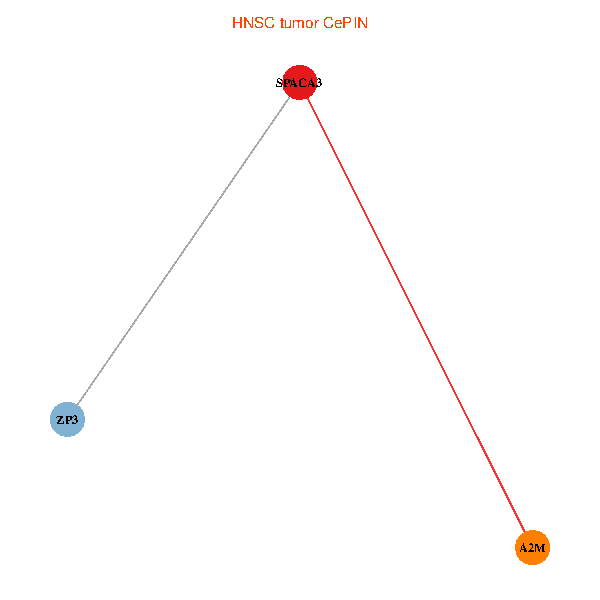
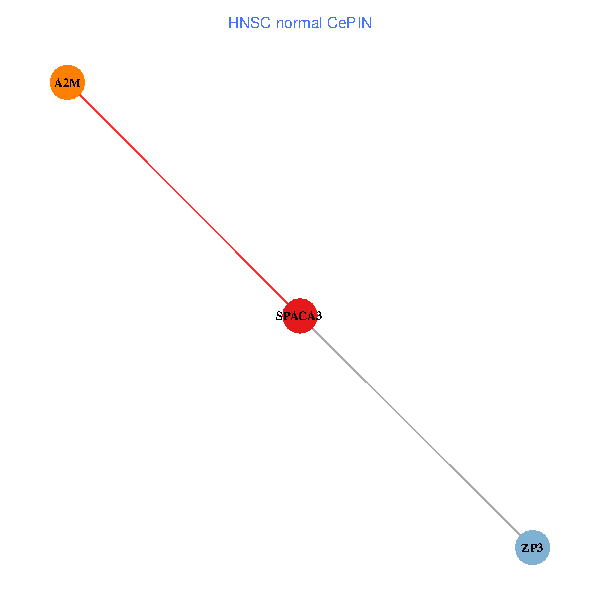
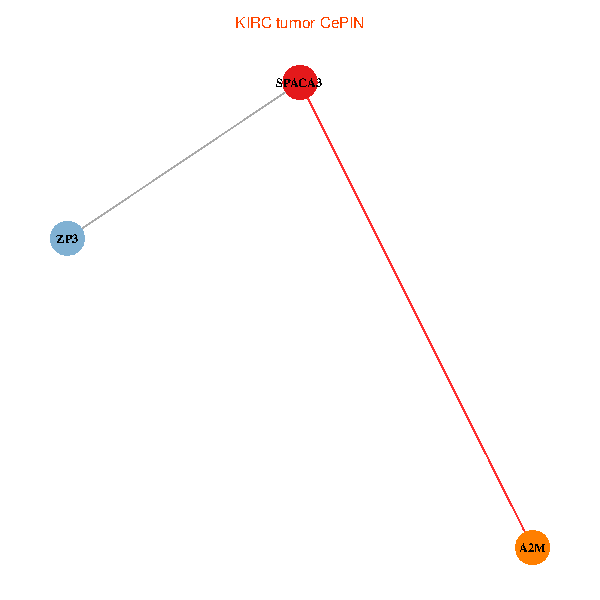
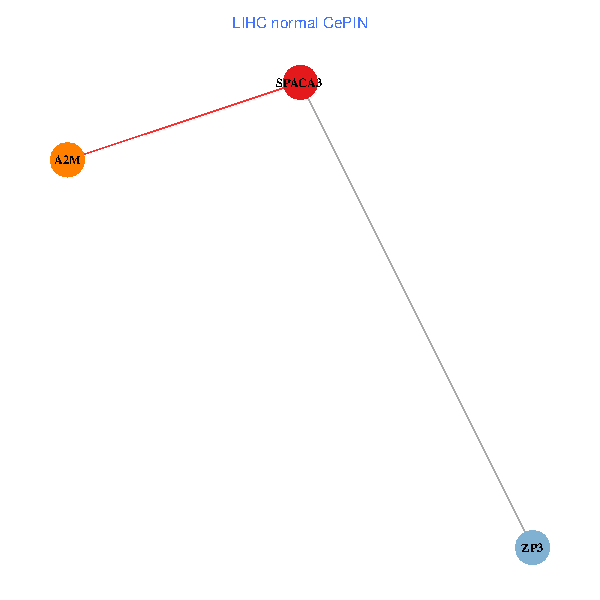
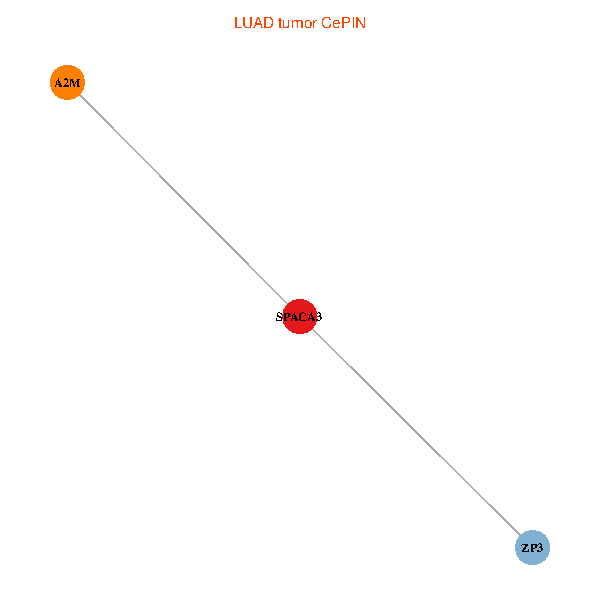
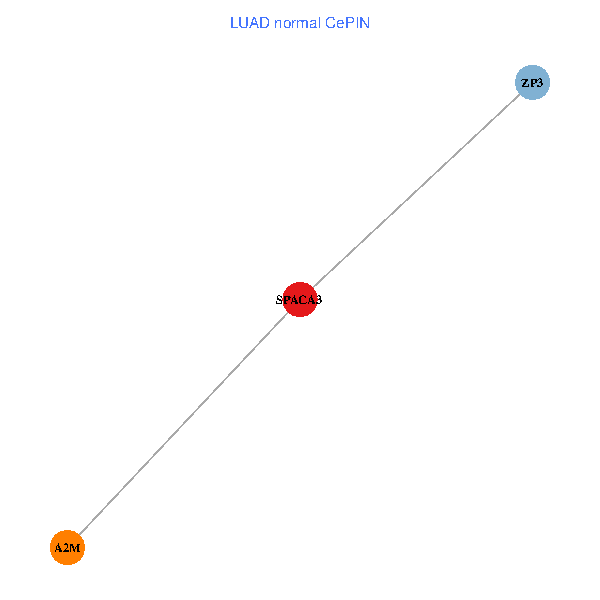
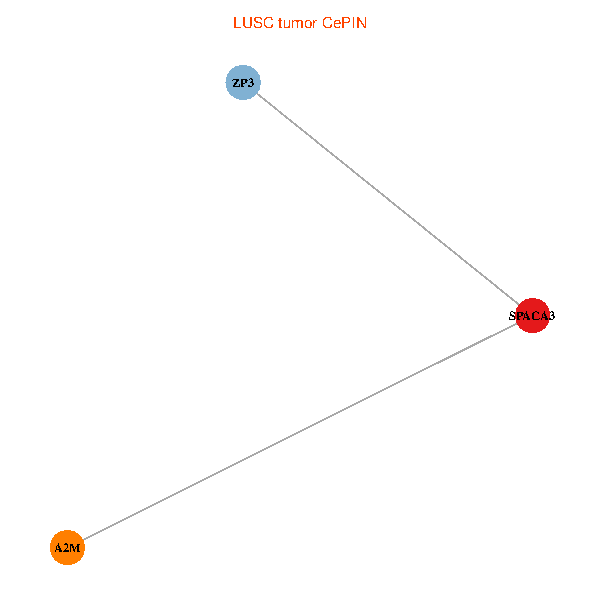
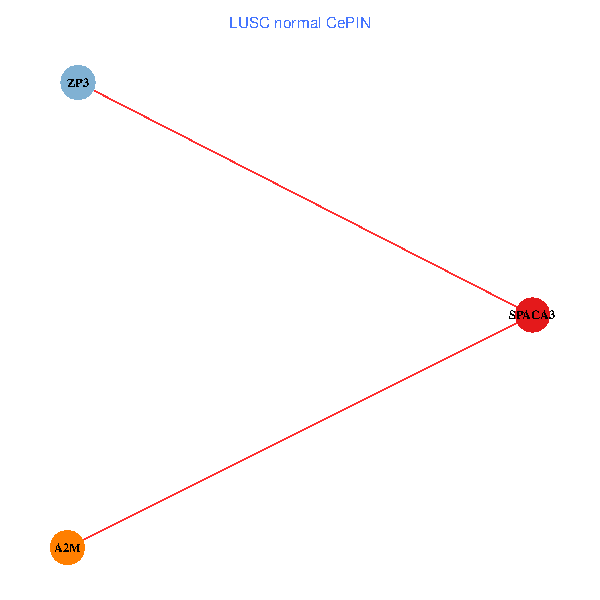
| Co-expressed gene networks based on protein-protein interaction data (CePIN) (TCGA IlluminaHiSeq_RNASeqV2, pan-cancer normalized log2(norm_counts+1) data, version 2016-08-16) (PINA2 ppi data) |
| BRCA (tumor) | BRCA (normal) |
| SPACA3, ZP3, A2M (tumor) | SPACA3, ZP3, A2M (normal) |
 |  |
| COAD (tumor) | COAD (normal) |
| SPACA3, ZP3, A2M (tumor) | SPACA3, ZP3, A2M (normal) |
 |  |
| HNSC (tumor) | HNSC (normal) |
| SPACA3, ZP3, A2M (tumor) | SPACA3, ZP3, A2M (normal) |
 |  |
| KICH (tumor) | KICH (normal) |
| SPACA3, ZP3, A2M (tumor) | SPACA3, ZP3, A2M (normal) |
 |  |
| KIRC (tumor) | KIRC (normal) |
| SPACA3, ZP3, A2M (tumor) | SPACA3, ZP3, A2M (normal) |
 |  |
| KIRP (tumor) | KIRP (normal) |
| SPACA3, ZP3, A2M (tumor) | SPACA3, ZP3, A2M (normal) |
 |  |
| LIHC (tumor) | LIHC (normal) |
| SPACA3, ZP3, A2M (tumor) | SPACA3, ZP3, A2M (normal) |
 |  |
| LUAD (tumor) | LUAD (normal) |
| SPACA3, ZP3, A2M (tumor) | SPACA3, ZP3, A2M (normal) |
 |  |
| LUSC (tumor) | LUSC (normal) |
| SPACA3, ZP3, A2M (tumor) | SPACA3, ZP3, A2M (normal) |
 |  |
| PRAD (tumor) | PRAD (normal) |
| SPACA3, ZP3, A2M (tumor) | SPACA3, ZP3, A2M (normal) |
 |  |
| STAD (tumor) | STAD (normal) |
| SPACA3, ZP3, A2M (tumor) | SPACA3, ZP3, A2M (normal) |
 |  |
| THCA (tumor) | THCA (normal) |
| SPACA3, ZP3, A2M (tumor) | SPACA3, ZP3, A2M (normal) |
 |  |
| Top |
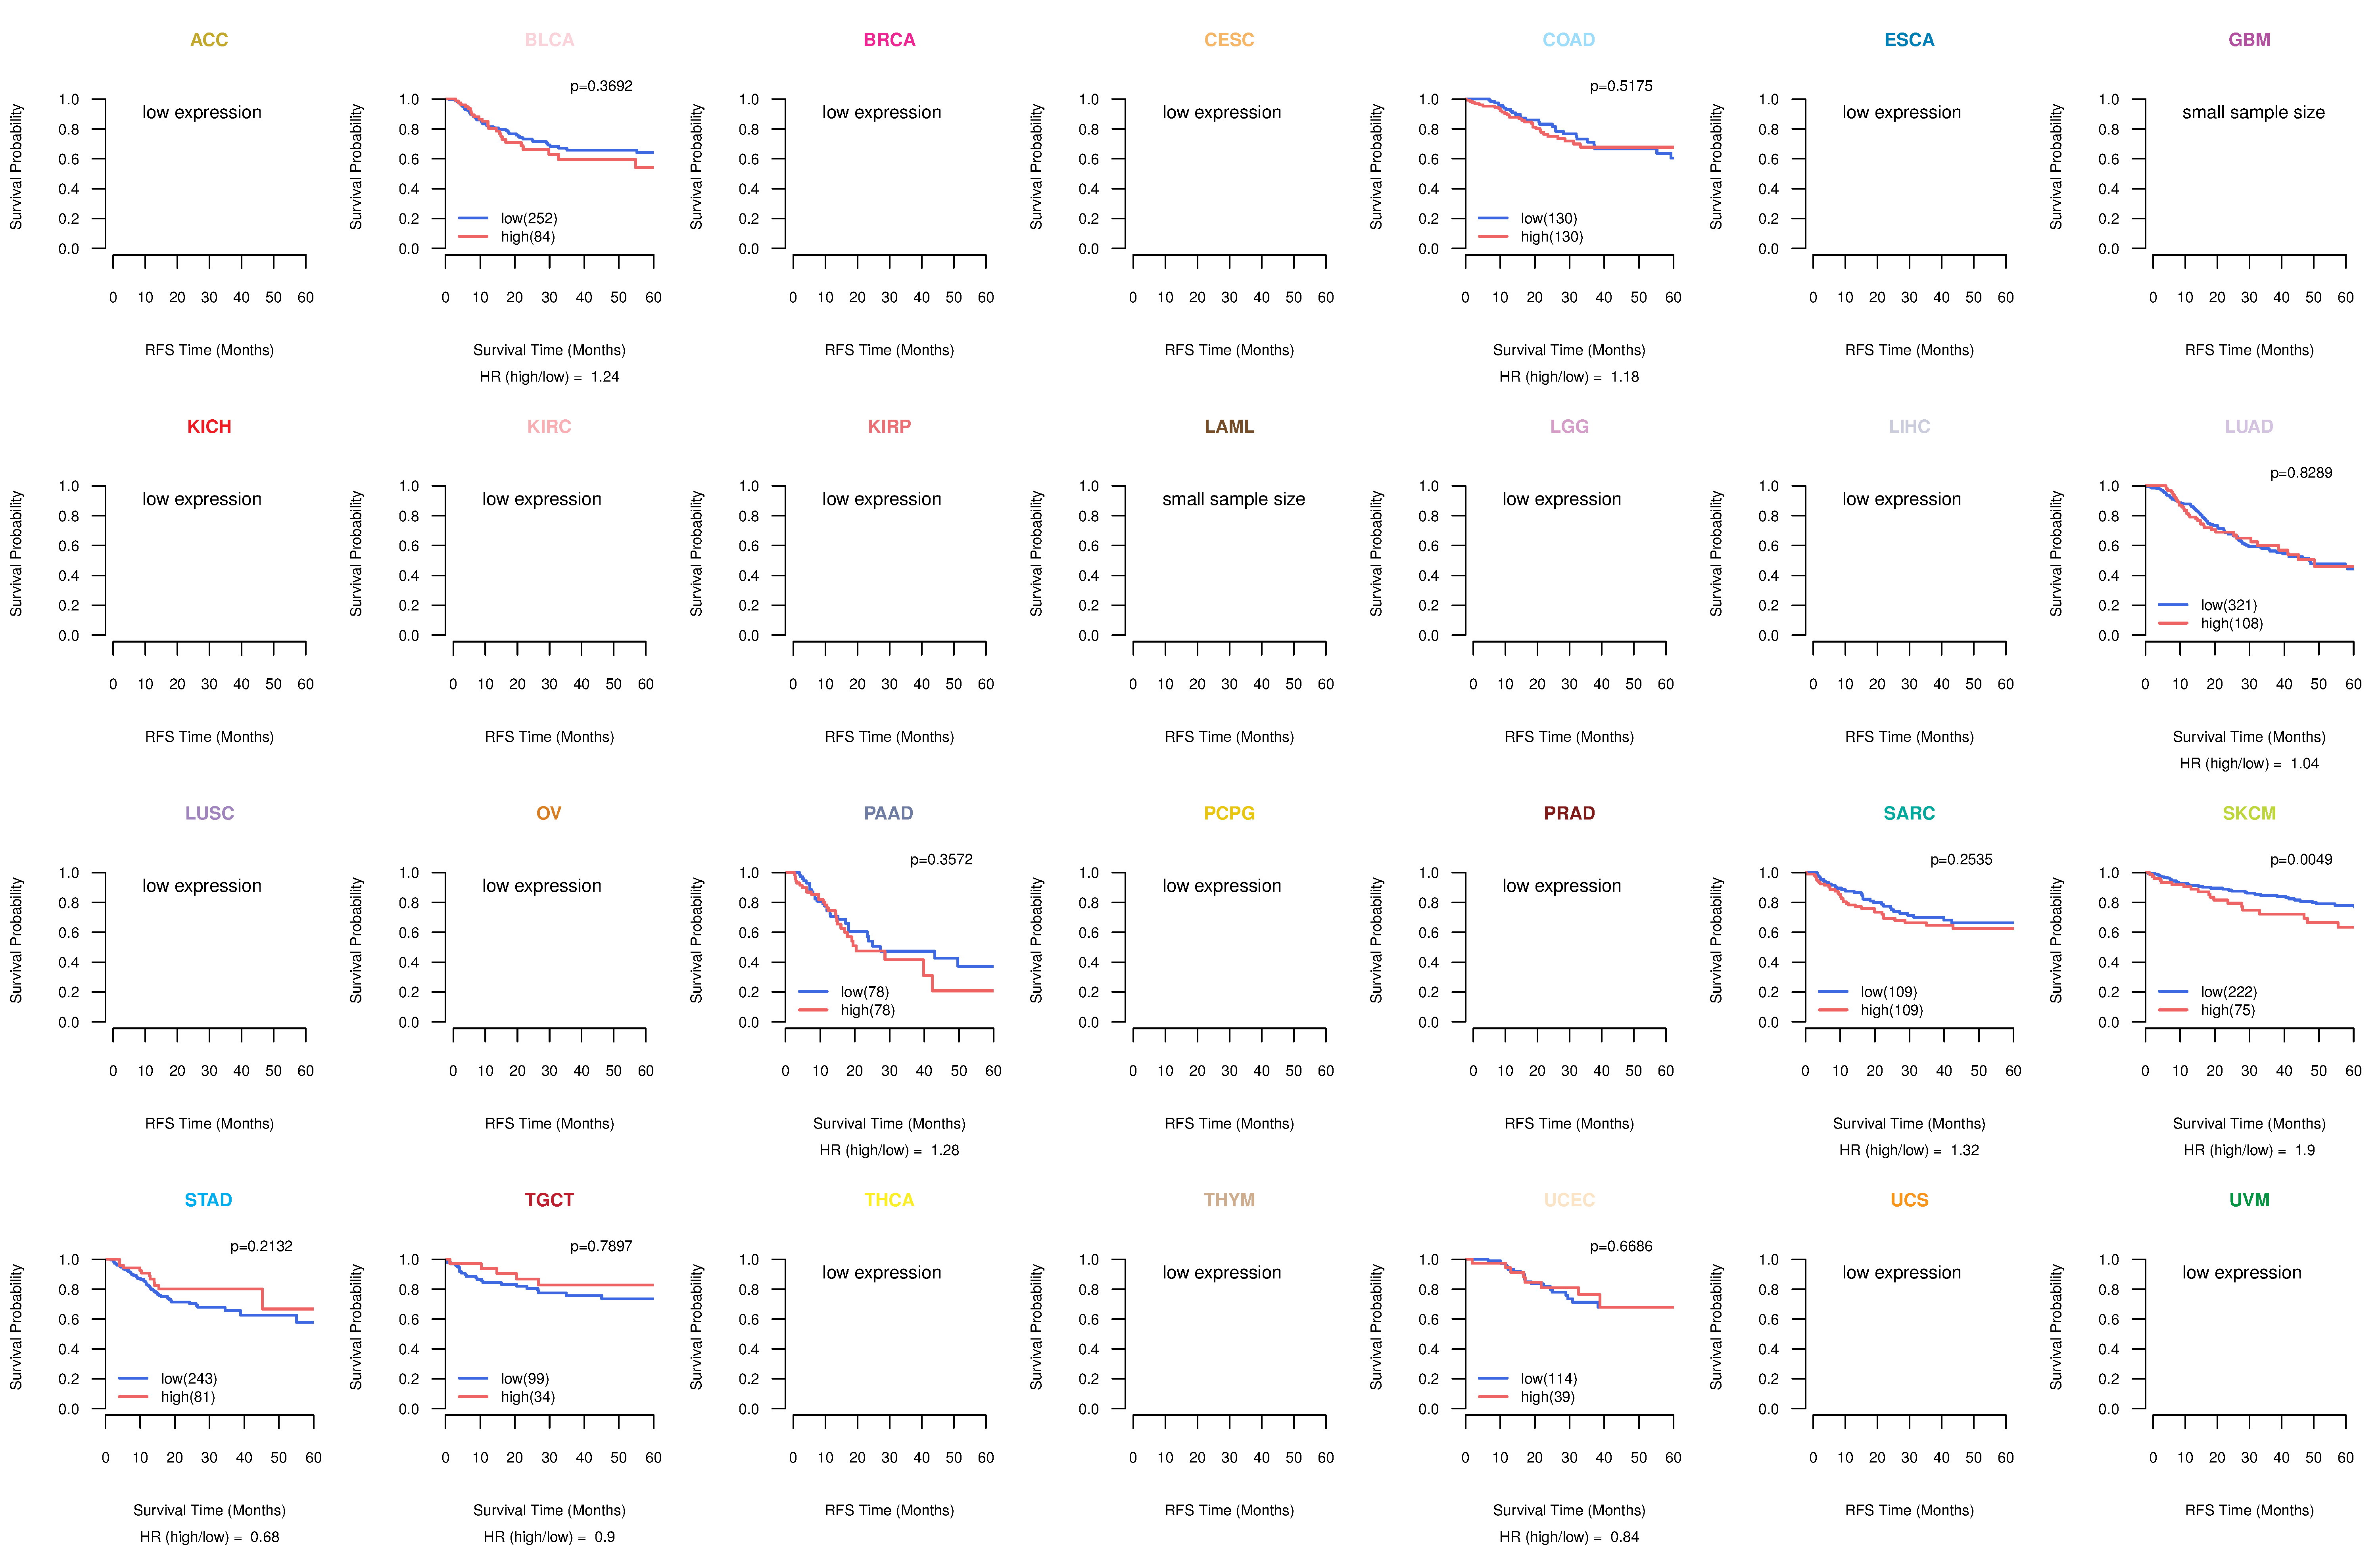
| TissGeneProg for SPACA3 |
| Kaplan-Meier plots with logrank tests of overall survival (OS) using 28 cancer types (TCGA IlluminaHiSeq_RNASeqV2, pan-cancer normalized log2(norm_counts+1) data, version 2016-08-16) (TCGA clinicalMatrix, phenotype data, version 2016-04-27) * Click on the image to enlarge it in a new window. |
 |
| Kaplan-Meier plots with logrank test of relapse free survival (RFS) using 28 cancer types (TCGA IlluminaHiSeq_RNASeqV2, pan-cancer normalized log2(norm_counts+1) data, version 2016-08-16) (TCGA clinicalMatrix, phenotype data, version 2016-04-27) * Click on the image enlarge it in a new window. |
 |
| Forest plot of Cox proportional hazard ratio (HR) and 95% CI of overall survival (OS) using 28 cancer types (TCGA IlluminaHiSeq_RNASeqV2, pan-cancer normalized log2(norm_counts+1) data, version 2016-08-16) (TCGA clinicalMatrix, phenotype data, version 2016-04-27) * Click on the image enlarge it in a new window. |
 |
| Forest plot of Cox proportional hazard ratio (HR) and 95% CI of relapse free survival (RFS) using 28 cancer types (TCGA IlluminaHiSeq_RNASeqV2, pan-cancer normalized log2(norm_counts+1) data, version 2016-08-16) (TCGA clinicalMatrix, phenotype data, version 2016-04-27) * Click on the image enlarge it in a new window. |
 |
| Top |
| TissGeneClin for SPACA3 |
| TissGeneDrug for SPACA3 |
| Drug information targeting TissGene (DrugBank Version 5.0.6, 2017-04-01) |
| DrugBank ID | Drug name | Drug activity | Drug type | Drug status |
| Top |
| TissGeneDisease for SPACA3 |
| Disease information associated with TissGene (DisGeNet, 2016-06-01) |
| Disease ID | Disease name | # pubmeds | Source |
| umls:C0153594 | Malignant neoplasm of testis | 1 | BeFree |
| umls:C0376545 | Hematologic Neoplasms | 1 | BeFree |
|
Copyright 2016-Present - The University of Texas Health Science Center at Houston (UTHealth) Web File Viewing | How to Report, Fraud, Waste and Abuse | State of Texas | Statewide Search | Texas Homeland Security | Site Policies |