 |
| |
| |
| |
| |
| |
| |
|

| TissGeneSummary for CNGA1 |
 Gene summary Gene summary |
| Basic gene information | Gene symbol | CNGA1 |
| Gene name | cyclic nucleotide gated channel alpha 1 | |
| Synonyms | CNCG|CNCG1|CNG-1|CNG1|RCNC1|RCNCa|RCNCalpha|RP49 | |
| Cytomap | UCSC genome browser: 4p12 | |
| Type of gene | protein-coding | |
| RefGenes | NM_000087.3, NM_001142564.1, | |
| Description | CNG channel alpha-1cGMP-gated cation channel alpha-1cyclic nucleotide-gated cation channel 1cyclic nucleotide-gated channel alpha-1cyclic nucleotide-gated channel, photoreceptorinterleukin-1 homologuerod photoreceptor cGMP-gated channel subunit alph | |
| Modification date | 20141219 | |
| dbXrefs | MIM : 123825 | |
| HGNC : HGNC | ||
| Ensembl : ENSG00000198515 | ||
| HPRD : 00445 | ||
| Vega : OTTHUMG00000160668 | ||
| Protein | UniProt: go to UniProt's Cross Reference DB Table | |
| Expression | CleanEX: HS_CNGA1 | |
| BioGPS: 1259 | ||
| Pathway | NCI Pathway Interaction Database: CNGA1 | |
| KEGG: CNGA1 | ||
| REACTOME: CNGA1 | ||
| Pathway Commons: CNGA1 | ||
| Context | iHOP: CNGA1 | |
| ligand binding site mutation search in PubMed: CNGA1 | ||
| UCL Cancer Institute: CNGA1 | ||
| Assigned class in TissGDB* | C | |
| Included tissue-specific gene expression resources | TiGER,GTEx | |
| Specific-tissues in normal samples (assigned by TissGDB using HPA, TiGER, and GTEx) | LiverEye | |
| Cancer types related to the specific-tissues in cancer samples (assigned by TissGDB using TCGA) | LIHCUVM | |
| Reference showing the relevant tissue of CNGA1 | ||
| Description by TissGene annotations | ||
| * Class A consists of genes with literature evidence and is part of the cTissGenes. Class B consists of only cTissGenes without additional evidence. The remaining genes belong to Class C. |
| Gene ontology having evidence of Inferred from Direct Assay (IDA) from Entrez |
| GO ID | GO term | PubMed ID |
| Top |
| TissGeneExp for CNGA1 |
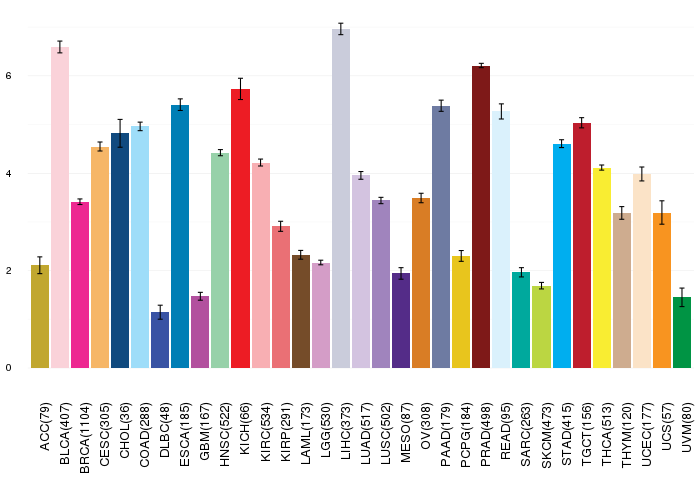
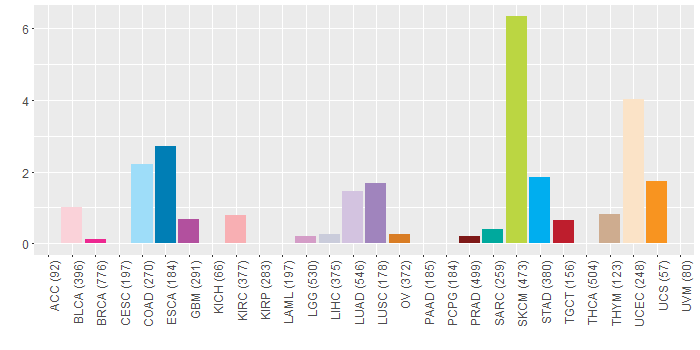
| Gene expressions across 28 cancer types (X-axis: cancer type and Y-axis: log2(norm_counts+1)) (TCGA IlluminaHiSeq_RNASeqV2, pan-cancer normalized log2(norm_counts+1) data, version 2016-08-16) |
 |
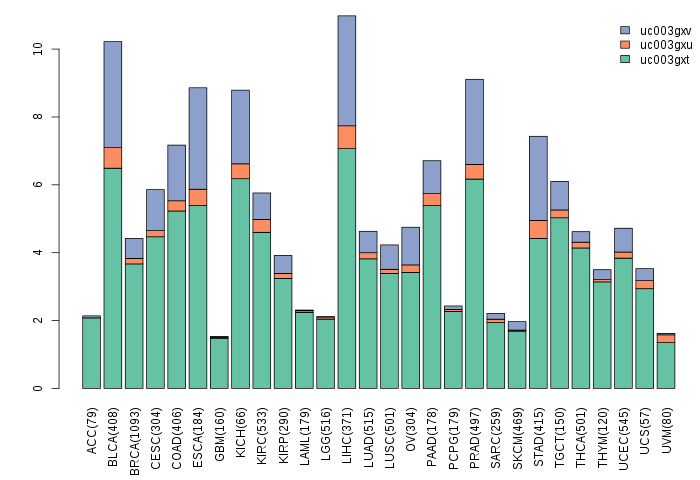
| Gene isoform expressions across 28 cancer types (X-axis: cancer type and Y-axis: log2(norm_counts+1)) (TCGA pan-cancer tcga_rsem_isoform_tpm, version 2016-09-01) |
 |
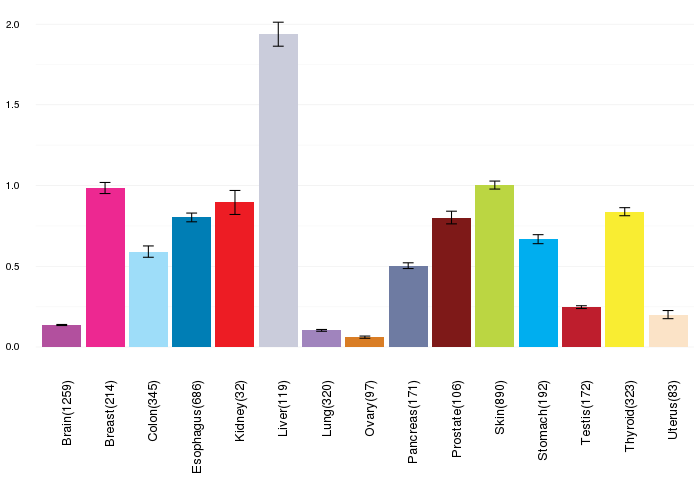
| Gene expressions across normal tissues of GTEx data (GTEx GTEx_Analysis_v6_RNA-seq_RNA-SeQCv1.1.8_gene_rpkm.gct) - Here, we shows the matched tissue types only among our 28 cancer types. |
 |
| Different expressions across 14 cancer types with more than 10 samples between matched tumors and normals (X-axis: cancer type and Y-axis: log2(norm_counts+1)) (TCGA IlluminaHiSeq_RNASeqV2, pan-cancer normalized log2(norm_counts+1) data, version 2016-08-16) |
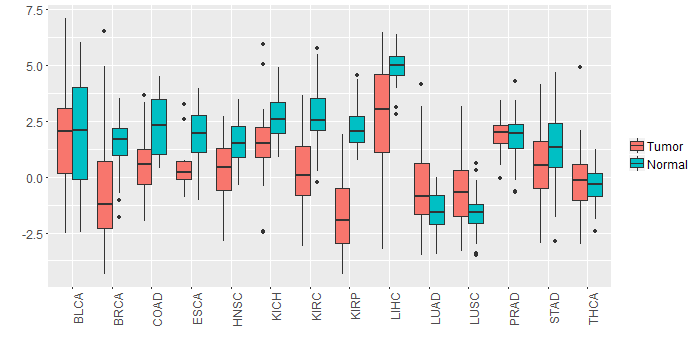 |
| - Significantly differentially expressed cancer types and information. (|Fold change|>1 and FDR<0.05) |
| Cancer type | Mean(exp) in tumor | Mean(exp) in matched normal | Log2FC | P-val. | FDR |
| LIHC | 2.673050186 | 4.984482186 | -2.311432 | 1.18E-07 | 8.14E-07 |
| BRCA | -0.787535849 | 1.4786738 | -2.266209649 | 1.13E-18 | 7.30E-18 |
| COAD | 0.611101263 | 2.36199357 | -1.750892308 | 1.35E-05 | 6.02E-05 |
| LUAD | -0.405371814 | -1.553989056 | 1.148617241 | 1.15E-05 | 3.35E-05 |
| HNSC | 0.297684 | 1.547132837 | -1.249448837 | 3.73E-06 | 2.41E-05 |
| KIRP | -1.873290564 | 2.301253186 | -4.17454375 | 3.04E-17 | 1.31E-15 |
| KIRC | 0.08077263 | 2.830364297 | -2.749591667 | 1.18E-23 | 1.25E-22 |
| KICH | 1.481016186 | 2.700912186 | -1.219896 | 0.00649 | 0.012142581 |
| Top |
| TissGene-miRNA for CNGA1 |
| Significantly anti-correlated miRNAs of TissGene across 28 cancer types (Gene-miRNA relations from TargetScanHuman Relsease 7.1, Conserved_Site_Context_Scores.txt.zip, 06.01.2016) (TCGA IlluminaHiSeq_miRNASeq, log2(RPM+1) data, version 2016-11-21) (TCGA IlluminaHiSeq_RNASeqV2, log2(normalized_count+1) data, version 2016-08-16) (Spearman’s Rank Correlation (p-value<0.05 and coefficient<-0.25)) |
| Cancer type | miRNA id | miRNA accession | P-val. | Coeff. | # samples |
| Top |
| TissGeneMut for CNGA1 |
| TissGeneSNV for CNGA1 |
| nsSNV counts per each loci. Different colors of circles represent different cancer types. Circle size denotes number of samples. (TCGA somatic mutation (SNPs and small INDELs) data, version 2016-04-25) * Click on the image to enlarge it in a new window. |
 |
 |
| Somatic nucleotide variants of TissGene across 28 cancer types (X-axis: cancer type and Y-axis: % of mutated samples) The numbers in parentheses are numbers of samples with mutation (nsSNVs). (TCGA somatic mutation (SNPs and small INDELs) data, version 2016-04-25) |
 |
| - nsSNVs sorted by frequency. |
| AAchange | Cancer type | # samples |
| p.R698Q | SKCM | 3 |
| p.S134F | SKCM | 2 |
| p.R629* | SKCM | 2 |
| p.G623E | SKCM | 2 |
| p.R629Q | SKCM | 2 |
| p.E127K | SKCM | 2 |
| p.K348N | SKCM | 1 |
| p.R493* | SKCM | 1 |
| p.I461N | HNSC | 1 |
| p.M70I | SKCM | 1 |
| p.I380F | LUAD | 1 |
| p.M103K | LUAD | 1 |
| p.K208N | UCEC | 1 |
| p.V517F | LUSC | 1 |
| p.I506F | LGG | 1 |
| p.D283N | UCEC | 1 |
| p.D609N | UCEC | 1 |
| p.R478H | HNSC | 1 |
| p.S279F | BLCA | 1 |
| p.G701E | SKCM | 1 |
| p.R287Q | SKCM | 1 |
| p.T729N | GBM | 1 |
| p.P364Q | CHOL | 1 |
| p.G143V | SKCM | 1 |
| p.F423L | STAD | 1 |
| p.G231E | SKCM | 1 |
| p.D283N | STAD | 1 |
| p.M374V | LIHC | 1 |
| p.P153H | SKCM | 1 |
| p.D318E | TGCT | 1 |
| p.R547H | HNSC | 1 |
| p.K661E | STAD | 1 |
| p.I469L | STAD | 1 |
| p.K417N | SKCM | 1 |
| p.D118N | COAD | 1 |
| p.D194N | SKCM | 1 |
| p.H539N | SKCM | 1 |
| p.S65F | SKCM | 1 |
| p.D215N | SKCM | 1 |
| p.R712Q | UCEC | 1 |
| p.L293R | KIRC | 1 |
| p.D372N | HNSC | 1 |
| p.D441N | SKCM | 1 |
| p.R478H | STAD | 1 |
| p.E700V | KIRC | 1 |
| p.R629Q | UCEC | 1 |
| p.L293V | LUAD | 1 |
| p.I713M | SKCM | 1 |
| p.R640S | STAD | 1 |
| p.I400L | STAD | 1 |
| p.L224V | LUAD | 1 |
| p.A477E | BRCA | 1 |
| p.M468I | SKCM | 1 |
| p.R280G | LUAD | 1 |
| p.Y247D | BLCA | 1 |
| p.P502T | HNSC | 1 |
| p.K497I | UCEC | 1 |
| p.V477A | STAD | 1 |
| p.C257R | LUAD | 1 |
| p.K661N | UCEC | 1 |
| p.E223V | KIRC | 1 |
| p.R280C | COAD | 1 |
| p.A415D | SKCM | 1 |
| p.E125D | UCEC | 1 |
| p.K221N | UCEC | 1 |
| p.R514Q | COAD | 1 |
| p.R218Q | SKCM | 1 |
| p.I575F | LGG | 1 |
| p.K730E | STAD | 1 |
| p.L650F | ESCA | 1 |
| p.E656D | UCEC | 1 |
| p.N243S | SKCM | 1 |
| p.S230L | BLCA | 1 |
| p.D186Y | SARC | 1 |
| p.R712Q | ESCA | 1 |
| p.R413I | COAD | 1 |
| p.N365K | ESCA | 1 |
| p.G162E | SKCM | 1 |
| p.R287Q | LUSC | 1 |
| p.P620S | SKCM | 1 |
| p.M1I | COAD | 1 |
| p.H470N | SKCM | 1 |
| p.R371K | SKCM | 1 |
| p.R547H | ESCA | 1 |
| p.R344C | COAD | 1 |
| p.K6N | READ | 1 |
| p.E58K | SKCM | 1 |
| p.R349G | LUAD | 1 |
| p.D441N | HNSC | 1 |
| p.K505T | UCS | 1 |
| p.F354I | STAD | 1 |
| p.P89S | ESCA | 1 |
| p.G632E | SKCM | 1 |
| p.R712* | PRAD | 1 |
| p.D214N | STAD | 1 |
| p.L645F | LUSC | 1 |
| p.R413H | GBM | 1 |
| p.F492L | STAD | 1 |
| p.G433D | UCEC | 1 |
| p.V546A | STAD | 1 |
| p.E559Q | LUSC | 1 |
| p.P571T | HNSC | 1 |
| p.V217I | STAD | 1 |
| p.R712Q | BLCA | 1 |
| p.E121K | READ | 1 |
| p.K204T | UCEC | 1 |
| p.D146N | SKCM | 1 |
| p.R440K | SKCM | 1 |
| p.R424X | SKCM | 1 |
| p.G668R | SKCM | 1 |
| p.F285I | STAD | 1 |
| p.S124L | SKCM | 1 |
| p.R343M | UCEC | 1 |
| p.Q262* | SKCM | 1 |
| p.P689S | SKCM | 1 |
| p.E666K | SKCM | 1 |
| p.D372N | SKCM | 1 |
| p.A626S | LUAD | 1 |
| p.A751E | LUAD | 1 |
| p.M399I | SKCM | 1 |
| p.S348F | BLCA | 1 |
| p.N312S | SKCM | 1 |
| p.E220D | LUAD | 1 |
| p.F159S | UCEC | 1 |
| p.P145Q | THYM | 1 |
| p.L461I | OV | 1 |
| p.A346D | SKCM | 1 |
| Top |
| TissGeneCNV for CNGA1 |
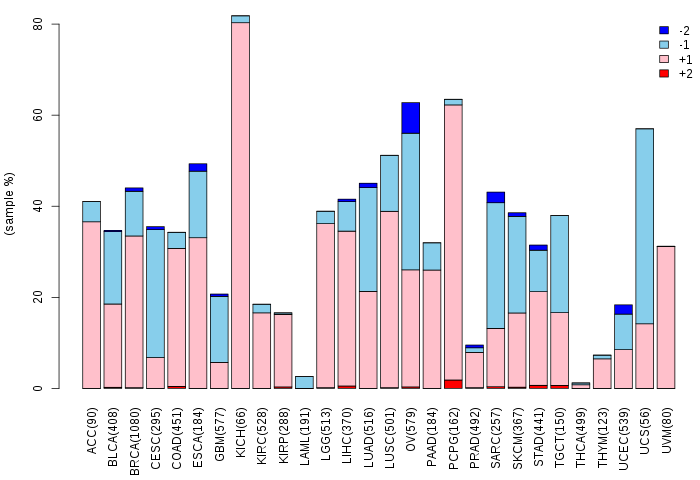
| Copy number variations of TissGene across 28 cancer types (X-axis: cancer type and Y-axis: % of CNV samples) (TCGA Gistic2_CopyNumber_Gistic2_all_data_by_genes, Gistic2 copy number data, version 2016-08-16) |
 |
| Top |
| TissGeneFusions for CNGA1 |
| Fusion genes including TissGene (ChimerDB 3.0, 2016-12-01 and TCGA fusion Portal 2015-12-01) |
| Database | Src | Cancer type | Sample | Fusion gene | ORF | 5'-gene BP | 3'-gene BP |
| Top |
| TissGeneNet for CNGA1 |
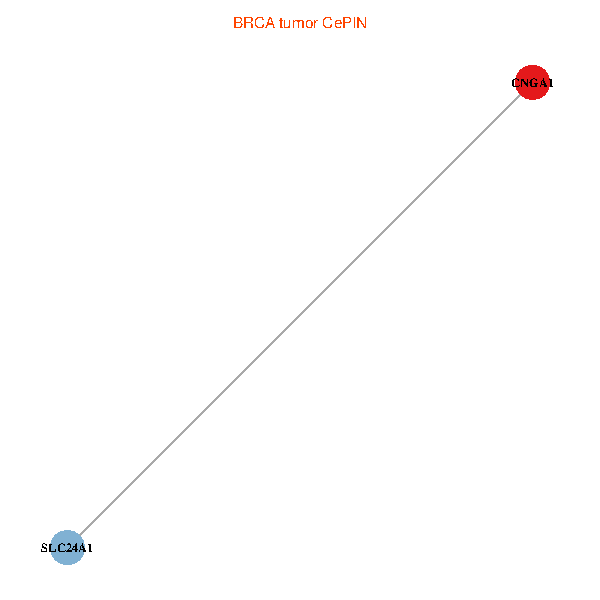
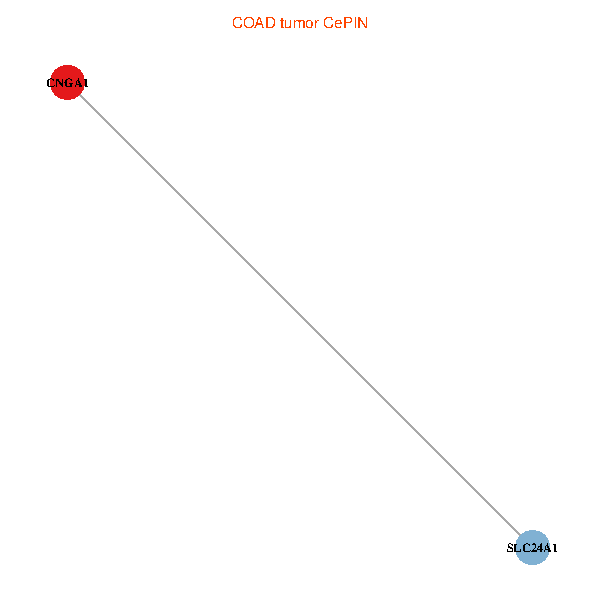
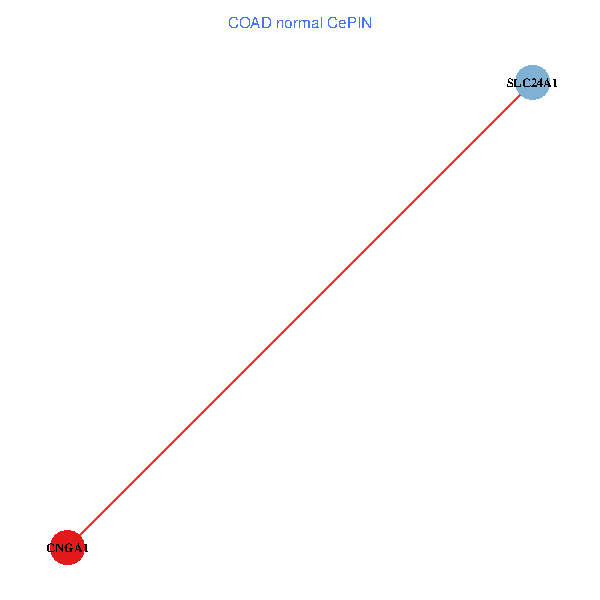
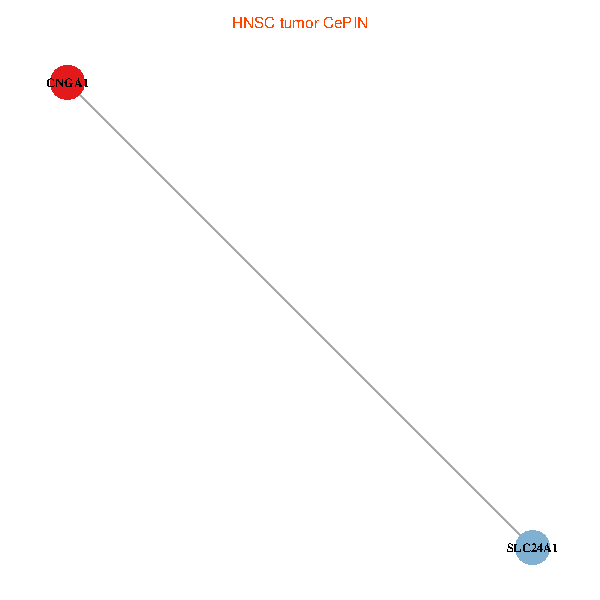
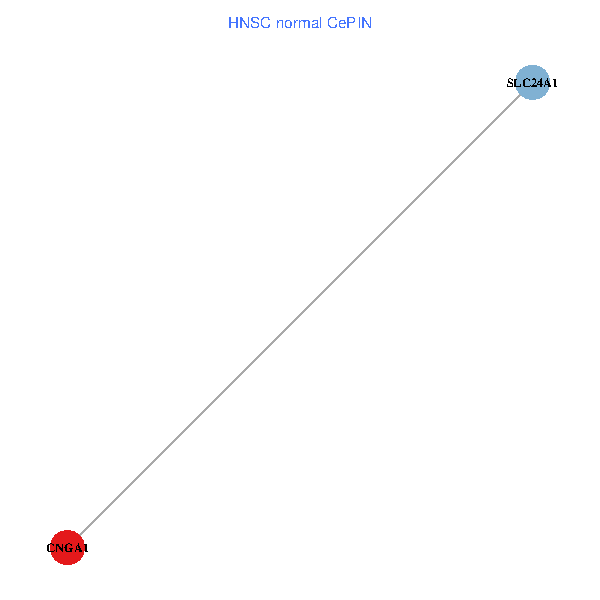
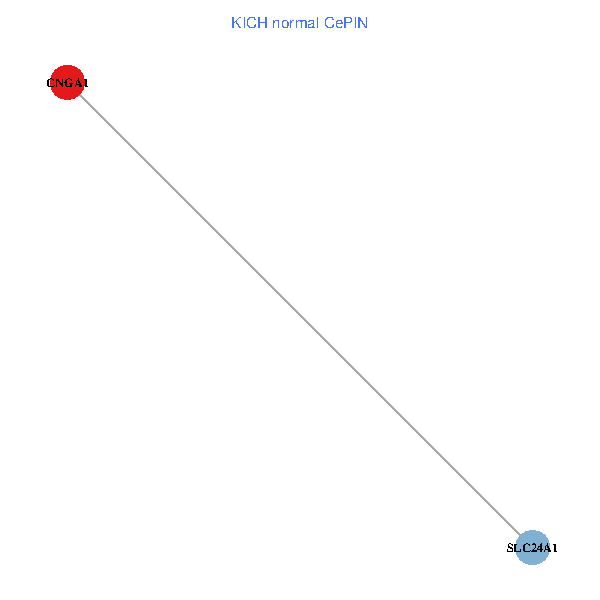
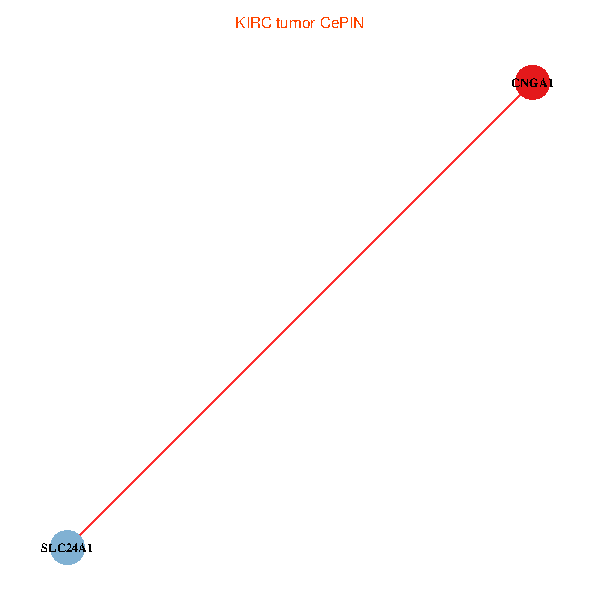
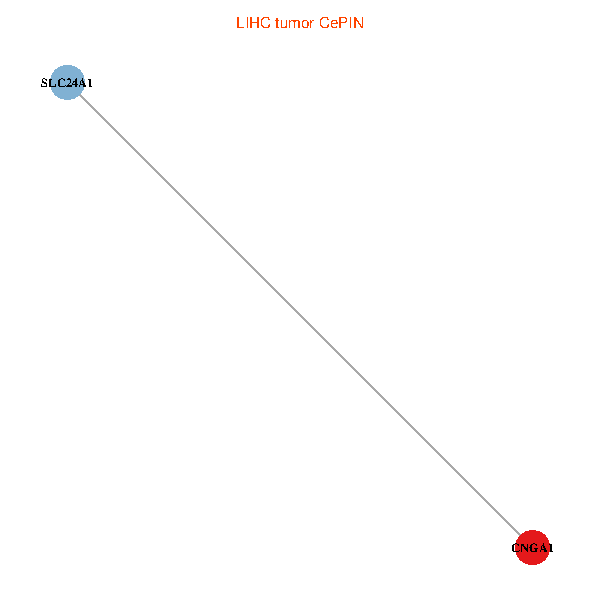
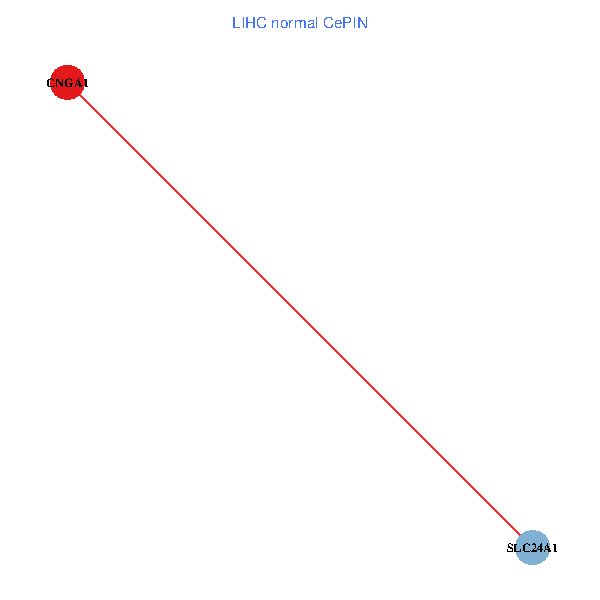
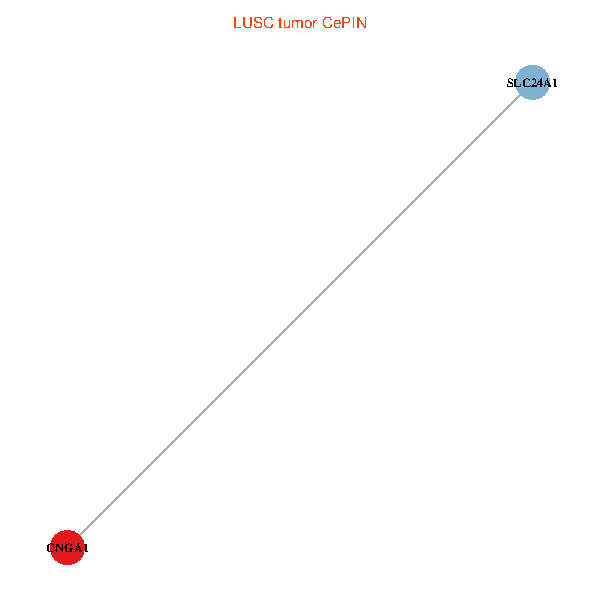
| Co-expressed gene networks based on protein-protein interaction data (CePIN) (TCGA IlluminaHiSeq_RNASeqV2, pan-cancer normalized log2(norm_counts+1) data, version 2016-08-16) (PINA2 ppi data) |
| BRCA (tumor) | BRCA (normal) |
| CNGA1, SLC24A1 (tumor) | CNGA1, SLC24A1 (normal) |
 |  |
| COAD (tumor) | COAD (normal) |
| CNGA1, SLC24A1 (tumor) | CNGA1, SLC24A1 (normal) |
 |  |
| HNSC (tumor) | HNSC (normal) |
| CNGA1, SLC24A1 (tumor) | CNGA1, SLC24A1 (normal) |
 |  |
| KICH (tumor) | KICH (normal) |
| CNGA1, SLC24A1 (tumor) | CNGA1, SLC24A1 (normal) |
 |  |
| KIRC (tumor) | KIRC (normal) |
| CNGA1, SLC24A1 (tumor) | CNGA1, SLC24A1 (normal) |
 |  |
| KIRP (tumor) | KIRP (normal) |
| CNGA1, SLC24A1 (tumor) | CNGA1, SLC24A1 (normal) |
 |  |
| LIHC (tumor) | LIHC (normal) |
| CNGA1, SLC24A1 (tumor) | CNGA1, SLC24A1 (normal) |
 |  |
| LUAD (tumor) | LUAD (normal) |
| CNGA1, SLC24A1 (tumor) | CNGA1, SLC24A1 (normal) |
 |  |
| LUSC (tumor) | LUSC (normal) |
| CNGA1, SLC24A1 (tumor) | CNGA1, SLC24A1 (normal) |
 |  |
| PRAD (tumor) | PRAD (normal) |
| CNGA1, SLC24A1 (tumor) | CNGA1, SLC24A1 (normal) |
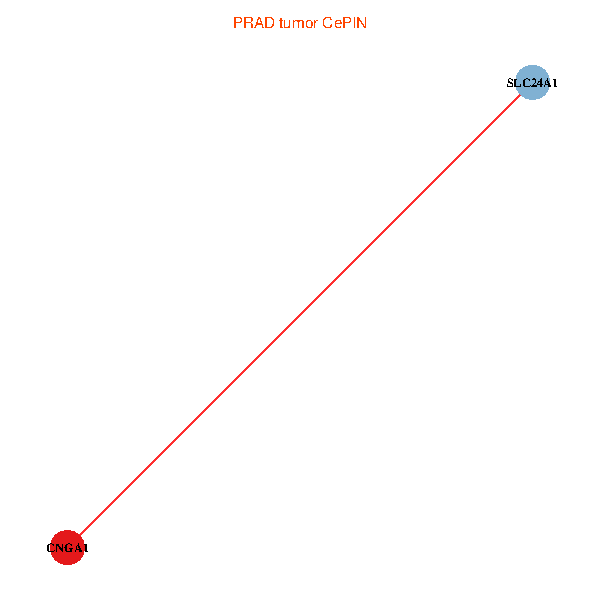 | 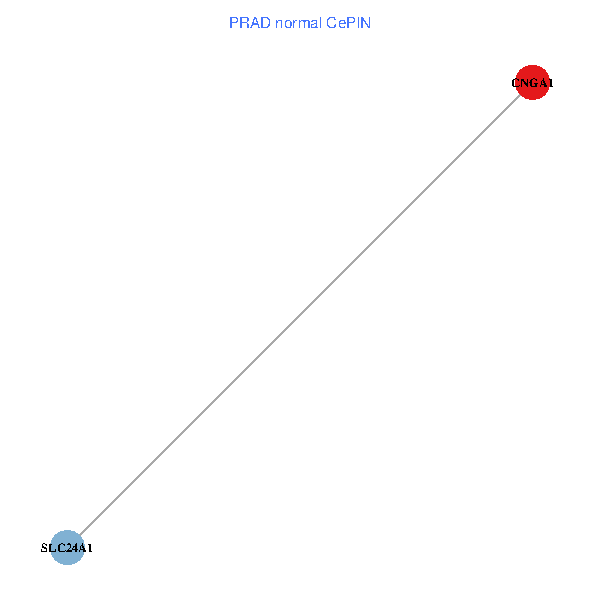 |
| STAD (tumor) | STAD (normal) |
| CNGA1, SLC24A1 (tumor) | CNGA1, SLC24A1 (normal) |
 |  |
| THCA (tumor) | THCA (normal) |
| CNGA1, SLC24A1 (tumor) | CNGA1, SLC24A1 (normal) |
 |  |
| Top |
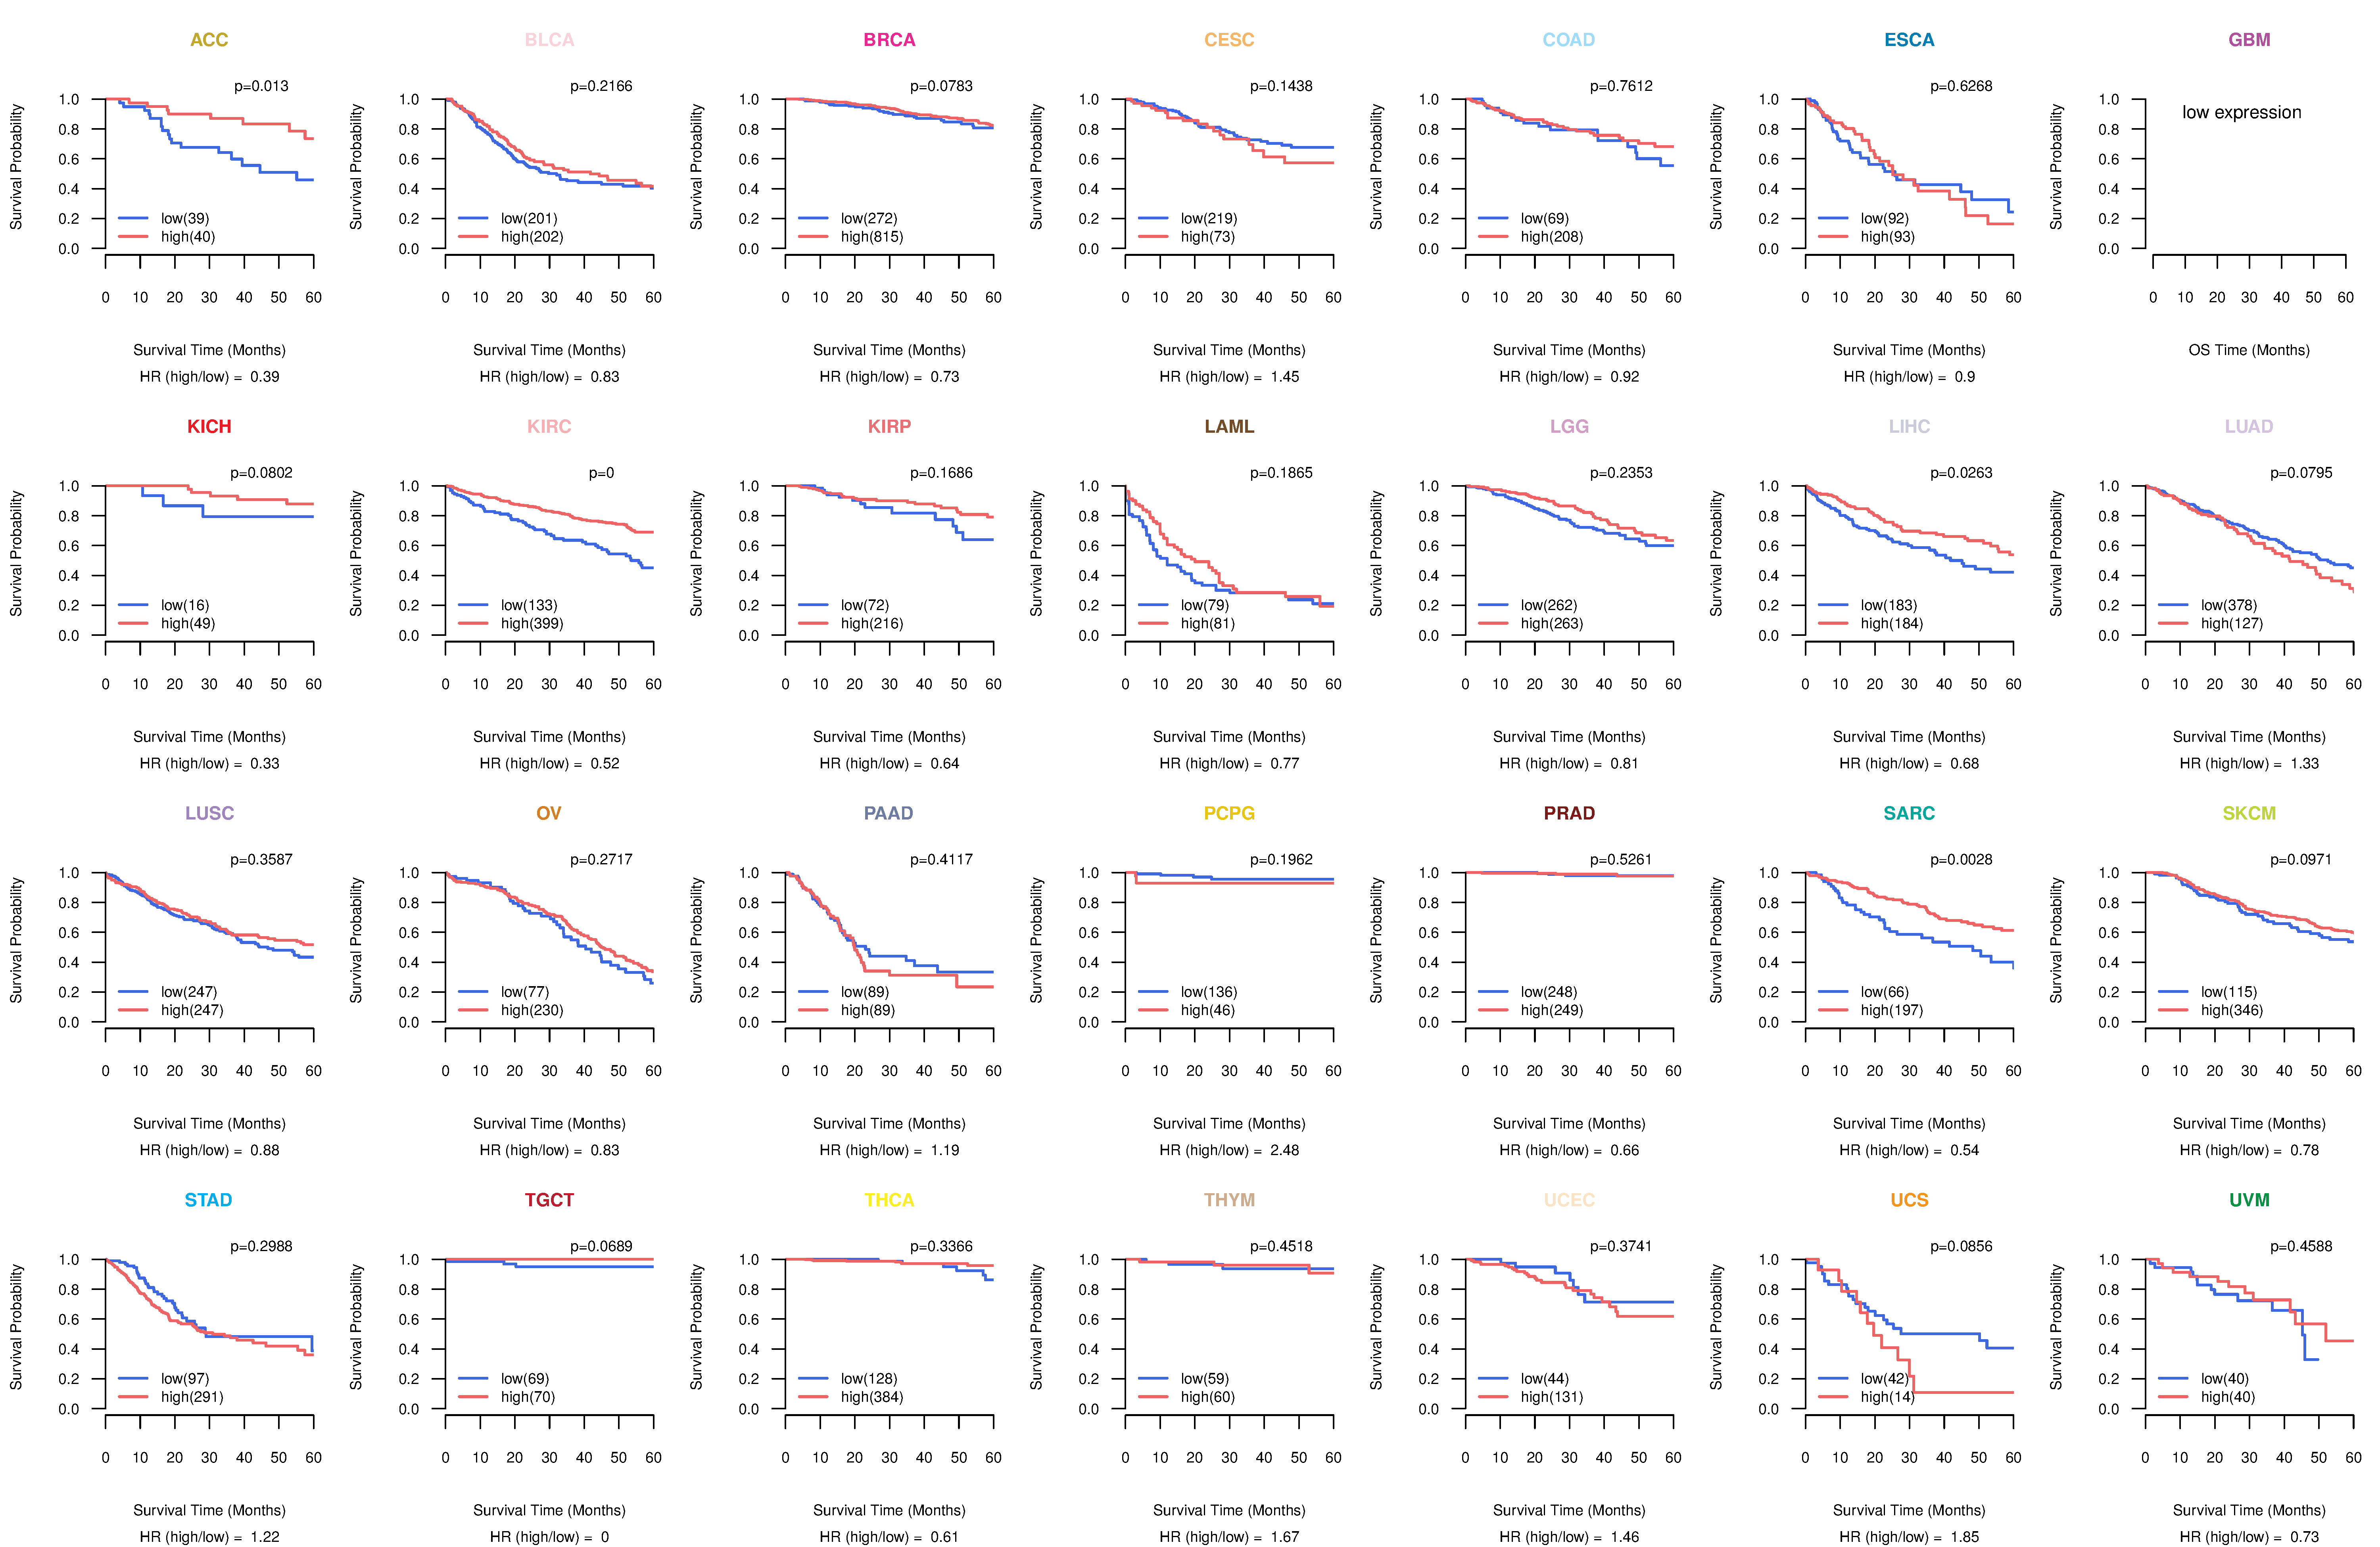
| TissGeneProg for CNGA1 |
| Kaplan-Meier plots with logrank tests of overall survival (OS) using 28 cancer types (TCGA IlluminaHiSeq_RNASeqV2, pan-cancer normalized log2(norm_counts+1) data, version 2016-08-16) (TCGA clinicalMatrix, phenotype data, version 2016-04-27) * Click on the image to enlarge it in a new window. |
 |
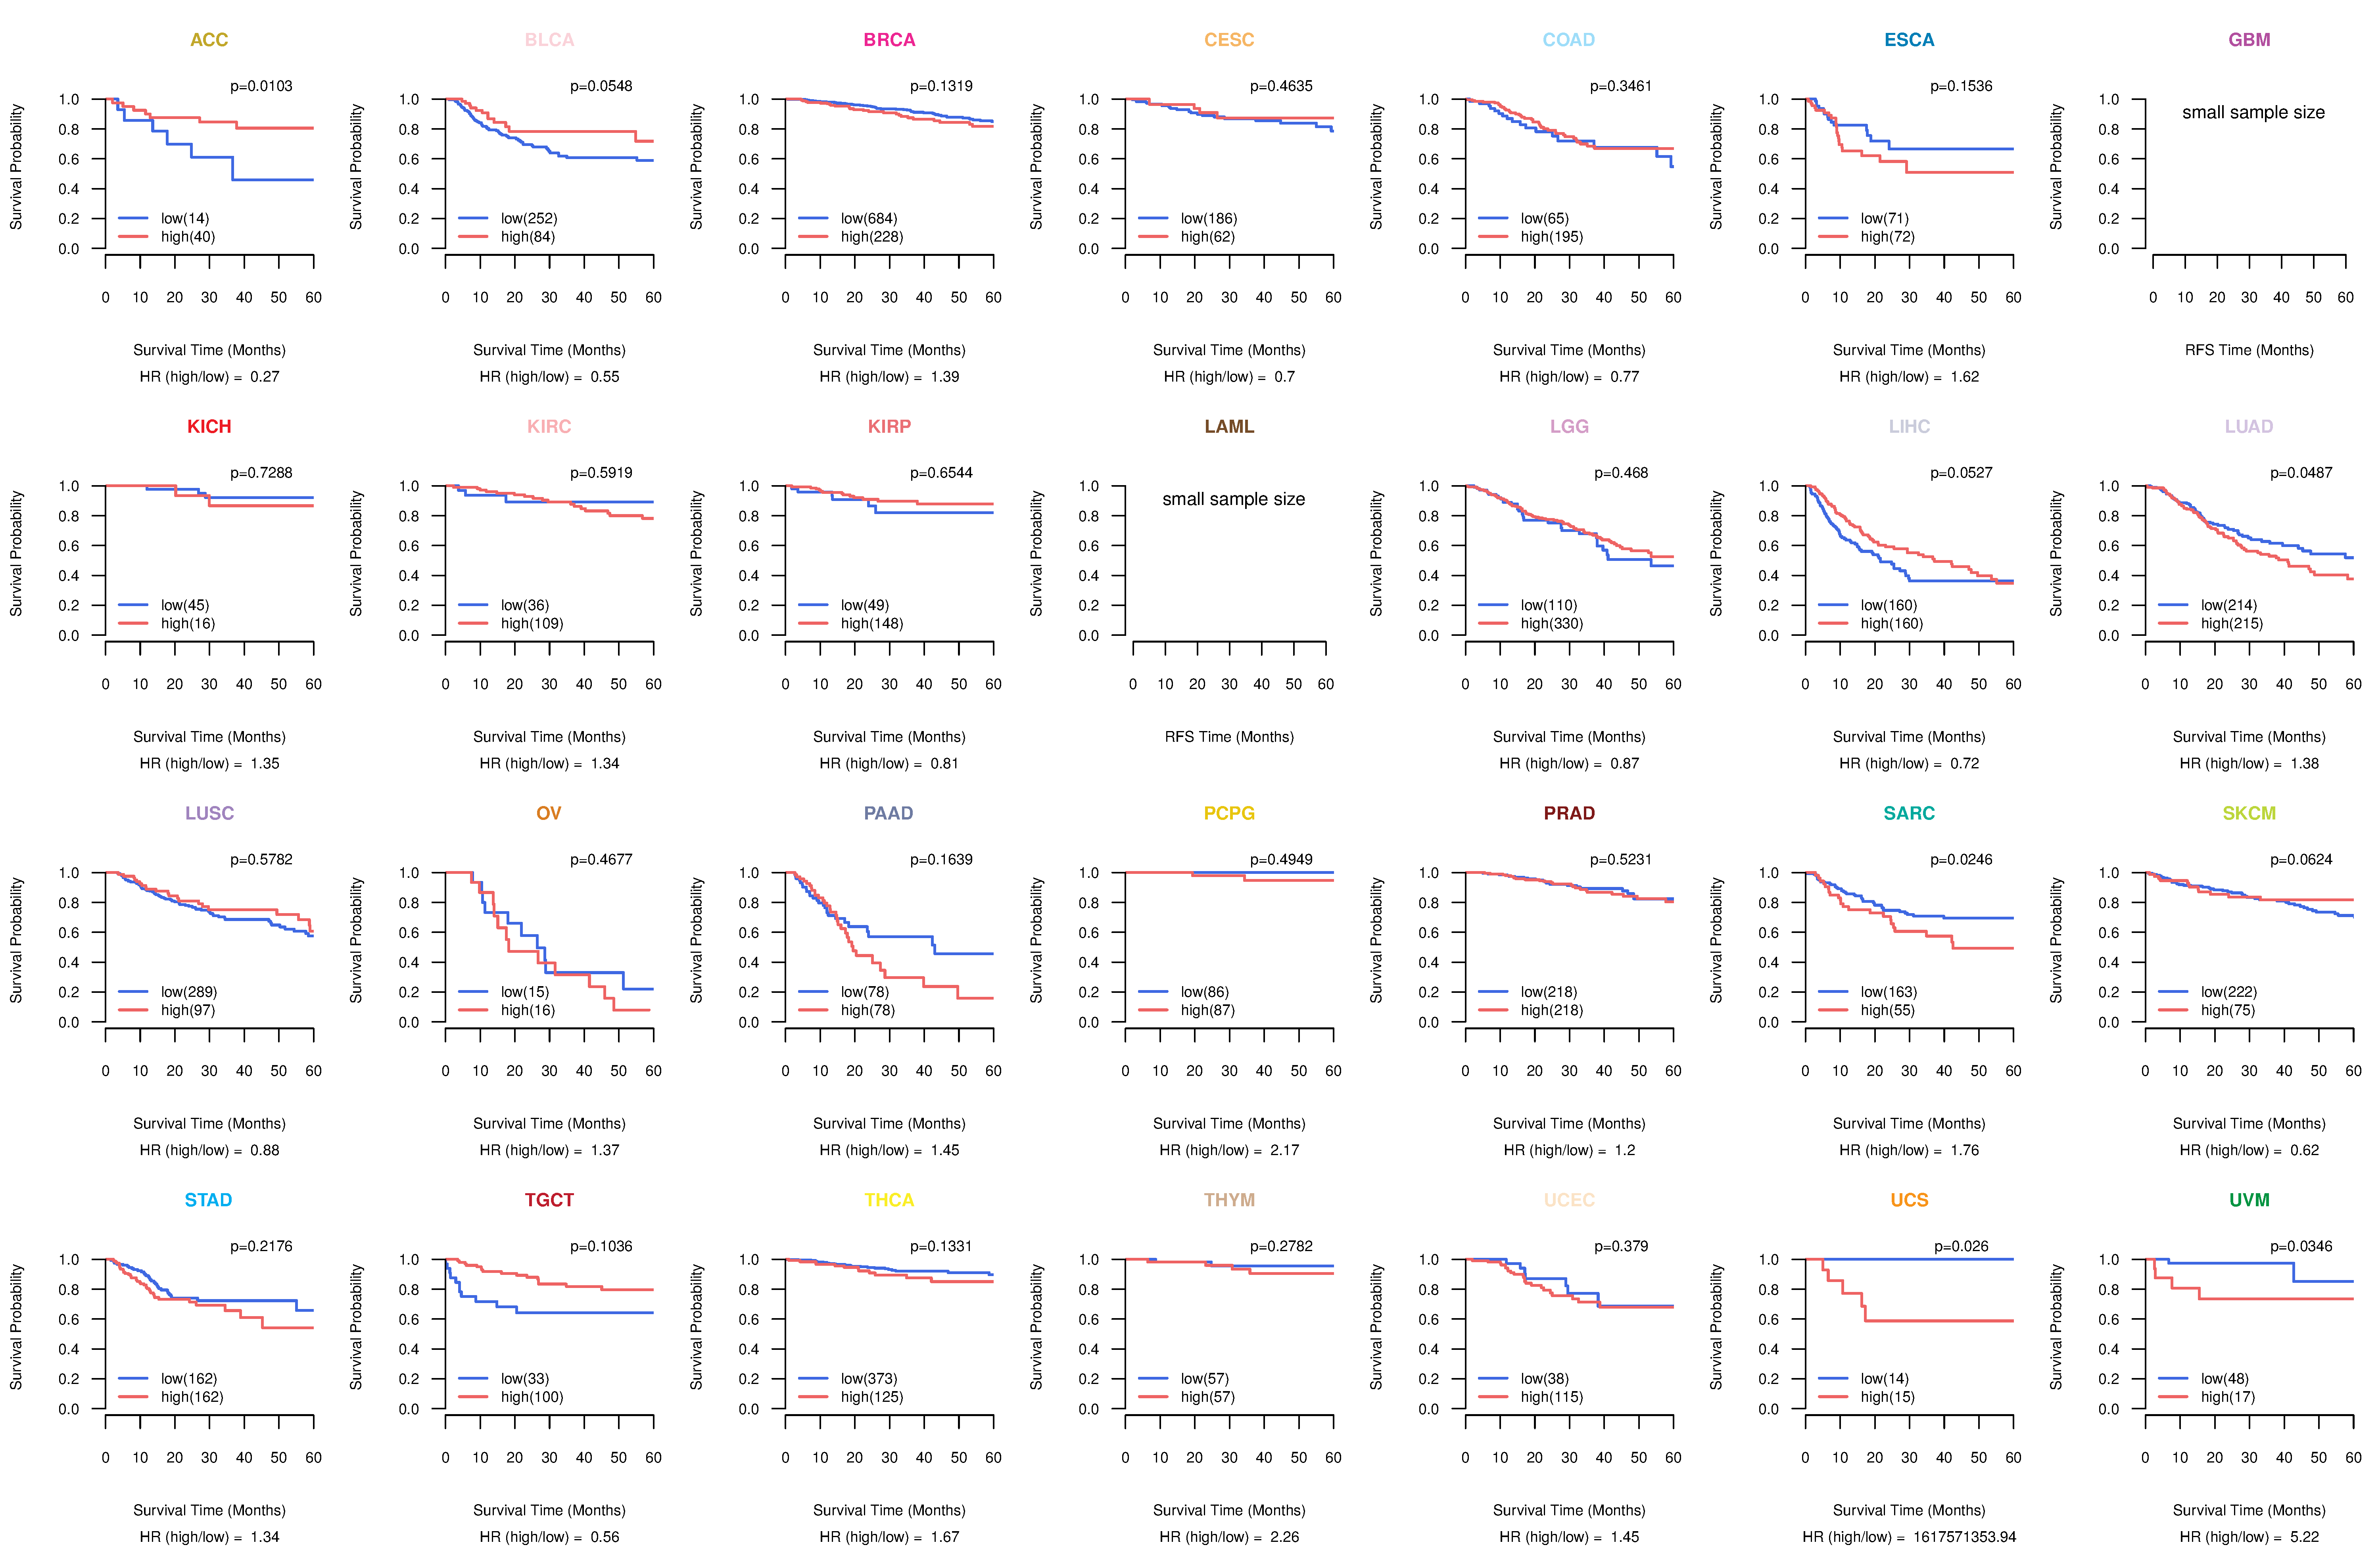
| Kaplan-Meier plots with logrank test of relapse free survival (RFS) using 28 cancer types (TCGA IlluminaHiSeq_RNASeqV2, pan-cancer normalized log2(norm_counts+1) data, version 2016-08-16) (TCGA clinicalMatrix, phenotype data, version 2016-04-27) * Click on the image enlarge it in a new window. |
 |
| Forest plot of Cox proportional hazard ratio (HR) and 95% CI of overall survival (OS) using 28 cancer types (TCGA IlluminaHiSeq_RNASeqV2, pan-cancer normalized log2(norm_counts+1) data, version 2016-08-16) (TCGA clinicalMatrix, phenotype data, version 2016-04-27) * Click on the image enlarge it in a new window. |
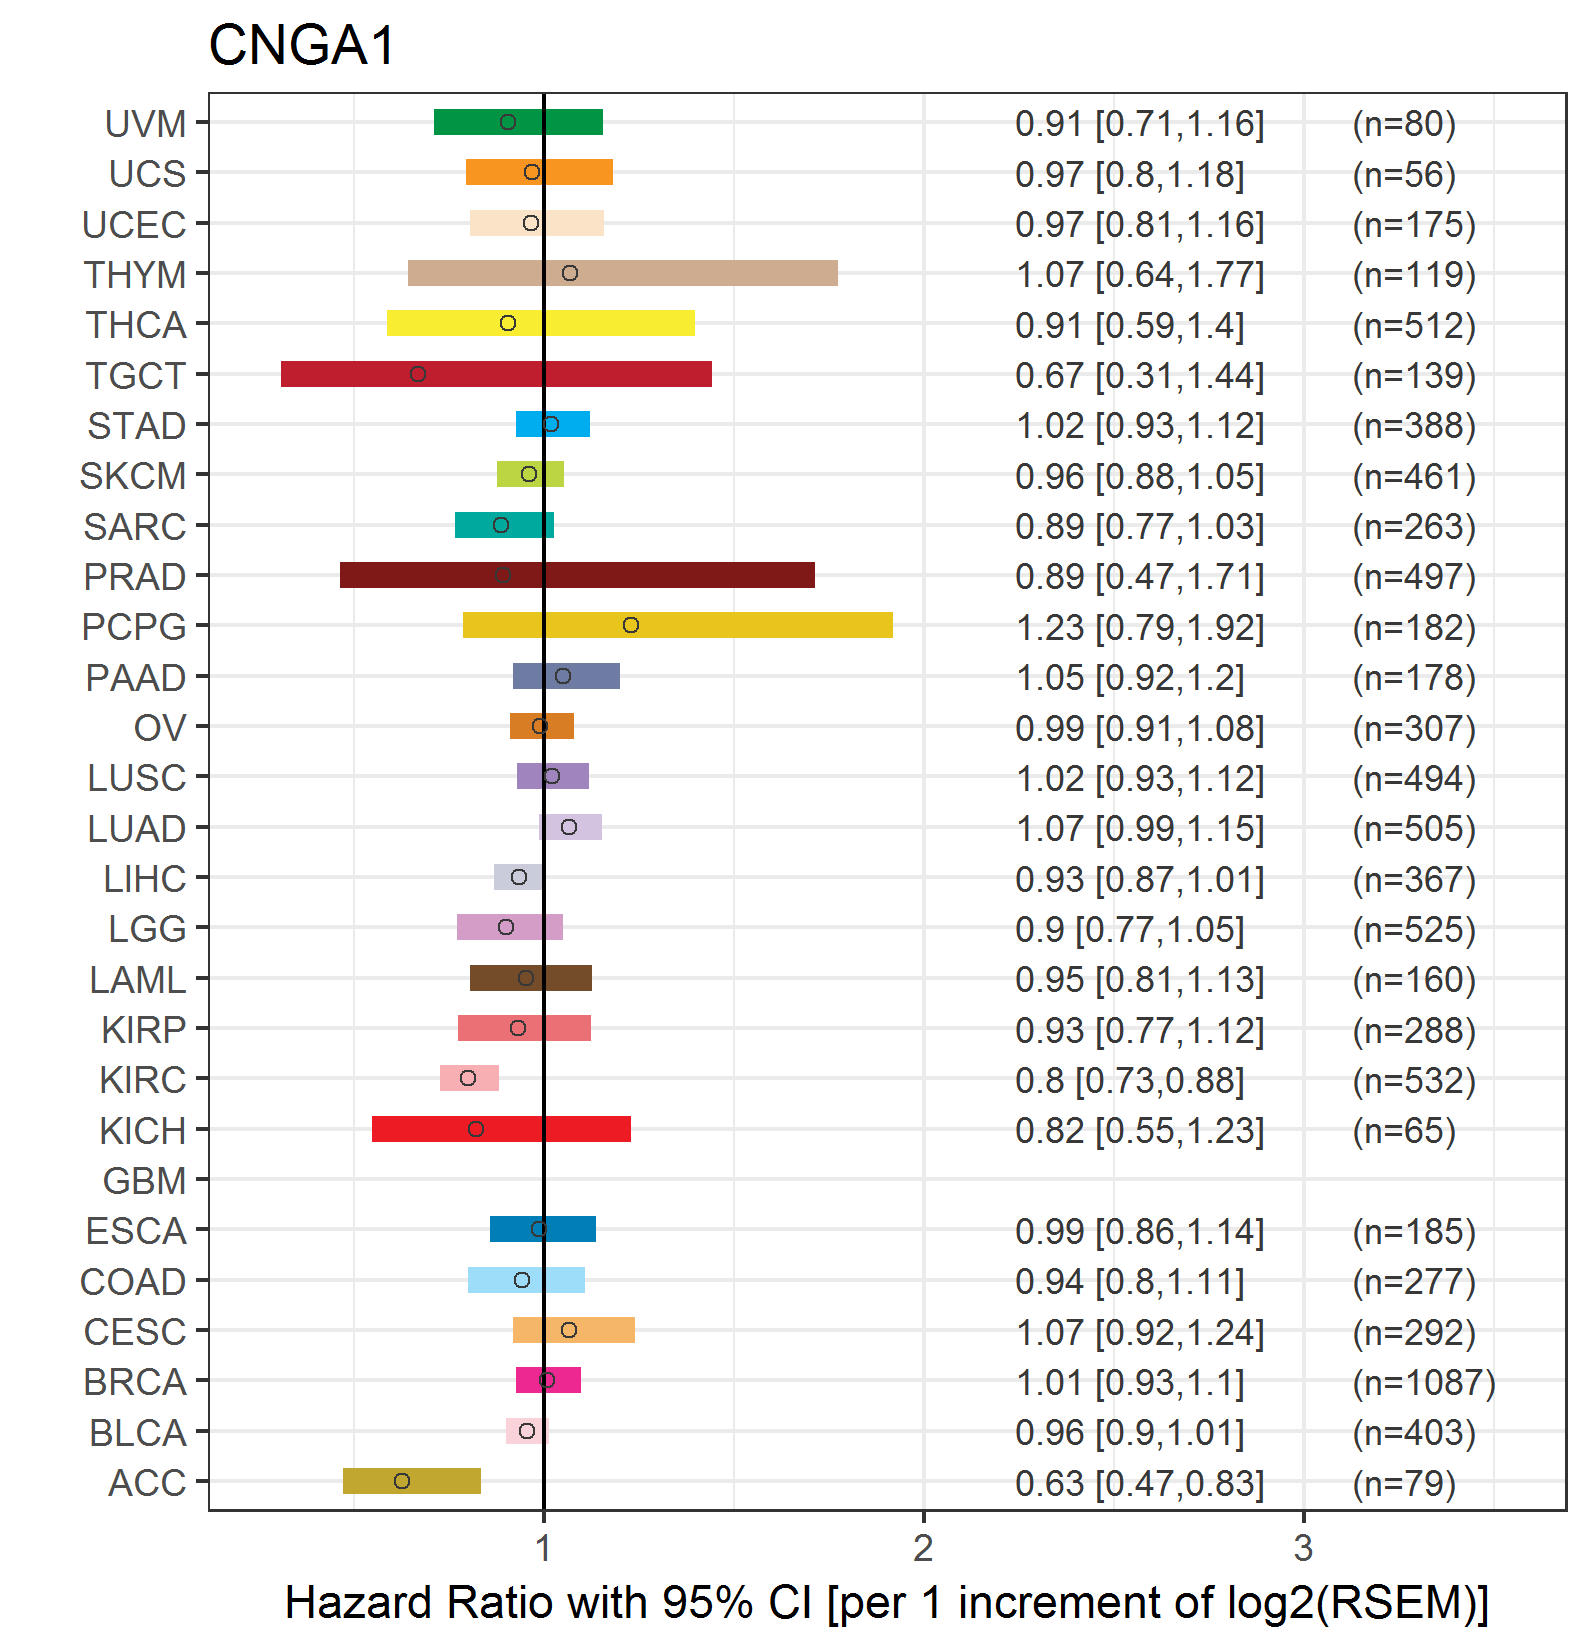 |
| Forest plot of Cox proportional hazard ratio (HR) and 95% CI of relapse free survival (RFS) using 28 cancer types (TCGA IlluminaHiSeq_RNASeqV2, pan-cancer normalized log2(norm_counts+1) data, version 2016-08-16) (TCGA clinicalMatrix, phenotype data, version 2016-04-27) * Click on the image enlarge it in a new window. |
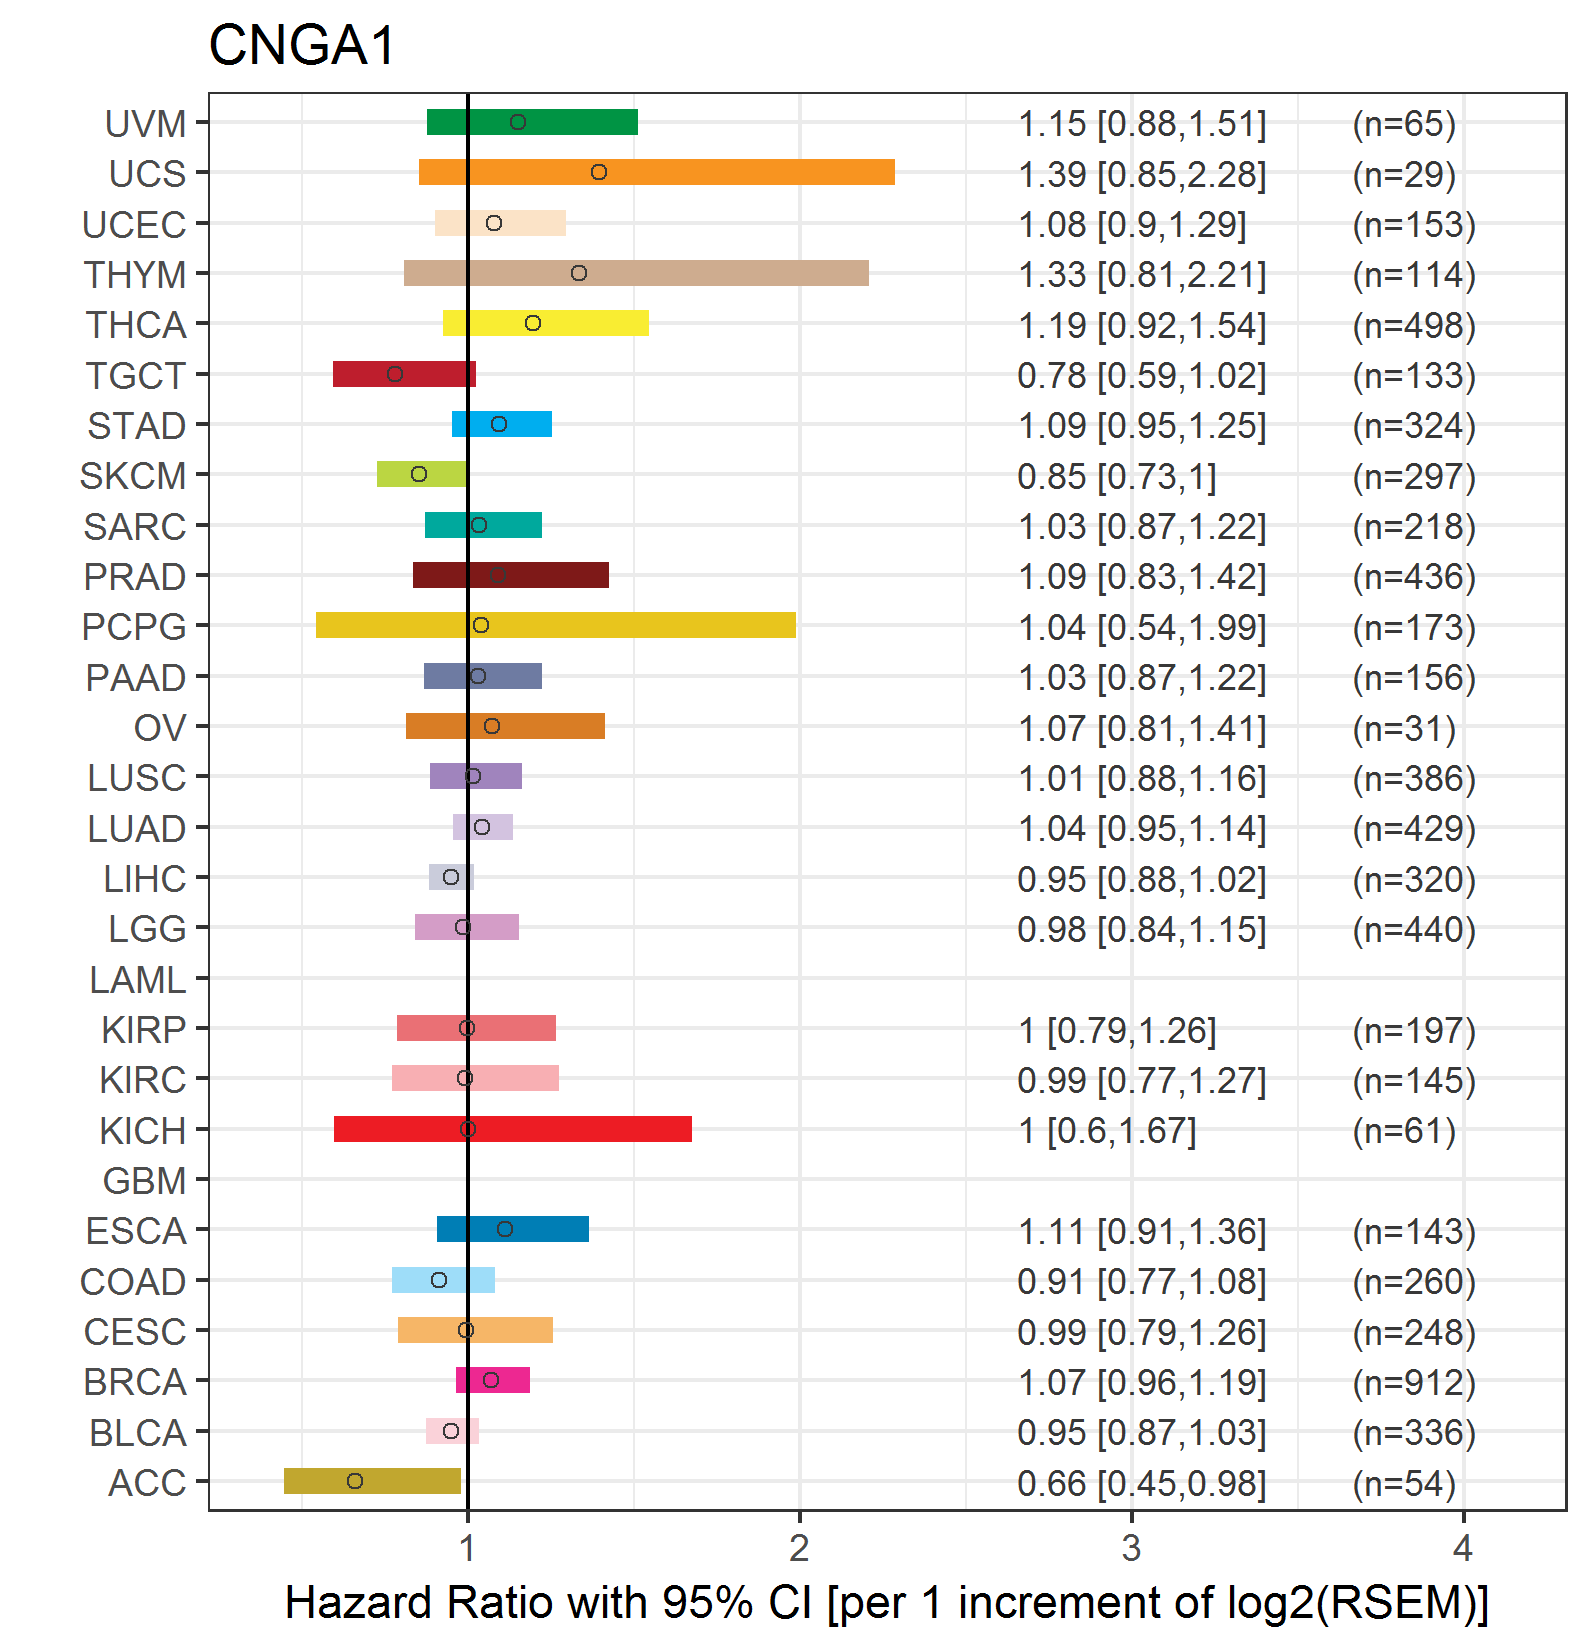 |
| Top |
| TissGeneClin for CNGA1 |
| TissGeneDrug for CNGA1 |
| Drug information targeting TissGene (DrugBank Version 5.0.6, 2017-04-01) |
| DrugBank ID | Drug name | Drug activity | Drug type | Drug status |
| Top |
| TissGeneDisease for CNGA1 |
| Disease information associated with TissGene (DisGeNet, 2016-06-01) |
| Disease ID | Disease name | # pubmeds | Source |
| umls:C0035334 | Retinitis Pigmentosa | 4 | BeFree,CTD_human,LHGDN,ORPHANET |
| umls:C0339526 | Autosomal recessive retinitis pigmentosa | 2 | BeFree |
| umls:C0035309 | Retinal Diseases | 1 | GAD |
| umls:C3151059 | RETINITIS PIGMENTOSA 49 | 1 | CLINVAR,UNIPROT |
|
Copyright 2016-Present - The University of Texas Health Science Center at Houston (UTHealth) Web File Viewing | How to Report, Fraud, Waste and Abuse | State of Texas | Statewide Search | Texas Homeland Security | Site Policies |