 |
| |
| |
| |
| |
| |
| |
|

| TissGeneSummary for MFSD12 |
 Gene summary Gene summary |
| Basic gene information | Gene symbol | MFSD12 |
| Gene name | major facilitator superfamily domain containing 12 | |
| Synonyms | C19orf28|PP3501 | |
| Cytomap | UCSC genome browser: 19p13.3 | |
| Type of gene | protein-coding | |
| RefGenes | NM_001042680.1, NM_021731.2,NM_001287529.1,NM_174983.4, | |
| Description | major facilitator superfamily domain-containing protein 12 | |
| Modification date | 20141207 | |
| dbXrefs | HGNC : HGNC | |
| Ensembl : ENSG00000161091 | ||
| HPRD : 12704 | ||
| Vega : OTTHUMG00000180766 | ||
| Protein | UniProt: go to UniProt's Cross Reference DB Table | |
| Expression | CleanEX: HS_MFSD12 | |
| BioGPS: 126321 | ||
| Pathway | NCI Pathway Interaction Database: MFSD12 | |
| KEGG: MFSD12 | ||
| REACTOME: MFSD12 | ||
| Pathway Commons: MFSD12 | ||
| Context | iHOP: MFSD12 | |
| ligand binding site mutation search in PubMed: MFSD12 | ||
| UCL Cancer Institute: MFSD12 | ||
| Assigned class in TissGDB* | C | |
| Included tissue-specific gene expression resources | TiGER,GTEx | |
| Specific-tissues in normal samples (assigned by TissGDB using HPA, TiGER, and GTEx) | KidneySkin | |
| Cancer types related to the specific-tissues in cancer samples (assigned by TissGDB using TCGA) | KIRC,KIRP,KICHSKCM | |
| Reference showing the relevant tissue of MFSD12 | ||
| Description by TissGene annotations | Fused withTSGene | |
| * Class A consists of genes with literature evidence and is part of the cTissGenes. Class B consists of only cTissGenes without additional evidence. The remaining genes belong to Class C. |
| Gene ontology having evidence of Inferred from Direct Assay (IDA) from Entrez |
| GO ID | GO term | PubMed ID |
| Top |
| TissGeneExp for MFSD12 |
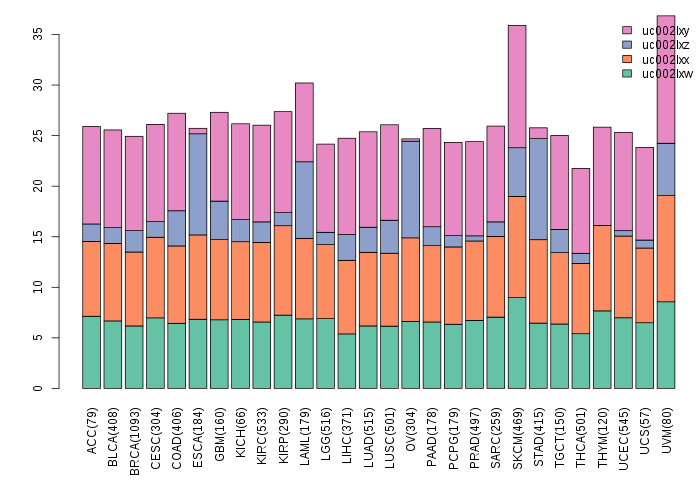
| Gene expressions across 28 cancer types (X-axis: cancer type and Y-axis: log2(norm_counts+1)) (TCGA IlluminaHiSeq_RNASeqV2, pan-cancer normalized log2(norm_counts+1) data, version 2016-08-16) |
| Gene isoform expressions across 28 cancer types (X-axis: cancer type and Y-axis: log2(norm_counts+1)) (TCGA pan-cancer tcga_rsem_isoform_tpm, version 2016-09-01) |
 |
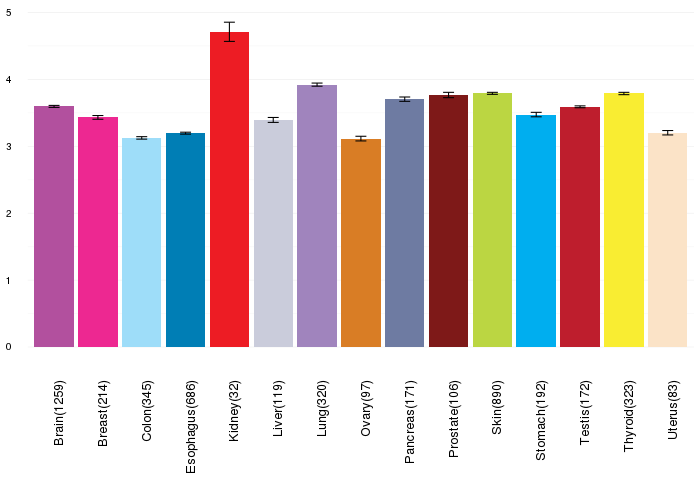
| Gene expressions across normal tissues of GTEx data (GTEx GTEx_Analysis_v6_RNA-seq_RNA-SeQCv1.1.8_gene_rpkm.gct) - Here, we shows the matched tissue types only among our 28 cancer types. |
 |
| Different expressions across 14 cancer types with more than 10 samples between matched tumors and normals (X-axis: cancer type and Y-axis: log2(norm_counts+1)) (TCGA IlluminaHiSeq_RNASeqV2, pan-cancer normalized log2(norm_counts+1) data, version 2016-08-16) |
| - Significantly differentially expressed cancer types and information. (|Fold change|>1 and FDR<0.05) |
| Cancer type | Mean(exp) in tumor | Mean(exp) in matched normal | Log2FC | P-val. | FDR |
| Top |
| TissGene-miRNA for MFSD12 |
| Significantly anti-correlated miRNAs of TissGene across 28 cancer types (Gene-miRNA relations from TargetScanHuman Relsease 7.1, Conserved_Site_Context_Scores.txt.zip, 06.01.2016) (TCGA IlluminaHiSeq_miRNASeq, log2(RPM+1) data, version 2016-11-21) (TCGA IlluminaHiSeq_RNASeqV2, log2(normalized_count+1) data, version 2016-08-16) (Spearman’s Rank Correlation (p-value<0.05 and coefficient<-0.25)) |
| Cancer type | miRNA id | miRNA accession | P-val. | Coeff. | # samples |
| Top |
| TissGeneMut for MFSD12 |
| TissGeneSNV for MFSD12 |
| nsSNV counts per each loci. Different colors of circles represent different cancer types. Circle size denotes number of samples. (TCGA somatic mutation (SNPs and small INDELs) data, version 2016-04-25) * Click on the image to enlarge it in a new window. |
 |
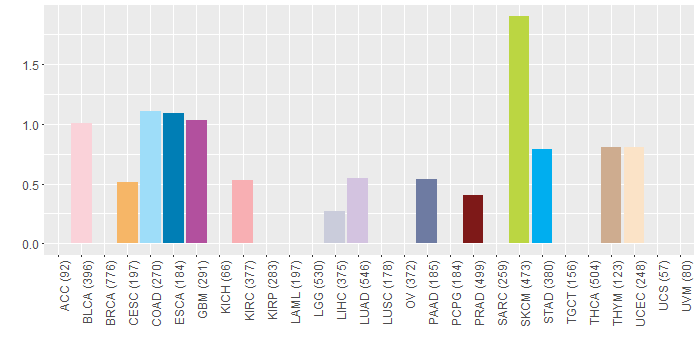
| Somatic nucleotide variants of TissGene across 28 cancer types (X-axis: cancer type and Y-axis: % of mutated samples) The numbers in parentheses are numbers of samples with mutation (nsSNVs). (TCGA somatic mutation (SNPs and small INDELs) data, version 2016-04-25) |
 |
| - nsSNVs sorted by frequency. |
| AAchange | Cancer type | # samples |
| p.K332R | SKCM | 1 |
| p.T254S | GBM | 1 |
| p.S55F | SKCM | 1 |
| p.E165Q | BLCA | 1 |
| p.M331I | SKCM | 1 |
| p.A229T | STAD | 1 |
| p.M408I | LUAD | 1 |
| p.E162K | HNSC | 1 |
| p.W535C | PRAD | 1 |
| p.E248K | SKCM | 1 |
| p.R472G | LIHC | 1 |
| p.D534H | HNSC | 1 |
| p.Y301H | UCEC | 1 |
| p.M446L | KIRC | 1 |
| p.P3Q | THYM | 1 |
| p.G59E | GBM | 1 |
| p.Y131C | BLCA | 1 |
| p.S491T | KIRC | 1 |
| p.G238D | PAAD | 1 |
| p.T254N | BLCA | 1 |
| p.C115G | SKCM | 1 |
| p.A127V | COAD | 1 |
| p.H443N | ESCA | 1 |
| p.A121S | LUAD | 1 |
| p.V224L | SKCM | 1 |
| p.T167M | GBM | 1 |
| p.A361V | UCEC | 1 |
| p.S327Y | ESCA | 1 |
| p.L459M | SKCM | 1 |
| p.R472X | STAD | 1 |
| p.R243H | COAD | 1 |
| p.P255L | SKCM | 1 |
| p.A120T | LUAD | 1 |
| p.F108S | COAD | 1 |
| p.G417R | SKCM | 1 |
| p.W357C | STAD | 1 |
| p.V453M | SKCM | 1 |
| p.S49W | CESC | 1 |
| p.T167M | BLCA | 1 |
| p.G395S | DLBC | 1 |
| p.S107F | PRAD | 1 |
| Top |
| TissGeneCNV for MFSD12 |
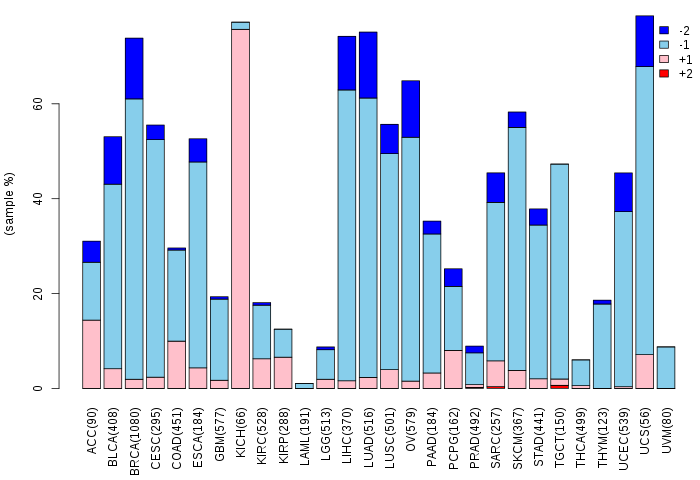
| Copy number variations of TissGene across 28 cancer types (X-axis: cancer type and Y-axis: % of CNV samples) (TCGA Gistic2_CopyNumber_Gistic2_all_data_by_genes, Gistic2 copy number data, version 2016-08-16) |
 |
| Top |
| TissGeneFusions for MFSD12 |
| Fusion genes including TissGene (ChimerDB 3.0, 2016-12-01 and TCGA fusion Portal 2015-12-01) |
| Database | Src | Cancer type | Sample | Fusion gene | ORF | 5'-gene BP | 3'-gene BP |
| Chimerdb3.0 | ChiTaRs | NA | BG951551 | CHURC1-MFSD12 | chr14:65406444 | chr19:3556625 | |
| Chimerdb3.0 | ChiTaRs | NA | CB529014 | MFSD12-MFSD12 | chr19:3544555 | chr19:3544894 | |
| Chimerdb3.0 | FusionScan | BRCA | TCGA-E9-A1NA-01A | MFSD12-PIP5K1C | Out-of-Frame | chr19:3557103 | chr19:3646056 |
| Chimerdb3.0 | FusionScan | BRCA | TCGA-C8-A12L-01A | RPL36-MFSD12 | 5'UTR-CDS | chr19:5690338 | chr19:3544937 |
| Chimerdb3.0 | TopHat-Fusion | BRCA | TCGA-C8-A12L-01A | FZR1-MFSD12 | Out-of-Frame | chr19:3524189 | chr19:3545107 |
| Chimerdb3.0 | TopHat-Fusion | BRCA | TCGA-C8-A12L-01A | FZR1-MFSD12 | Out-of-Frame | chr19:3524571 | chr19:3544936 |
| Top |
| TissGeneNet for MFSD12 |
| Co-expressed gene networks based on protein-protein interaction data (CePIN) (TCGA IlluminaHiSeq_RNASeqV2, pan-cancer normalized log2(norm_counts+1) data, version 2016-08-16) (PINA2 ppi data) |
| Top |
| TissGeneProg for MFSD12 |
| Kaplan-Meier plots with logrank tests of overall survival (OS) using 28 cancer types (TCGA IlluminaHiSeq_RNASeqV2, pan-cancer normalized log2(norm_counts+1) data, version 2016-08-16) (TCGA clinicalMatrix, phenotype data, version 2016-04-27) * Click on the image to enlarge it in a new window. |
| Kaplan-Meier plots with logrank test of relapse free survival (RFS) using 28 cancer types (TCGA IlluminaHiSeq_RNASeqV2, pan-cancer normalized log2(norm_counts+1) data, version 2016-08-16) (TCGA clinicalMatrix, phenotype data, version 2016-04-27) * Click on the image enlarge it in a new window. |
| Forest plot of Cox proportional hazard ratio (HR) and 95% CI of overall survival (OS) using 28 cancer types (TCGA IlluminaHiSeq_RNASeqV2, pan-cancer normalized log2(norm_counts+1) data, version 2016-08-16) (TCGA clinicalMatrix, phenotype data, version 2016-04-27) * Click on the image enlarge it in a new window. |
| Forest plot of Cox proportional hazard ratio (HR) and 95% CI of relapse free survival (RFS) using 28 cancer types (TCGA IlluminaHiSeq_RNASeqV2, pan-cancer normalized log2(norm_counts+1) data, version 2016-08-16) (TCGA clinicalMatrix, phenotype data, version 2016-04-27) * Click on the image enlarge it in a new window. |
| Top |
| TissGeneClin for MFSD12 |
| TissGeneDrug for MFSD12 |
| Drug information targeting TissGene (DrugBank Version 5.0.6, 2017-04-01) |
| DrugBank ID | Drug name | Drug activity | Drug type | Drug status |
| Top |
| TissGeneDisease for MFSD12 |
| Disease information associated with TissGene (DisGeNet, 2016-06-01) |
| Disease ID | Disease name | # pubmeds | Source |
| umls:C0027819 | Neuroblastoma | 1 | BeFree |
| umls:C0700095 | Central neuroblastoma | 1 | BeFree |
|
Copyright 2016-Present - The University of Texas Health Science Center at Houston (UTHealth) Web File Viewing | How to Report, Fraud, Waste and Abuse | State of Texas | Statewide Search | Texas Homeland Security | Site Policies |