 |
| |
| |
| |
| |
| |
| |
|

| TissGeneSummary for TRIM71 |
 Gene summary Gene summary |
| Basic gene information | Gene symbol | TRIM71 |
| Gene name | tripartite motif containing 71, E3 ubiquitin protein ligase | |
| Synonyms | LIN-41|LIN41 | |
| Cytomap | UCSC genome browser: 3p22.3 | |
| Type of gene | protein-coding | |
| RefGenes | NM_001039111.1, | |
| Description | E3 ubiquitin-protein ligase TRIM71abnormal cell LINeage LIN-41homolog of C. elegans Lin-41protein lin-41 homologtripartite motif-containing 71tripartite motif-containing protein 71 | |
| Modification date | 20141207 | |
| dbXrefs | HGNC : HGNC | |
| Protein | UniProt: go to UniProt's Cross Reference DB Table | |
| Expression | CleanEX: HS_TRIM71 | |
| BioGPS: 131405 | ||
| Pathway | NCI Pathway Interaction Database: TRIM71 | |
| KEGG: TRIM71 | ||
| REACTOME: TRIM71 | ||
| Pathway Commons: TRIM71 | ||
| Context | iHOP: TRIM71 | |
| ligand binding site mutation search in PubMed: TRIM71 | ||
| UCL Cancer Institute: TRIM71 | ||
| Assigned class in TissGDB* | C | |
| Included tissue-specific gene expression resources | HPA,GTEx | |
| Specific-tissues in normal samples (assigned by TissGDB using HPA, TiGER, and GTEx) | Testis | |
| Cancer types related to the specific-tissues in cancer samples (assigned by TissGDB using TCGA) | TGCT | |
| Reference showing the relevant tissue of TRIM71 | ||
| Description by TissGene annotations | Have significant anti-correlated miRNA | |
| * Class A consists of genes with literature evidence and is part of the cTissGenes. Class B consists of only cTissGenes without additional evidence. The remaining genes belong to Class C. |
| Gene ontology having evidence of Inferred from Direct Assay (IDA) from Entrez |
| GO ID | GO term | PubMed ID |
| Top |
| TissGeneExp for TRIM71 |
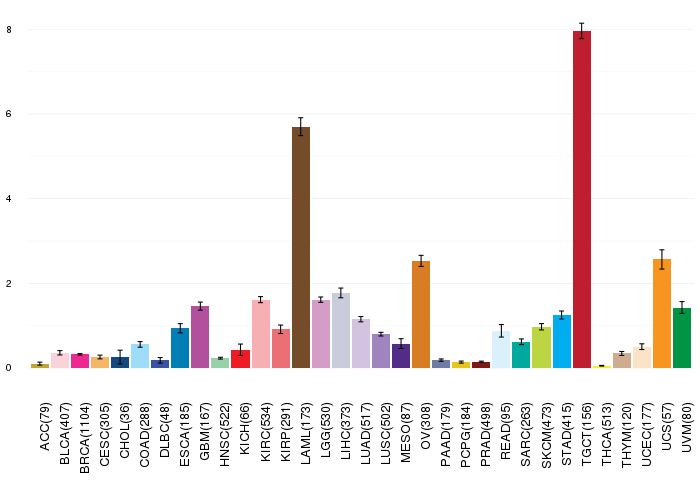
| Gene expressions across 28 cancer types (X-axis: cancer type and Y-axis: log2(norm_counts+1)) (TCGA IlluminaHiSeq_RNASeqV2, pan-cancer normalized log2(norm_counts+1) data, version 2016-08-16) |
 |
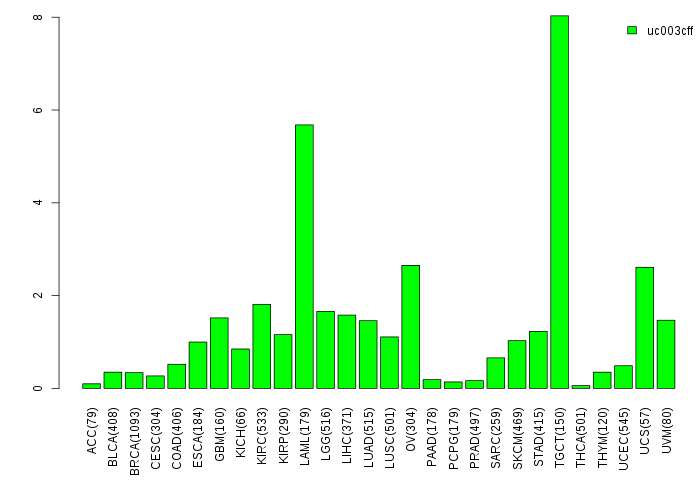
| Gene isoform expressions across 28 cancer types (X-axis: cancer type and Y-axis: log2(norm_counts+1)) (TCGA pan-cancer tcga_rsem_isoform_tpm, version 2016-09-01) |
 |
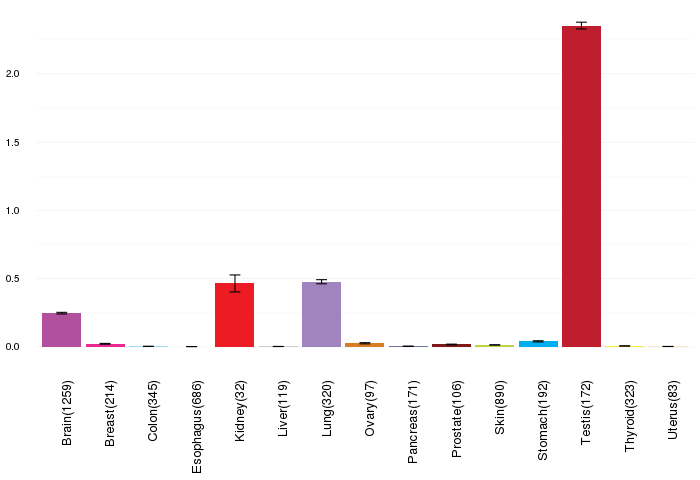
| Gene expressions across normal tissues of GTEx data (GTEx GTEx_Analysis_v6_RNA-seq_RNA-SeQCv1.1.8_gene_rpkm.gct) - Here, we shows the matched tissue types only among our 28 cancer types. |
 |
| Different expressions across 14 cancer types with more than 10 samples between matched tumors and normals (X-axis: cancer type and Y-axis: log2(norm_counts+1)) (TCGA IlluminaHiSeq_RNASeqV2, pan-cancer normalized log2(norm_counts+1) data, version 2016-08-16) |
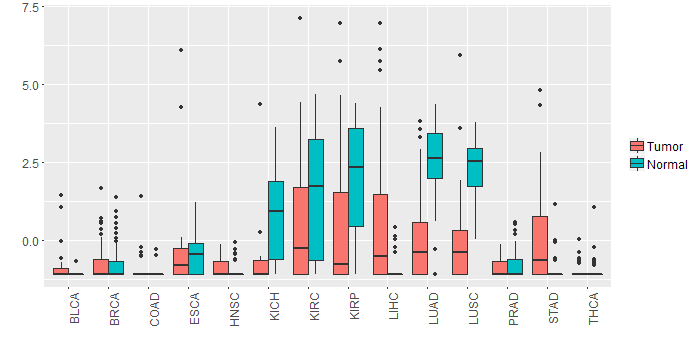 |
| - Significantly differentially expressed cancer types and information. (|Fold change|>1 and FDR<0.05) |
| Cancer type | Mean(exp) in tumor | Mean(exp) in matched normal | Log2FC | P-val. | FDR |
| LIHC | 0.583348517 | -0.947569483 | 1.530918 | 1.88E-05 | 7.47E-05 |
| LUAD | 0.061419758 | 2.561776655 | -2.500356897 | 2.69E-19 | 4.83E-18 |
| LUSC | -0.051720032 | 2.33018585 | -2.381905882 | 1.22E-17 | 1.05E-16 |
| KIRP | 0.527908767 | 1.967677517 | -1.43976875 | 0.00863 | 0.019252199 |
| KIRC | 0.446208072 | 1.499355294 | -1.053147222 | 0.000835 | 0.001587137 |
| KICH | -0.671143483 | 0.688636517 | -1.35978 | 4.00E-04 | 0.00093094 |
| Top |
| TissGene-miRNA for TRIM71 |
| Significantly anti-correlated miRNAs of TissGene across 28 cancer types (Gene-miRNA relations from TargetScanHuman Relsease 7.1, Conserved_Site_Context_Scores.txt.zip, 06.01.2016) (TCGA IlluminaHiSeq_miRNASeq, log2(RPM+1) data, version 2016-11-21) (TCGA IlluminaHiSeq_RNASeqV2, log2(normalized_count+1) data, version 2016-08-16) (Spearman’s Rank Correlation (p-value<0.05 and coefficient<-0.25)) |
| Cancer type | miRNA id | miRNA accession | P-val. | Coeff. | # samples |
| LUAD | hsa-miR-144-3p | MIMAT0000436 | 0.043 | -0.26 | 60 |
| ACC | hsa-miR-26a-5p | MIMAT0000082 | 0.018 | -0.27 | 78 |
| ACC | hsa-miR-26a-5p | MIMAT0000082 | 0.018 | -0.27 | 78 |
| ACC | hsa-miR-181a-5p | MIMAT0000256 | 0.014 | -0.28 | 78 |
| ACC | hsa-miR-181a-5p | MIMAT0000256 | 0.014 | -0.28 | 78 |
| LUAD | hsa-miR-200b-3p | MIMAT0000318 | 0.022 | -0.3 | 60 |
| LUAD | hsa-miR-429 | MIMAT0001536 | 0.0012 | -0.41 | 60 |
| Top |
| TissGeneMut for TRIM71 |
| TissGeneSNV for TRIM71 |
| nsSNV counts per each loci. Different colors of circles represent different cancer types. Circle size denotes number of samples. (TCGA somatic mutation (SNPs and small INDELs) data, version 2016-04-25) * Click on the image to enlarge it in a new window. |
 |
 |
| Somatic nucleotide variants of TissGene across 28 cancer types (X-axis: cancer type and Y-axis: % of mutated samples) The numbers in parentheses are numbers of samples with mutation (nsSNVs). (TCGA somatic mutation (SNPs and small INDELs) data, version 2016-04-25) |
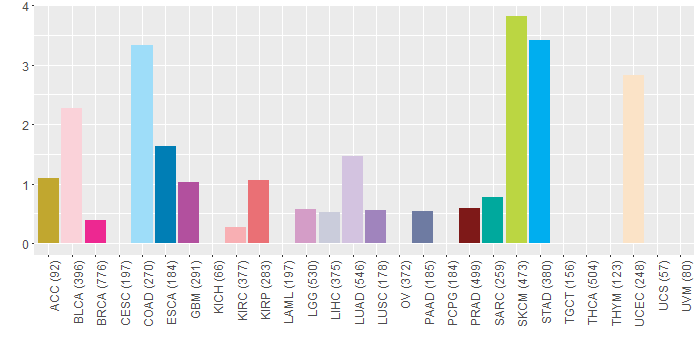 |
| - nsSNVs sorted by frequency. |
| AAchange | Cancer type | # samples |
| p.A357V | COAD | 2 |
| p.T38S | STAD | 2 |
| p.S749F | SKCM | 2 |
| p.R336Q | SKCM | 1 |
| p.G304V | SARC | 1 |
| p.A247V | STAD | 1 |
| p.R807C | STAD | 1 |
| p.R625H | UCEC | 1 |
| p.R336* | GBM | 1 |
| p.S3L | KIRP | 1 |
| p.R796H | HNSC | 1 |
| p.D705N | SKCM | 1 |
| p.R807H | COAD | 1 |
| p.R864X | SKCM | 1 |
| p.R629P | ESCA | 1 |
| p.R843C | LUSC | 1 |
| p.V418M | COAD | 1 |
| p.Y510X | SKCM | 1 |
| p.G47R | GBM | 1 |
| p.A638T | STAD | 1 |
| p.E572Q | BLCA | 1 |
| p.R655* | BLCA | 1 |
| p.R378C | UCEC | 1 |
| p.K581M | PRAD | 1 |
| p.Q725X | SKCM | 1 |
| p.G493C | READ | 1 |
| p.R807C | UCEC | 1 |
| p.R649Q | COAD | 1 |
| p.D852Y | LUAD | 1 |
| p.N573S | UCEC | 1 |
| p.P554L | SKCM | 1 |
| p.D291G | UCEC | 1 |
| p.L408P | ESCA | 1 |
| p.M460V | COAD | 1 |
| p.Q631* | SKCM | 1 |
| p.L828M | STAD | 1 |
| p.A52V | STAD | 1 |
| p.A801S | LUAD | 1 |
| p.R448W | STAD | 1 |
| p.G731C | ACC | 1 |
| p.E344K | LGG | 1 |
| p.R864* | SKCM | 1 |
| p.R864Q | SKCM | 1 |
| p.E344K | SKCM | 1 |
| p.R864X | COAD | 1 |
| p.S310R | KIRP | 1 |
| p.L275P | SKCM | 1 |
| p.S749Y | BLCA | 1 |
| p.D673G | LIHC | 1 |
| p.R676H | LGG | 1 |
| p.R625H | PRAD | 1 |
| p.Q466E | BLCA | 1 |
| p.A369V | ESCA | 1 |
| p.A251V | STAD | 1 |
| p.D283H | BLCA | 1 |
| p.V447M | STAD | 1 |
| p.G658D | LIHC | 1 |
| p.R782H | GBM | 1 |
| p.H197Y | PAAD | 1 |
| p.R378S | KIRP | 1 |
| p.Q315* | SKCM | 1 |
| p.R723Q | HNSC | 1 |
| p.G257R | STAD | 1 |
| p.Q725* | SKCM | 1 |
| p.K581N | UCEC | 1 |
| p.S33P | STAD | 1 |
| p.R322Q | UCEC | 1 |
| p.E217K | SKCM | 1 |
| p.C278S | STAD | 1 |
| p.V418M | HNSC | 1 |
| p.R299S | PRAD | 1 |
| p.R796C | PRAD | 1 |
| p.S474F | SKCM | 1 |
| p.F265Y | LUAD | 1 |
| p.Q454* | BLCA | 1 |
| p.G846S | BRCA | 1 |
| p.A811V | UCEC | 1 |
| p.D852E | LUAD | 1 |
| p.D492N | LUAD | 1 |
| p.G788D | SARC | 1 |
| p.A23G | LUAD | 1 |
| p.V459L | KIRC | 1 |
| p.R817W | LUAD | 1 |
| p.R629C | STAD | 1 |
| p.S786L | SKCM | 1 |
| p.R796C | SKCM | 1 |
| p.T719M | STAD | 1 |
| p.Y510* | SKCM | 1 |
| p.N407H | HNSC | 1 |
| p.R676C | BLCA | 1 |
| p.R553X | COAD | 1 |
| p.A53G | STAD | 1 |
| p.Q315X | SKCM | 1 |
| p.G694E | LUAD | 1 |
| p.D748V | COAD | 1 |
| p.L383R | COAD | 1 |
| p.S648F | BLCA | 1 |
| p.E740K | LGG | 1 |
| p.M820I | BRCA | 1 |
| p.S541T | BLCA | 1 |
| p.D457N | STAD | 1 |
| p.F505L | BRCA | 1 |
| p.E822V | SKCM | 1 |
| Top |
| TissGeneCNV for TRIM71 |
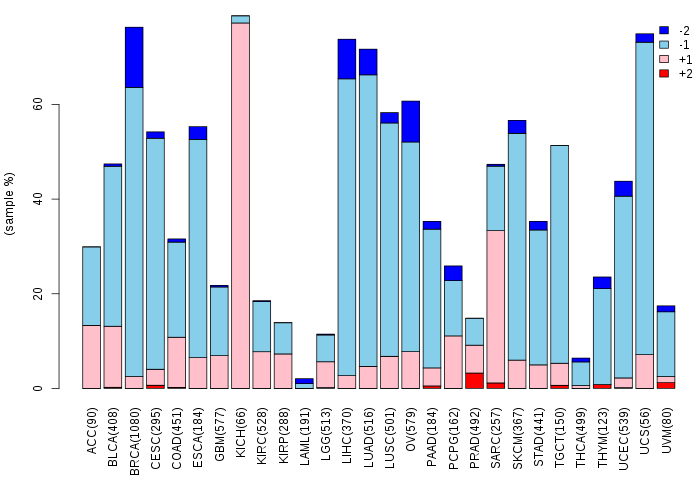
| Copy number variations of TissGene across 28 cancer types (X-axis: cancer type and Y-axis: % of CNV samples) (TCGA Gistic2_CopyNumber_Gistic2_all_data_by_genes, Gistic2 copy number data, version 2016-08-16) |
 |
| Top |
| TissGeneFusions for TRIM71 |
| Fusion genes including TissGene (ChimerDB 3.0, 2016-12-01 and TCGA fusion Portal 2015-12-01) |
| Database | Src | Cancer type | Sample | Fusion gene | ORF | 5'-gene BP | 3'-gene BP |
| Top |
| TissGeneNet for TRIM71 |
| Co-expressed gene networks based on protein-protein interaction data (CePIN) (TCGA IlluminaHiSeq_RNASeqV2, pan-cancer normalized log2(norm_counts+1) data, version 2016-08-16) (PINA2 ppi data) |
| Top |
| TissGeneProg for TRIM71 |
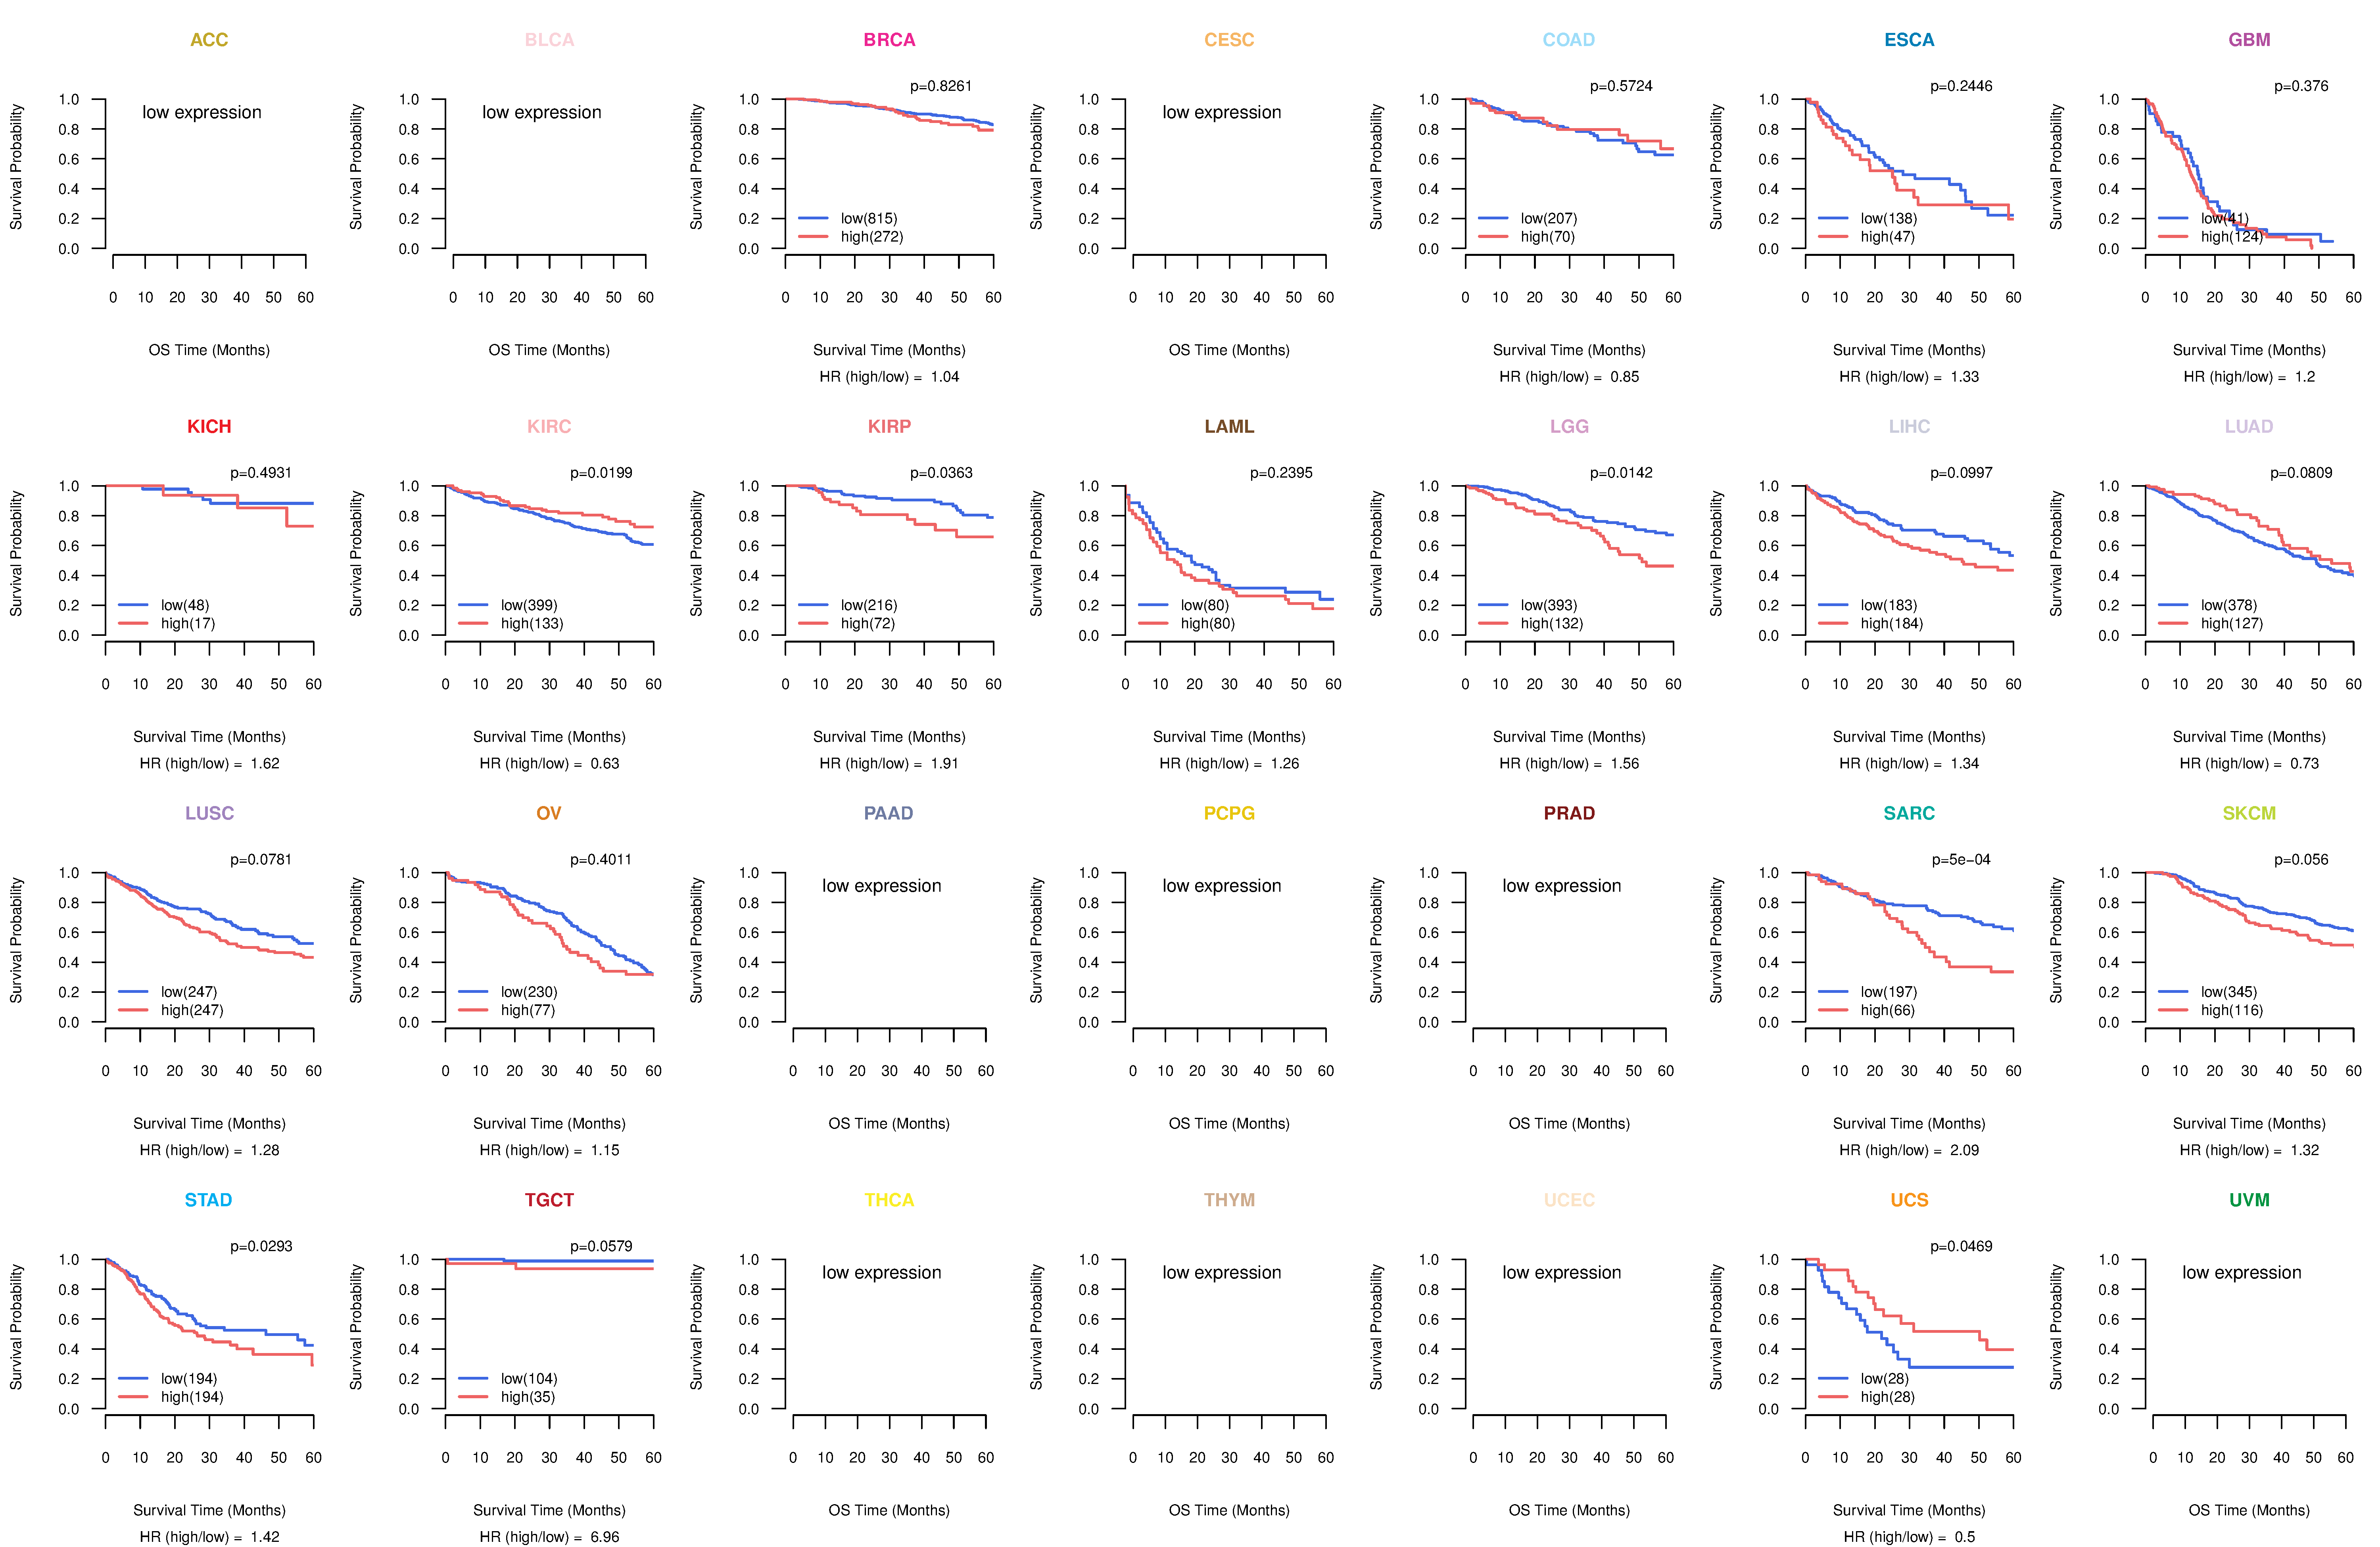
| Kaplan-Meier plots with logrank tests of overall survival (OS) using 28 cancer types (TCGA IlluminaHiSeq_RNASeqV2, pan-cancer normalized log2(norm_counts+1) data, version 2016-08-16) (TCGA clinicalMatrix, phenotype data, version 2016-04-27) * Click on the image to enlarge it in a new window. |
 |
| Kaplan-Meier plots with logrank test of relapse free survival (RFS) using 28 cancer types (TCGA IlluminaHiSeq_RNASeqV2, pan-cancer normalized log2(norm_counts+1) data, version 2016-08-16) (TCGA clinicalMatrix, phenotype data, version 2016-04-27) * Click on the image enlarge it in a new window. |
 |
| Forest plot of Cox proportional hazard ratio (HR) and 95% CI of overall survival (OS) using 28 cancer types (TCGA IlluminaHiSeq_RNASeqV2, pan-cancer normalized log2(norm_counts+1) data, version 2016-08-16) (TCGA clinicalMatrix, phenotype data, version 2016-04-27) * Click on the image enlarge it in a new window. |
 |
| Forest plot of Cox proportional hazard ratio (HR) and 95% CI of relapse free survival (RFS) using 28 cancer types (TCGA IlluminaHiSeq_RNASeqV2, pan-cancer normalized log2(norm_counts+1) data, version 2016-08-16) (TCGA clinicalMatrix, phenotype data, version 2016-04-27) * Click on the image enlarge it in a new window. |
 |
| Top |
| TissGeneClin for TRIM71 |
| TissGeneDrug for TRIM71 |
| Drug information targeting TissGene (DrugBank Version 5.0.6, 2017-04-01) |
| DrugBank ID | Drug name | Drug activity | Drug type | Drug status |
| Top |
| TissGeneDisease for TRIM71 |
| Disease information associated with TissGene (DisGeNet, 2016-06-01) |
| Disease ID | Disease name | # pubmeds | Source |
| umls:C0279000 | Liver and Intrahepatic Biliary Tract Carcinoma | 1 | BeFree |
| umls:C0345904 | Malignant neoplasm of liver | 1 | BeFree |
| umls:C2239176 | Liver carcinoma | 1 | BeFree |
|
Copyright 2016-Present - The University of Texas Health Science Center at Houston (UTHealth) Web File Viewing | How to Report, Fraud, Waste and Abuse | State of Texas | Statewide Search | Texas Homeland Security | Site Policies |