 |
| |
| |
| |
| |
| |
| |
|

| TissGeneSummary for TMEM139 |
 Gene summary Gene summary |
| Basic gene information | Gene symbol | TMEM139 |
| Gene name | transmembrane protein 139 | |
| Synonyms | - | |
| Cytomap | UCSC genome browser: 7q34 | |
| Type of gene | protein-coding | |
| RefGenes | NM_001242773.2, NM_001242774.2,NM_001242775.2,NM_001282876.1,NM_001282877.1, NM_153345.3,NR_040003.2,NR_104250.1,NR_104251.1, NR_104252.1,NR_104253.1,NR_104254.1, | |
| Description | - | |
| Modification date | 20141207 | |
| dbXrefs | HGNC : HGNC | |
| Ensembl : ENSG00000178826 | ||
| HPRD : 08298 | ||
| Vega : OTTHUMG00000152652 | ||
| Protein | UniProt: go to UniProt's Cross Reference DB Table | |
| Expression | CleanEX: HS_TMEM139 | |
| BioGPS: 135932 | ||
| Pathway | NCI Pathway Interaction Database: TMEM139 | |
| KEGG: TMEM139 | ||
| REACTOME: TMEM139 | ||
| Pathway Commons: TMEM139 | ||
| Context | iHOP: TMEM139 | |
| ligand binding site mutation search in PubMed: TMEM139 | ||
| UCL Cancer Institute: TMEM139 | ||
| Assigned class in TissGDB* | C | |
| Included tissue-specific gene expression resources | TiGER,GTEx | |
| Specific-tissues in normal samples (assigned by TissGDB using HPA, TiGER, and GTEx) | Kidney | |
| Cancer types related to the specific-tissues in cancer samples (assigned by TissGDB using TCGA) | KIRC,KIRP,KICH | |
| Reference showing the relevant tissue of TMEM139 | ||
| Description by TissGene annotations | ||
| * Class A consists of genes with literature evidence and is part of the cTissGenes. Class B consists of only cTissGenes without additional evidence. The remaining genes belong to Class C. |
| Gene ontology having evidence of Inferred from Direct Assay (IDA) from Entrez |
| GO ID | GO term | PubMed ID |
| Top |
| TissGeneExp for TMEM139 |
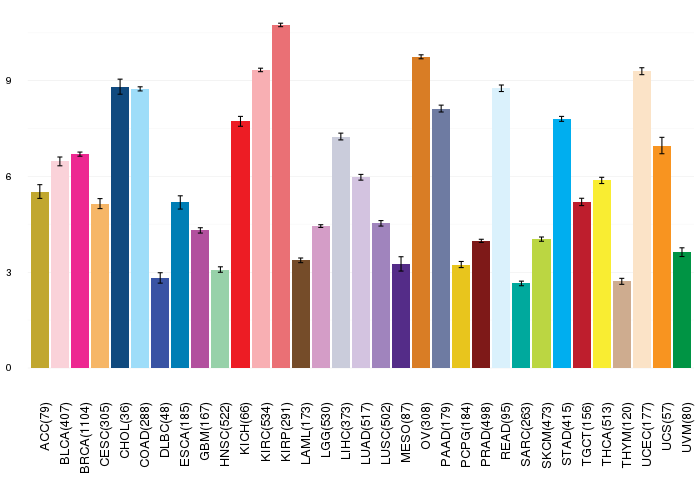
| Gene expressions across 28 cancer types (X-axis: cancer type and Y-axis: log2(norm_counts+1)) (TCGA IlluminaHiSeq_RNASeqV2, pan-cancer normalized log2(norm_counts+1) data, version 2016-08-16) |
 |
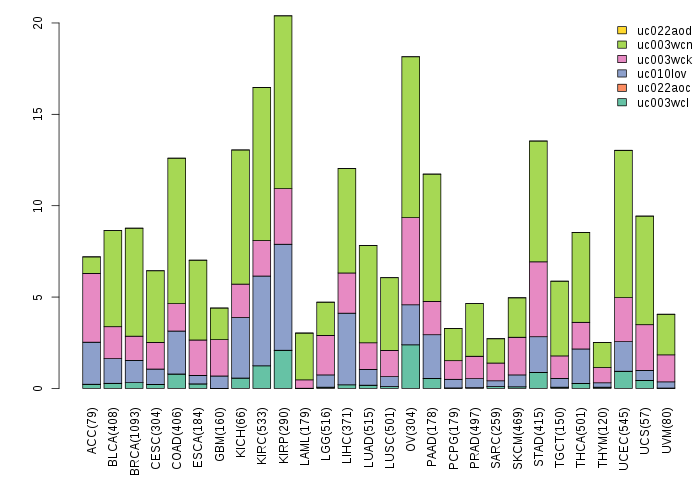
| Gene isoform expressions across 28 cancer types (X-axis: cancer type and Y-axis: log2(norm_counts+1)) (TCGA pan-cancer tcga_rsem_isoform_tpm, version 2016-09-01) |
 |
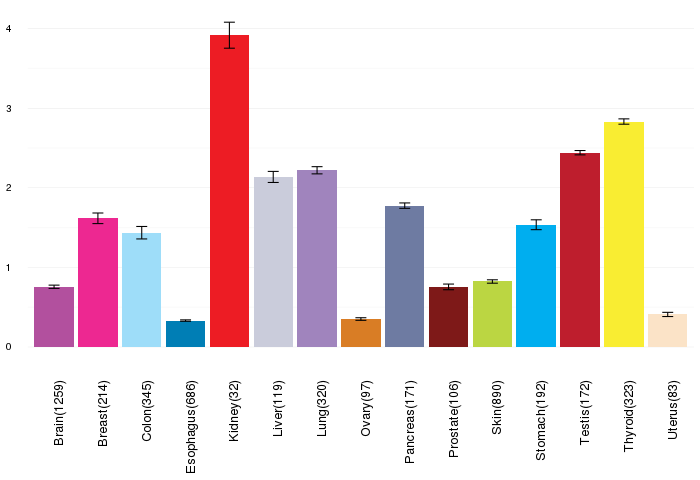
| Gene expressions across normal tissues of GTEx data (GTEx GTEx_Analysis_v6_RNA-seq_RNA-SeQCv1.1.8_gene_rpkm.gct) - Here, we shows the matched tissue types only among our 28 cancer types. |
 |
| Different expressions across 14 cancer types with more than 10 samples between matched tumors and normals (X-axis: cancer type and Y-axis: log2(norm_counts+1)) (TCGA IlluminaHiSeq_RNASeqV2, pan-cancer normalized log2(norm_counts+1) data, version 2016-08-16) |
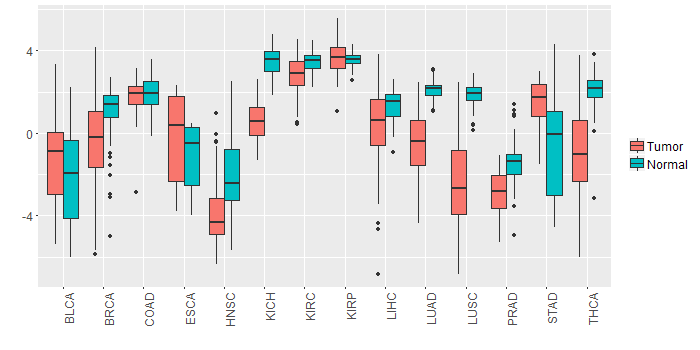 |
| - Significantly differentially expressed cancer types and information. (|Fold change|>1 and FDR<0.05) |
| Cancer type | Mean(exp) in tumor | Mean(exp) in matched normal | Log2FC | P-val. | FDR |
| BRCA | -0.426166143 | 1.122031225 | -1.548197368 | 1.79E-09 | 6.28E-09 |
| LUSC | -2.417707423 | 1.866808263 | -4.284515686 | 2.54E-19 | 2.72E-18 |
| LUAD | -0.580962392 | 2.107180711 | -2.688143103 | 2.06E-17 | 2.67E-16 |
| PRAD | -2.825740907 | -1.363138984 | -1.462601923 | 1.73E-09 | 2.53E-08 |
| KICH | 0.590883401 | 3.492151401 | -2.901268 | 1.21E-14 | 2.22E-13 |
| THCA | -0.933053684 | 2.080286994 | -3.013340678 | 8.81E-16 | 1.34E-14 |
| STAD | 1.413607651 | -0.403911099 | 1.81751875 | 0.00108 | 0.005648651 |
| LIHC | 0.231901401 | 1.362435401 | -1.130534 | 0.0015 | 0.003966071 |
| HNSC | -3.808688134 | -2.022450925 | -1.786237209 | 4.89E-05 | 0.000237635 |
| Top |
| TissGene-miRNA for TMEM139 |
| Significantly anti-correlated miRNAs of TissGene across 28 cancer types (Gene-miRNA relations from TargetScanHuman Relsease 7.1, Conserved_Site_Context_Scores.txt.zip, 06.01.2016) (TCGA IlluminaHiSeq_miRNASeq, log2(RPM+1) data, version 2016-11-21) (TCGA IlluminaHiSeq_RNASeqV2, log2(normalized_count+1) data, version 2016-08-16) (Spearman’s Rank Correlation (p-value<0.05 and coefficient<-0.25)) |
| Cancer type | miRNA id | miRNA accession | P-val. | Coeff. | # samples |
| Top |
| TissGeneMut for TMEM139 |
| TissGeneSNV for TMEM139 |
| nsSNV counts per each loci. Different colors of circles represent different cancer types. Circle size denotes number of samples. (TCGA somatic mutation (SNPs and small INDELs) data, version 2016-04-25) * Click on the image to enlarge it in a new window. |
 |
| Somatic nucleotide variants of TissGene across 28 cancer types (X-axis: cancer type and Y-axis: % of mutated samples) The numbers in parentheses are numbers of samples with mutation (nsSNVs). (TCGA somatic mutation (SNPs and small INDELs) data, version 2016-04-25) |
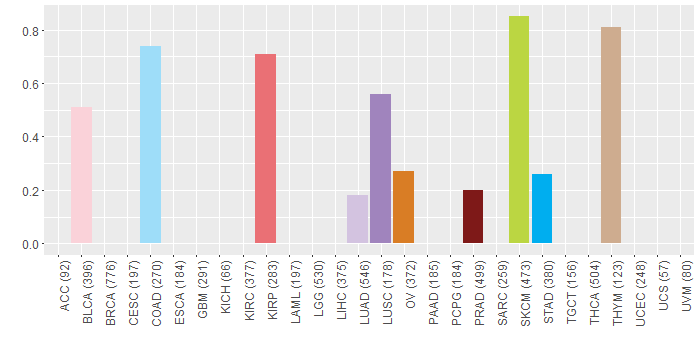 |
| - nsSNVs sorted by frequency. |
| AAchange | Cancer type | # samples |
| p.R136K | COAD | 1 |
| p.P113L | PRAD | 1 |
| p.V38F | THYM | 1 |
| p.P193S | SKCM | 1 |
| p.P37L | SKCM | 1 |
| p.F58S | KIRP | 1 |
| p.S12N | COAD | 1 |
| p.R57W | SKCM | 1 |
| p.Y114H | KIRP | 1 |
| p.V96M | STAD | 1 |
| p.G79S | LUAD | 1 |
| p.H201Y | BLCA | 1 |
| p.A137T | OV | 1 |
| p.L10M | LUSC | 1 |
| p.R158I | BLCA | 1 |
| p.P75Q | SKCM | 1 |
| Top |
| TissGeneCNV for TMEM139 |
| Copy number variations of TissGene across 28 cancer types (X-axis: cancer type and Y-axis: % of CNV samples) (TCGA Gistic2_CopyNumber_Gistic2_all_data_by_genes, Gistic2 copy number data, version 2016-08-16) |
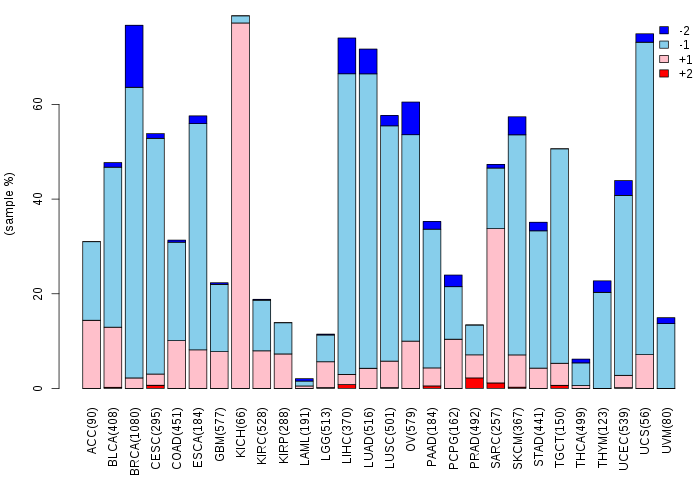 |
| Top |
| TissGeneFusions for TMEM139 |
| Fusion genes including TissGene (ChimerDB 3.0, 2016-12-01 and TCGA fusion Portal 2015-12-01) |
| Database | Src | Cancer type | Sample | Fusion gene | ORF | 5'-gene BP | 3'-gene BP |
| Top |
| TissGeneNet for TMEM139 |
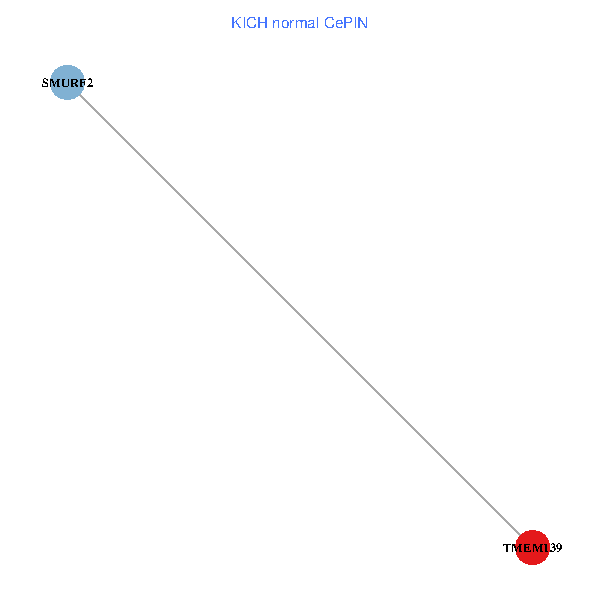
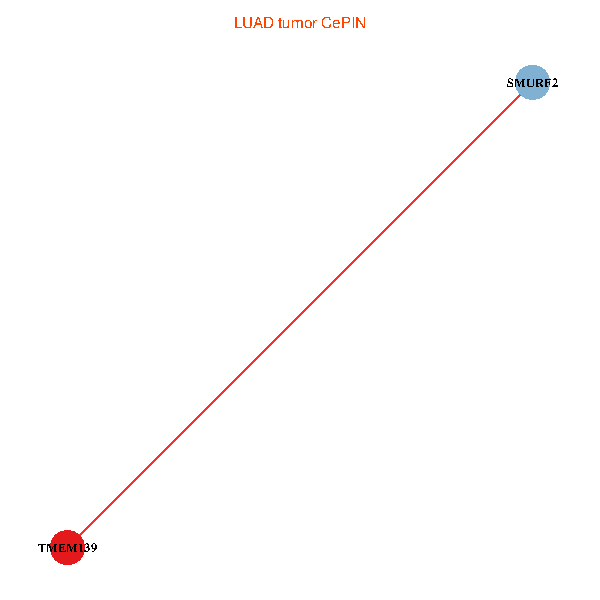
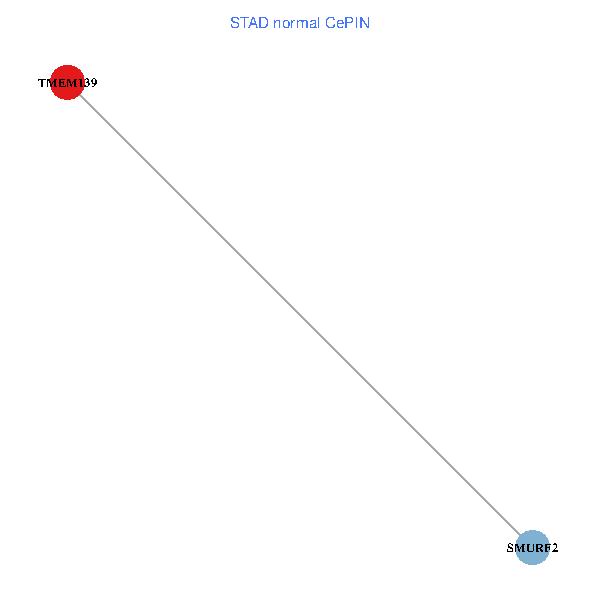
| Co-expressed gene networks based on protein-protein interaction data (CePIN) (TCGA IlluminaHiSeq_RNASeqV2, pan-cancer normalized log2(norm_counts+1) data, version 2016-08-16) (PINA2 ppi data) |
| BRCA (tumor) | BRCA (normal) |
| TMEM139, SMURF2 (tumor) | TMEM139, SMURF2 (normal) |
 |  |
| COAD (tumor) | COAD (normal) |
| TMEM139, SMURF2 (tumor) | TMEM139, SMURF2 (normal) |
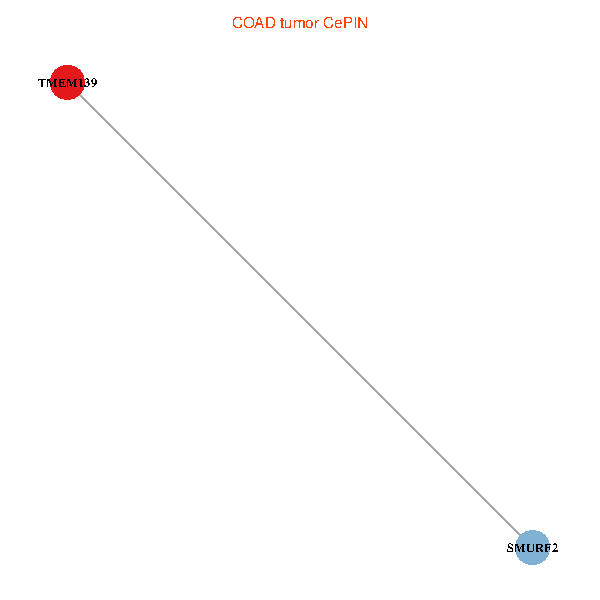 |  |
| HNSC (tumor) | HNSC (normal) |
| TMEM139, SMURF2 (tumor) | TMEM139, SMURF2 (normal) |
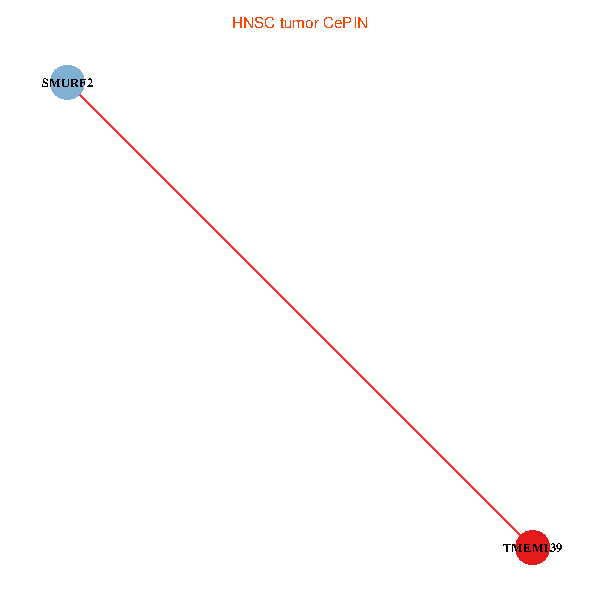 |  |
| KICH (tumor) | KICH (normal) |
| TMEM139, SMURF2 (tumor) | TMEM139, SMURF2 (normal) |
 |  |
| KIRC (tumor) | KIRC (normal) |
| TMEM139, SMURF2 (tumor) | TMEM139, SMURF2 (normal) |
 |  |
| KIRP (tumor) | KIRP (normal) |
| TMEM139, SMURF2 (tumor) | TMEM139, SMURF2 (normal) |
 |  |
| LIHC (tumor) | LIHC (normal) |
| TMEM139, SMURF2 (tumor) | TMEM139, SMURF2 (normal) |
 |  |
| LUAD (tumor) | LUAD (normal) |
| TMEM139, SMURF2 (tumor) | TMEM139, SMURF2 (normal) |
 |  |
| LUSC (tumor) | LUSC (normal) |
| TMEM139, SMURF2 (tumor) | TMEM139, SMURF2 (normal) |
 |  |
| PRAD (tumor) | PRAD (normal) |
| TMEM139, SMURF2 (tumor) | TMEM139, SMURF2 (normal) |
 |  |
| STAD (tumor) | STAD (normal) |
| TMEM139, SMURF2 (tumor) | TMEM139, SMURF2 (normal) |
 |  |
| THCA (tumor) | THCA (normal) |
| TMEM139, SMURF2 (tumor) | TMEM139, SMURF2 (normal) |
 |  |
| Top |
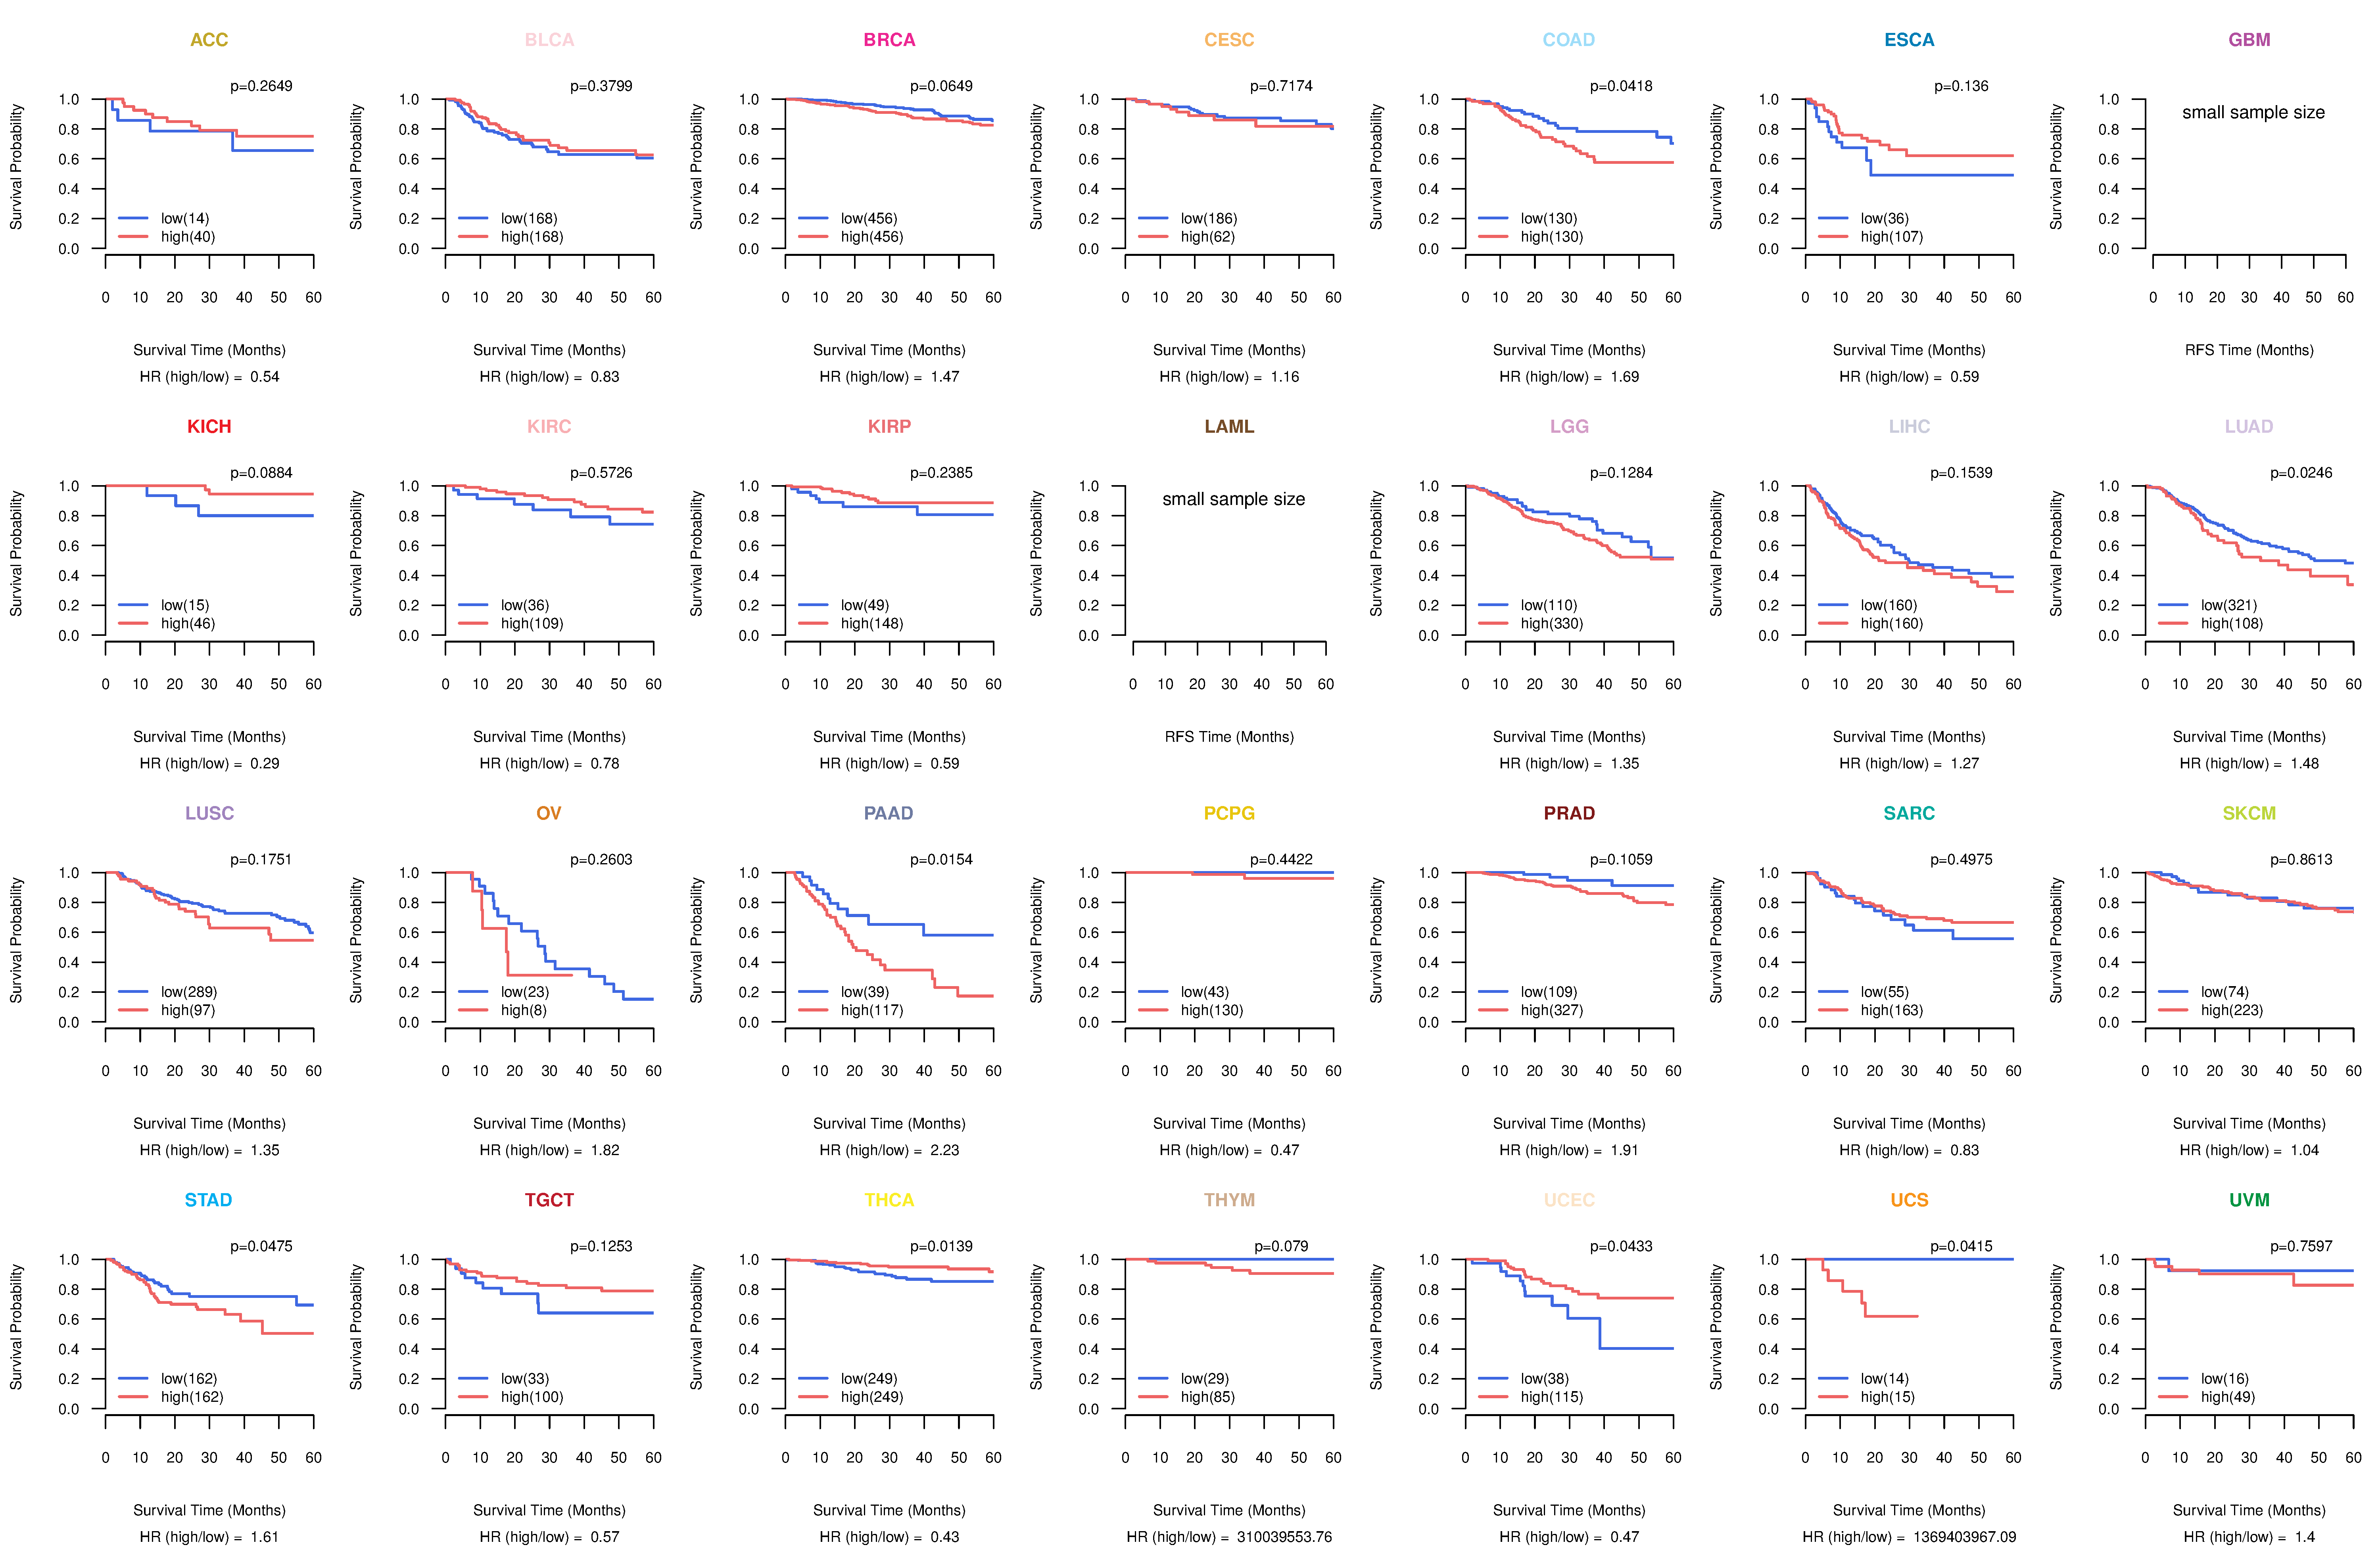
| TissGeneProg for TMEM139 |
| Kaplan-Meier plots with logrank tests of overall survival (OS) using 28 cancer types (TCGA IlluminaHiSeq_RNASeqV2, pan-cancer normalized log2(norm_counts+1) data, version 2016-08-16) (TCGA clinicalMatrix, phenotype data, version 2016-04-27) * Click on the image to enlarge it in a new window. |
 |
| Kaplan-Meier plots with logrank test of relapse free survival (RFS) using 28 cancer types (TCGA IlluminaHiSeq_RNASeqV2, pan-cancer normalized log2(norm_counts+1) data, version 2016-08-16) (TCGA clinicalMatrix, phenotype data, version 2016-04-27) * Click on the image enlarge it in a new window. |
 |
| Forest plot of Cox proportional hazard ratio (HR) and 95% CI of overall survival (OS) using 28 cancer types (TCGA IlluminaHiSeq_RNASeqV2, pan-cancer normalized log2(norm_counts+1) data, version 2016-08-16) (TCGA clinicalMatrix, phenotype data, version 2016-04-27) * Click on the image enlarge it in a new window. |
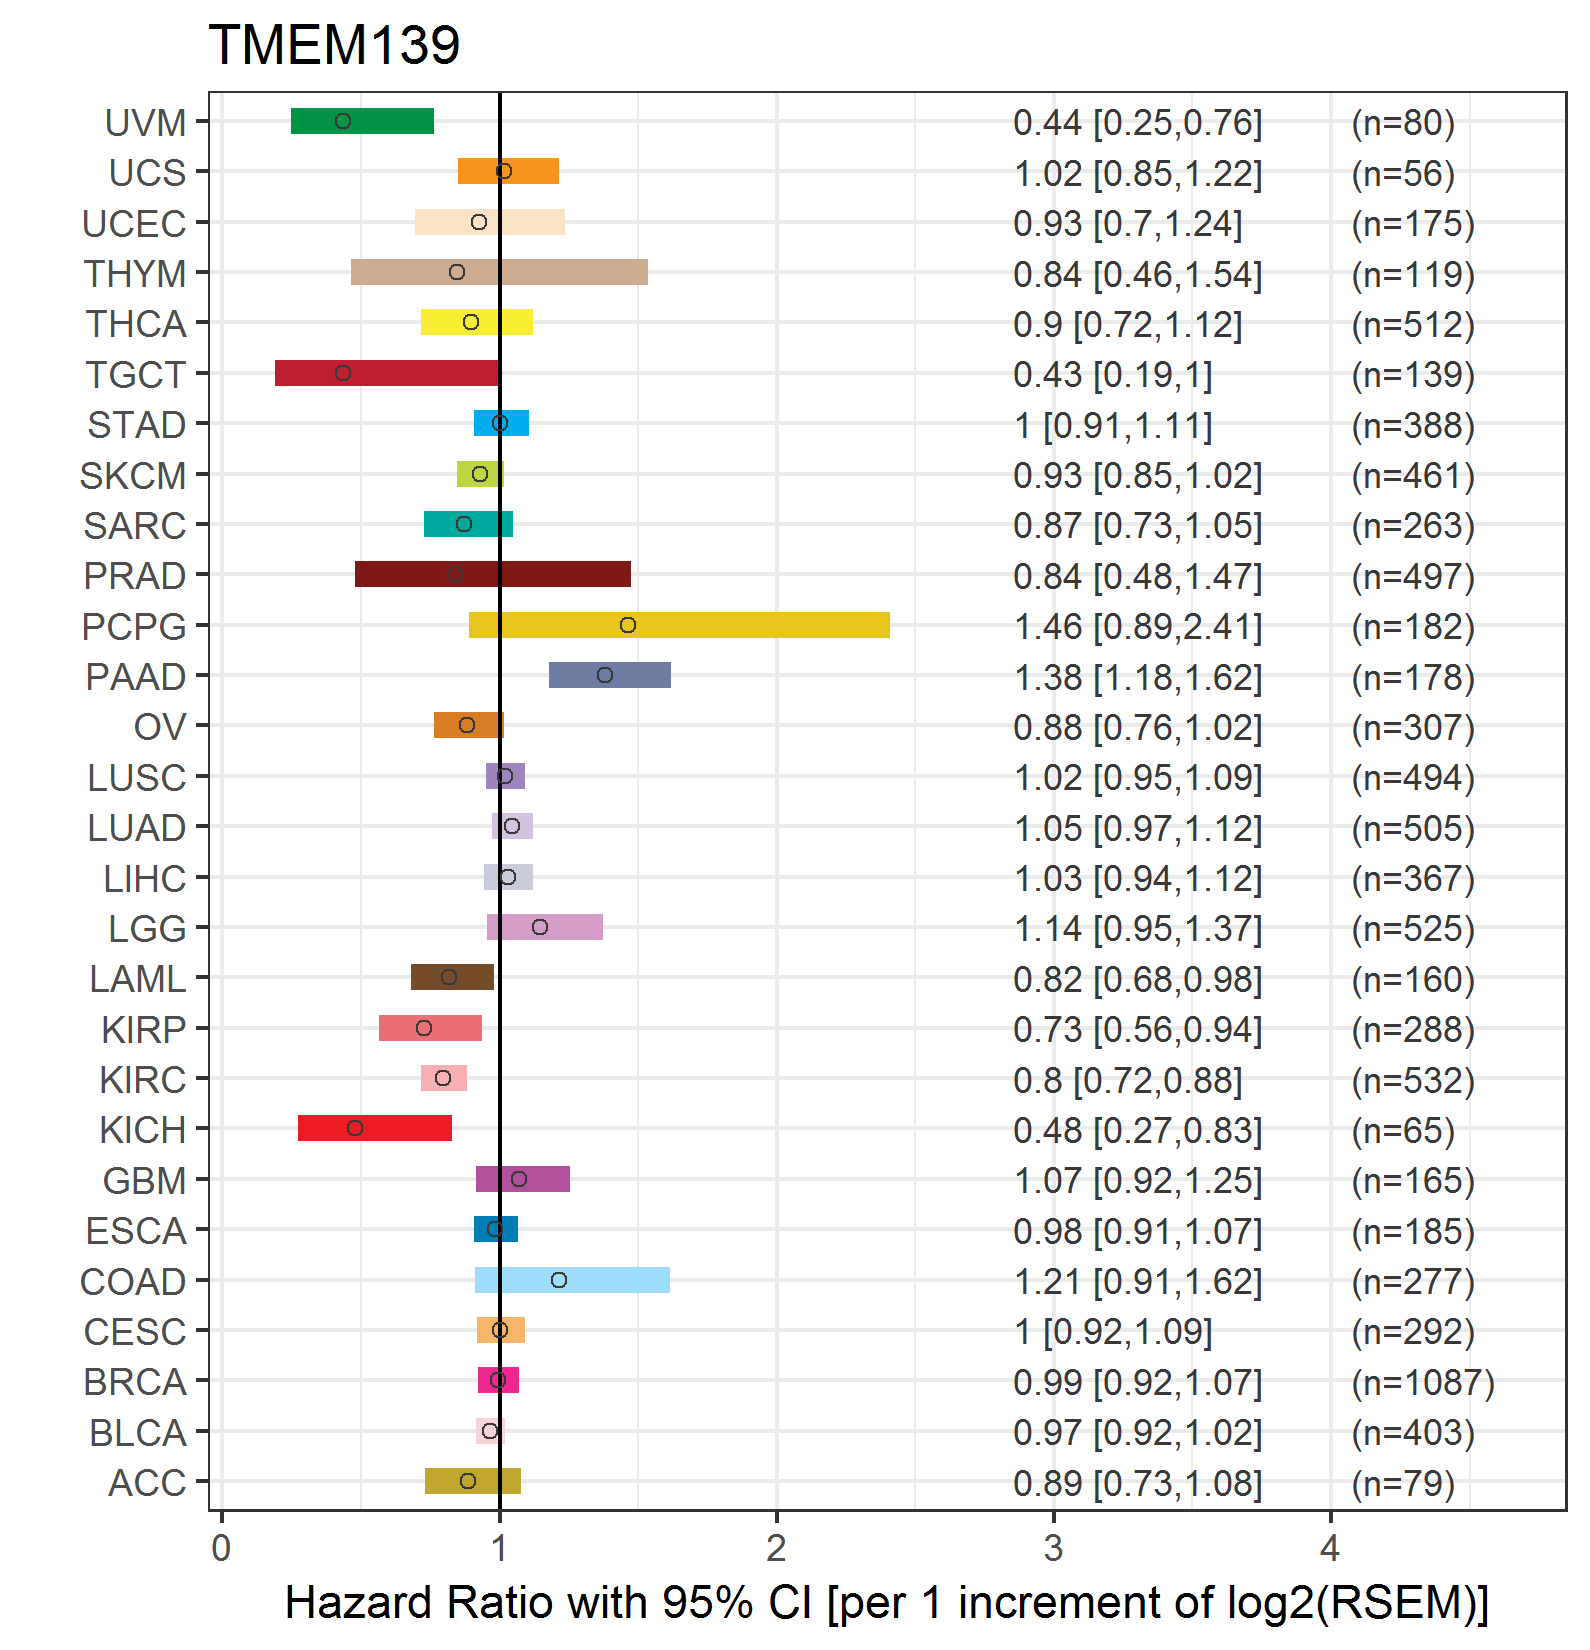 |
| Forest plot of Cox proportional hazard ratio (HR) and 95% CI of relapse free survival (RFS) using 28 cancer types (TCGA IlluminaHiSeq_RNASeqV2, pan-cancer normalized log2(norm_counts+1) data, version 2016-08-16) (TCGA clinicalMatrix, phenotype data, version 2016-04-27) * Click on the image enlarge it in a new window. |
 |
| Top |
| TissGeneClin for TMEM139 |
| TissGeneDrug for TMEM139 |
| Drug information targeting TissGene (DrugBank Version 5.0.6, 2017-04-01) |
| DrugBank ID | Drug name | Drug activity | Drug type | Drug status |
| Top |
| TissGeneDisease for TMEM139 |
| Disease information associated with TissGene (DisGeNet, 2016-06-01) |
| Disease ID | Disease name | # pubmeds | Source |
| umls:C0027626 | Neoplasm Invasiveness | 1 | CTD_human |
|
Copyright 2016-Present - The University of Texas Health Science Center at Houston (UTHealth) Web File Viewing | How to Report, Fraud, Waste and Abuse | State of Texas | Statewide Search | Texas Homeland Security | Site Policies |