 |
| |
| |
| |
| |
| |
| |
|

| TissGeneSummary for CPB1 |
 Gene summary Gene summary |
| Basic gene information | Gene symbol | CPB1 |
| Gene name | carboxypeptidase B1 (tissue) | |
| Synonyms | CPB|PASP|PCPB | |
| Cytomap | UCSC genome browser: 3q24 | |
| Type of gene | protein-coding | |
| RefGenes | NM_001871.2, | |
| Description | carboxypeptidase Bpancreas-specific proteinpancreatic carboxypeptidase Bprocarboxypeptidase Bprotaminasetissue carboxypeptidase B | |
| Modification date | 20141207 | |
| dbXrefs | MIM : 114852 | |
| HGNC : HGNC | ||
| Ensembl : ENSG00000153002 | ||
| HPRD : 00271 | ||
| Vega : OTTHUMG00000159520 | ||
| Protein | UniProt: go to UniProt's Cross Reference DB Table | |
| Expression | CleanEX: HS_CPB1 | |
| BioGPS: 1360 | ||
| Pathway | NCI Pathway Interaction Database: CPB1 | |
| KEGG: CPB1 | ||
| REACTOME: CPB1 | ||
| Pathway Commons: CPB1 | ||
| Context | iHOP: CPB1 | |
| ligand binding site mutation search in PubMed: CPB1 | ||
| UCL Cancer Institute: CPB1 | ||
| Assigned class in TissGDB* | B | |
| Included tissue-specific gene expression resources | HPA,TiGER,GTEx | |
| Specific-tissues in normal samples (assigned by TissGDB using HPA, TiGER, and GTEx) | Pancreas | |
| Cancer types related to the specific-tissues in cancer samples (assigned by TissGDB using TCGA) | PAAD | |
| Reference showing the relevant tissue of CPB1 | ||
| Description by TissGene annotations | ||
| * Class A consists of genes with literature evidence and is part of the cTissGenes. Class B consists of only cTissGenes without additional evidence. The remaining genes belong to Class C. |
| Gene ontology having evidence of Inferred from Direct Assay (IDA) from Entrez |
| GO ID | GO term | PubMed ID |
| Top |
| TissGeneExp for CPB1 |
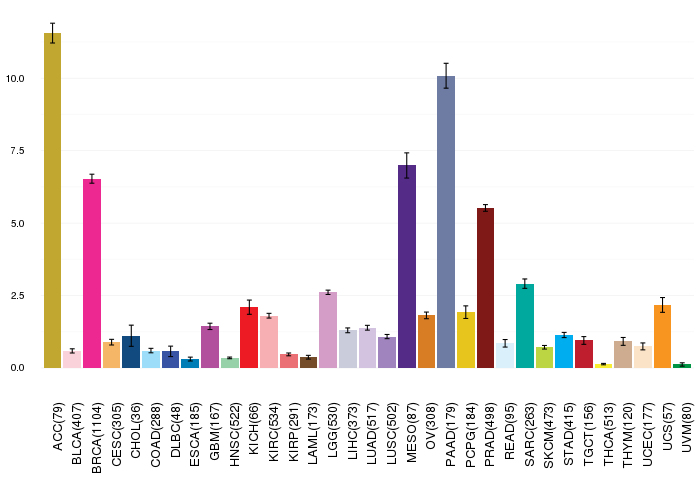
| Gene expressions across 28 cancer types (X-axis: cancer type and Y-axis: log2(norm_counts+1)) (TCGA IlluminaHiSeq_RNASeqV2, pan-cancer normalized log2(norm_counts+1) data, version 2016-08-16) |
 |
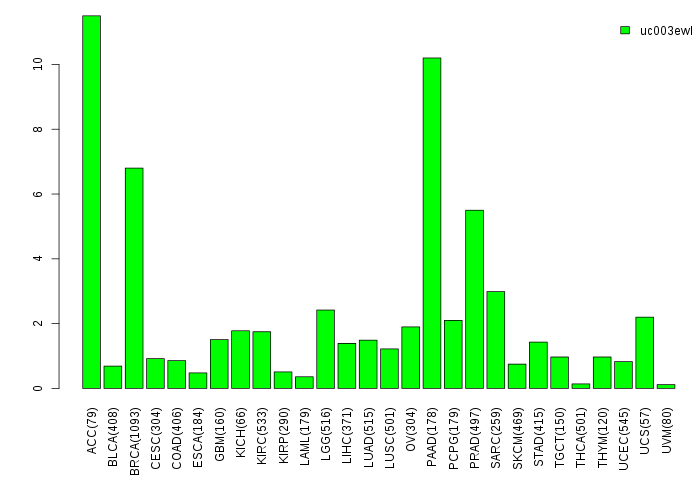
| Gene isoform expressions across 28 cancer types (X-axis: cancer type and Y-axis: log2(norm_counts+1)) (TCGA pan-cancer tcga_rsem_isoform_tpm, version 2016-09-01) |
 |
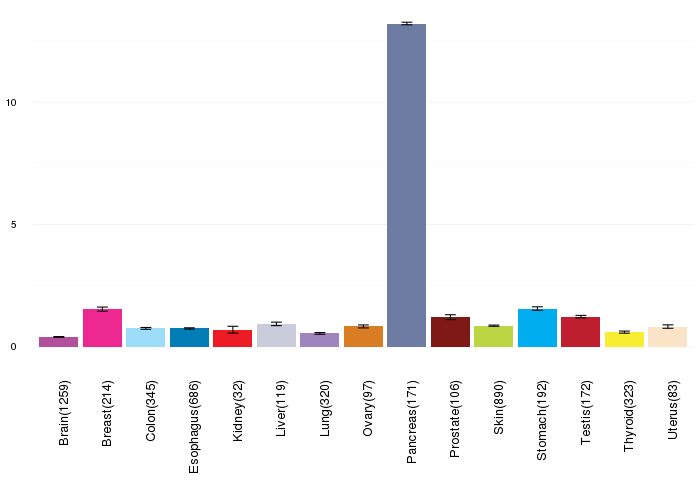
| Gene expressions across normal tissues of GTEx data (GTEx GTEx_Analysis_v6_RNA-seq_RNA-SeQCv1.1.8_gene_rpkm.gct) - Here, we shows the matched tissue types only among our 28 cancer types. |
 |
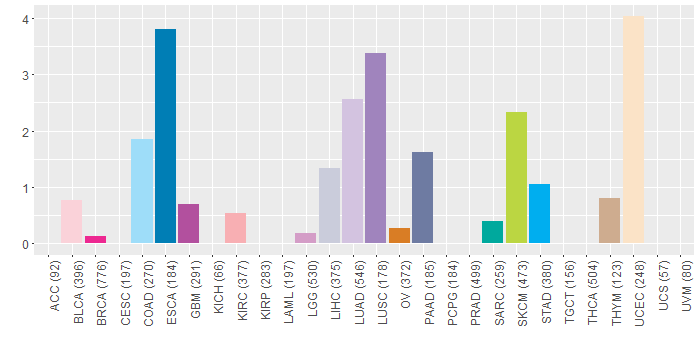
| Different expressions across 14 cancer types with more than 10 samples between matched tumors and normals (X-axis: cancer type and Y-axis: log2(norm_counts+1)) (TCGA IlluminaHiSeq_RNASeqV2, pan-cancer normalized log2(norm_counts+1) data, version 2016-08-16) |
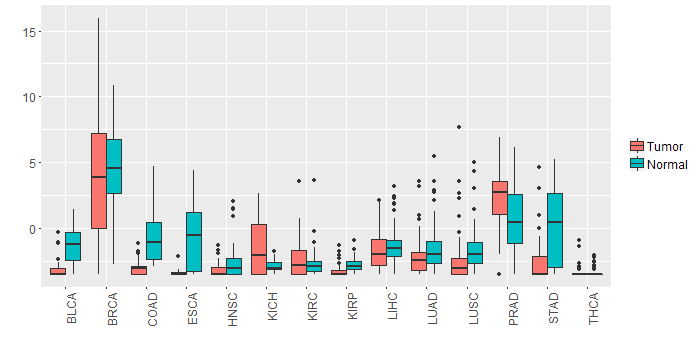 |
| - Significantly differentially expressed cancer types and information. (|Fold change|>1 and FDR<0.05) |
| Cancer type | Mean(exp) in tumor | Mean(exp) in matched normal | Log2FC | P-val. | FDR |
| COAD | -2.933619366 | -0.523392443 | -2.410226923 | 7.72E-06 | 3.65E-05 |
| KICH | -1.25161429 | -2.87606629 | 1.624452 | 0.00143 | 0.0030045 |
| BLCA | -2.948483132 | -1.284404184 | -1.664078947 | 0.000262 | 0.002427867 |
| STAD | -2.30451504 | 0.36078496 | -2.6653 | 7.13E-05 | 0.000580048 |
| PRAD | 2.514544095 | 0.646961403 | 1.867582692 | 7.55E-05 | 0.000326632 |
| Top |
| TissGene-miRNA for CPB1 |
| Significantly anti-correlated miRNAs of TissGene across 28 cancer types (Gene-miRNA relations from TargetScanHuman Relsease 7.1, Conserved_Site_Context_Scores.txt.zip, 06.01.2016) (TCGA IlluminaHiSeq_miRNASeq, log2(RPM+1) data, version 2016-11-21) (TCGA IlluminaHiSeq_RNASeqV2, log2(normalized_count+1) data, version 2016-08-16) (Spearman’s Rank Correlation (p-value<0.05 and coefficient<-0.25)) |
| Cancer type | miRNA id | miRNA accession | P-val. | Coeff. | # samples |
| Top |
| TissGeneMut for CPB1 |
| TissGeneSNV for CPB1 |
| nsSNV counts per each loci. Different colors of circles represent different cancer types. Circle size denotes number of samples. (TCGA somatic mutation (SNPs and small INDELs) data, version 2016-04-25) * Click on the image to enlarge it in a new window. |
 |
 |
| Somatic nucleotide variants of TissGene across 28 cancer types (X-axis: cancer type and Y-axis: % of mutated samples) The numbers in parentheses are numbers of samples with mutation (nsSNVs). (TCGA somatic mutation (SNPs and small INDELs) data, version 2016-04-25) |
 |
| - nsSNVs sorted by frequency. |
| AAchange | Cancer type | # samples |
| p.R291C | READ | 2 |
| p.N96S | SKCM | 2 |
| p.G160S | LIHC | 2 |
| p.L215M | LUSC | 1 |
| p.V10L | ESCA | 1 |
| p.R237H | READ | 1 |
| p.R291H | HNSC | 1 |
| p.Q104R | SARC | 1 |
| p.G24_splice | UCEC | 1 |
| p.R380Q | SKCM | 1 |
| p.A256G | LUAD | 1 |
| p.T376P | SKCM | 1 |
| p.L83V | LUAD | 1 |
| p.W128C | LUAD | 1 |
| p.D288N | THYM | 1 |
| p.N165S | UCEC | 1 |
| p.E123K | SKCM | 1 |
| p.G151V | LUSC | 1 |
| p.Y306* | PAAD | 1 |
| p.R108W | BLCA | 1 |
| p.K84* | LUSC | 1 |
| p.D211E | GBM | 1 |
| p.Y306X | PAAD | 1 |
| p.S143C | LUAD | 1 |
| p.F212L | ESCA | 1 |
| p.E87X | ESCA | 1 |
| p.M309I | PAAD | 1 |
| p.H176Y | LUAD | 1 |
| p.E126V | LIHC | 1 |
| p.L2M | LGG | 1 |
| p.Q60X | KIRC | 1 |
| p.P250H | LUAD | 1 |
| p.R42C | SKCM | 1 |
| p.E43Q | LUAD | 1 |
| p.W365* | SKCM | 1 |
| p.A352S | UCEC | 1 |
| p.S141Y | LUAD | 1 |
| p.R395W | COAD | 1 |
| p.L97Q | LIHC | 1 |
| p.A317S | LUAD | 1 |
| p.K235N | BLCA | 1 |
| p.R291C | STAD | 1 |
| p.Y367D | SKCM | 1 |
| p.R178K | BRCA | 1 |
| p.R252K | SKCM | 1 |
| p.H64N | LIHC | 1 |
| p.E391V | LUAD | 1 |
| p.R42H | GBM | 1 |
| p.R291C | COAD | 1 |
| p.D51N | SKCM | 1 |
| p.P275S | COAD | 1 |
| p.R152C | OV | 1 |
| p.S296F | HNSC | 1 |
| p.Q104K | LUAD | 1 |
| p.L83I | UCEC | 1 |
| p.H16R | STAD | 1 |
| p.K235N | HNSC | 1 |
| p.S307C | LUSC | 1 |
| p.G360V | ESCA | 1 |
| p.H304Y | SKCM | 1 |
| p.R231* | UCEC | 1 |
| p.A339D | PAAD | 1 |
| p.R152C | ESCA | 1 |
| p.D208N | COAD | 1 |
| p.R110C | SKCM | 1 |
| p.E280* | BLCA | 1 |
| p.R237L | ESCA | 1 |
| p.A133S | ESCA | 1 |
| p.R29C | UCEC | 1 |
| p.E399K | SKCM | 1 |
| p.R152C | STAD | 1 |
| p.Q60* | KIRC | 1 |
| p.Y223H | LUAD | 1 |
| p.A329S | HNSC | 1 |
| p.T47M | UCEC | 1 |
| p.K166X | KIRC | 1 |
| p.P250H | LUSC | 1 |
| p.A45D | STAD | 1 |
| p.Y90* | LUSC | 1 |
| p.V132A | UCEC | 1 |
| p.R231Q | LUAD | 1 |
| p.G360E | LUAD | 1 |
| p.R152H | UCEC | 1 |
| p.R42H | UCEC | 1 |
| p.D172E | COAD | 1 |
| Top |
| TissGeneCNV for CPB1 |
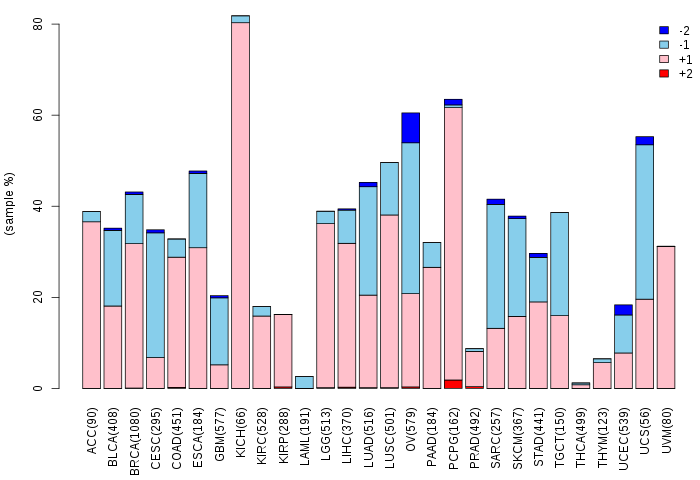
| Copy number variations of TissGene across 28 cancer types (X-axis: cancer type and Y-axis: % of CNV samples) (TCGA Gistic2_CopyNumber_Gistic2_all_data_by_genes, Gistic2 copy number data, version 2016-08-16) |
 |
| Top |
| TissGeneFusions for CPB1 |
| Fusion genes including TissGene (ChimerDB 3.0, 2016-12-01 and TCGA fusion Portal 2015-12-01) |
| Database | Src | Cancer type | Sample | Fusion gene | ORF | 5'-gene BP | 3'-gene BP |
| Chimerdb3.0 | ChiTaRs | NA | T10370 | CPB1-CPB1 | chr3:148577969 | chr3:148577880 | |
| Chimerdb3.0 | ChiTaRs | NA | BP325131 | CPB1-CPB1 | chr3:148562318 | chr3:148545598 | |
| Chimerdb3.0 | ChiTaRs | NA | BP325294 | CPB1-CPB1 | chr3:148563073 | chr3:148545596 | |
| Chimerdb3.0 | ChiTaRs | NA | BM263604 | CPB1-CPB1 | chr3:148577716 | chr3:148577696 | |
| TCGAfusionPortal | PRADA | OV | TCGA-13-1495-01A | HPS3-CPB1 | Out-of-frame | Chr3:148847727 | Chr3:148575244 |
| Top |
| TissGeneNet for CPB1 |
| Co-expressed gene networks based on protein-protein interaction data (CePIN) (TCGA IlluminaHiSeq_RNASeqV2, pan-cancer normalized log2(norm_counts+1) data, version 2016-08-16) (PINA2 ppi data) |
| Top |
| TissGeneProg for CPB1 |
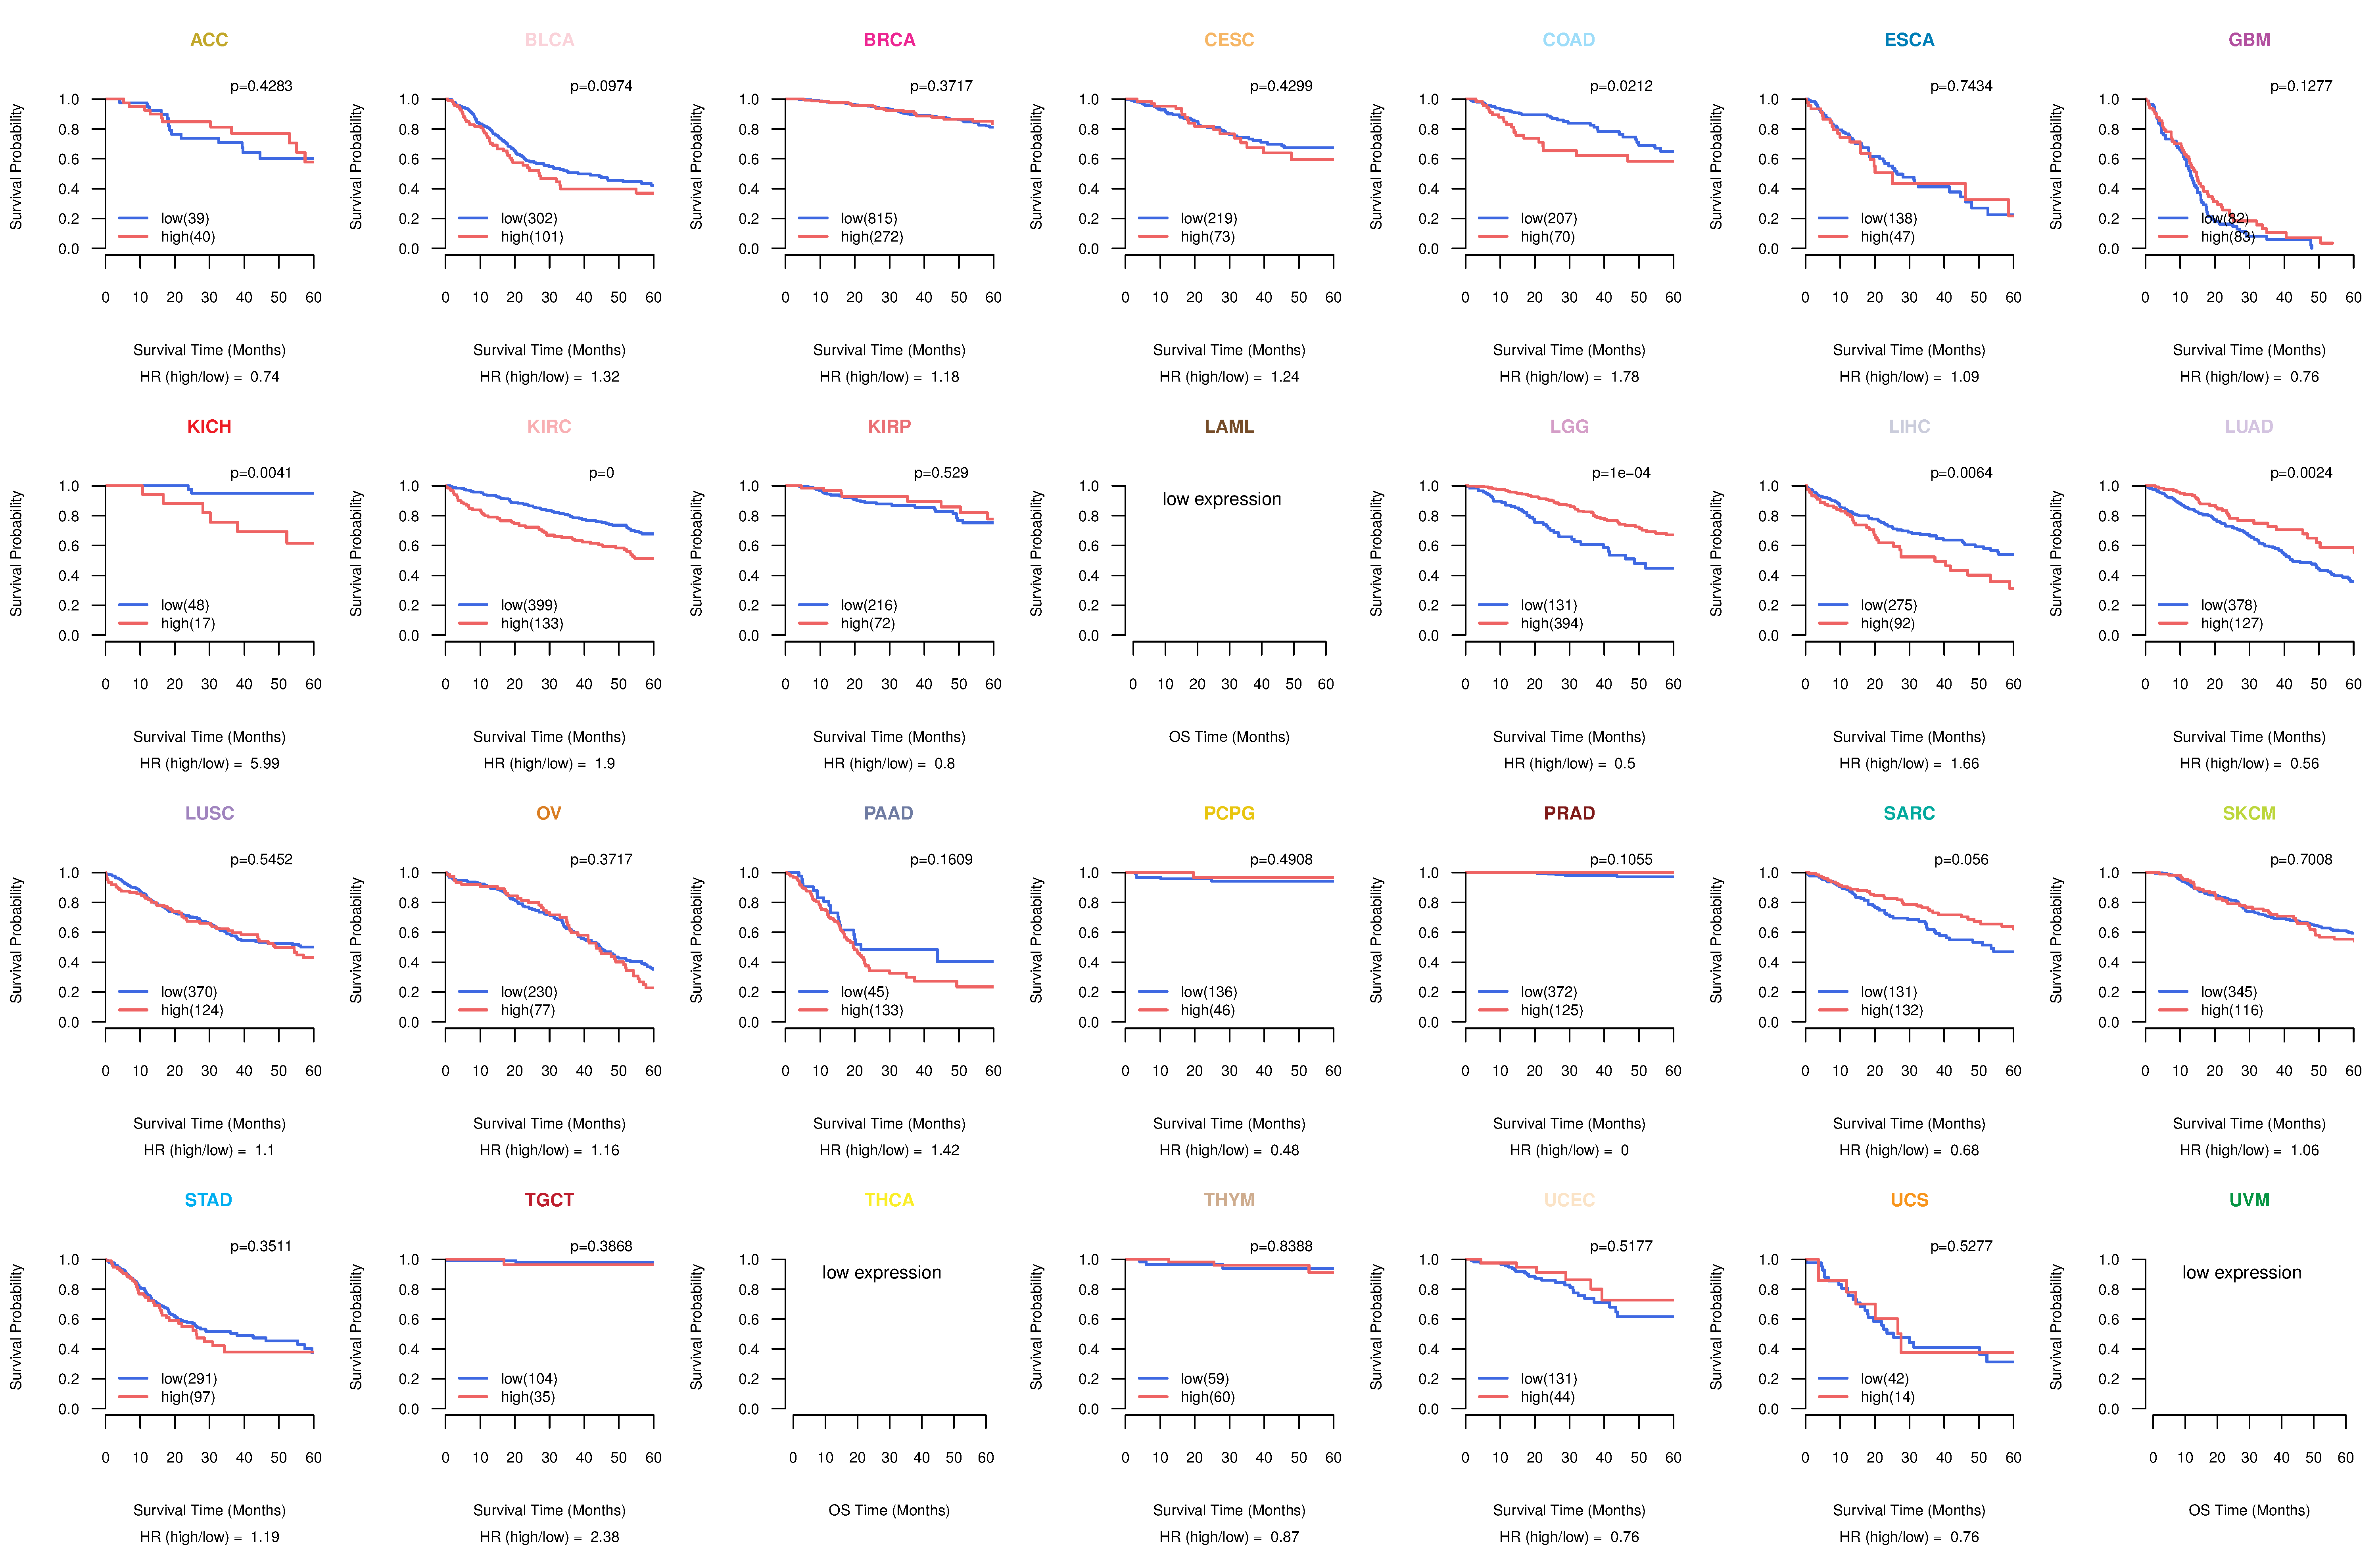
| Kaplan-Meier plots with logrank tests of overall survival (OS) using 28 cancer types (TCGA IlluminaHiSeq_RNASeqV2, pan-cancer normalized log2(norm_counts+1) data, version 2016-08-16) (TCGA clinicalMatrix, phenotype data, version 2016-04-27) * Click on the image to enlarge it in a new window. |
 |
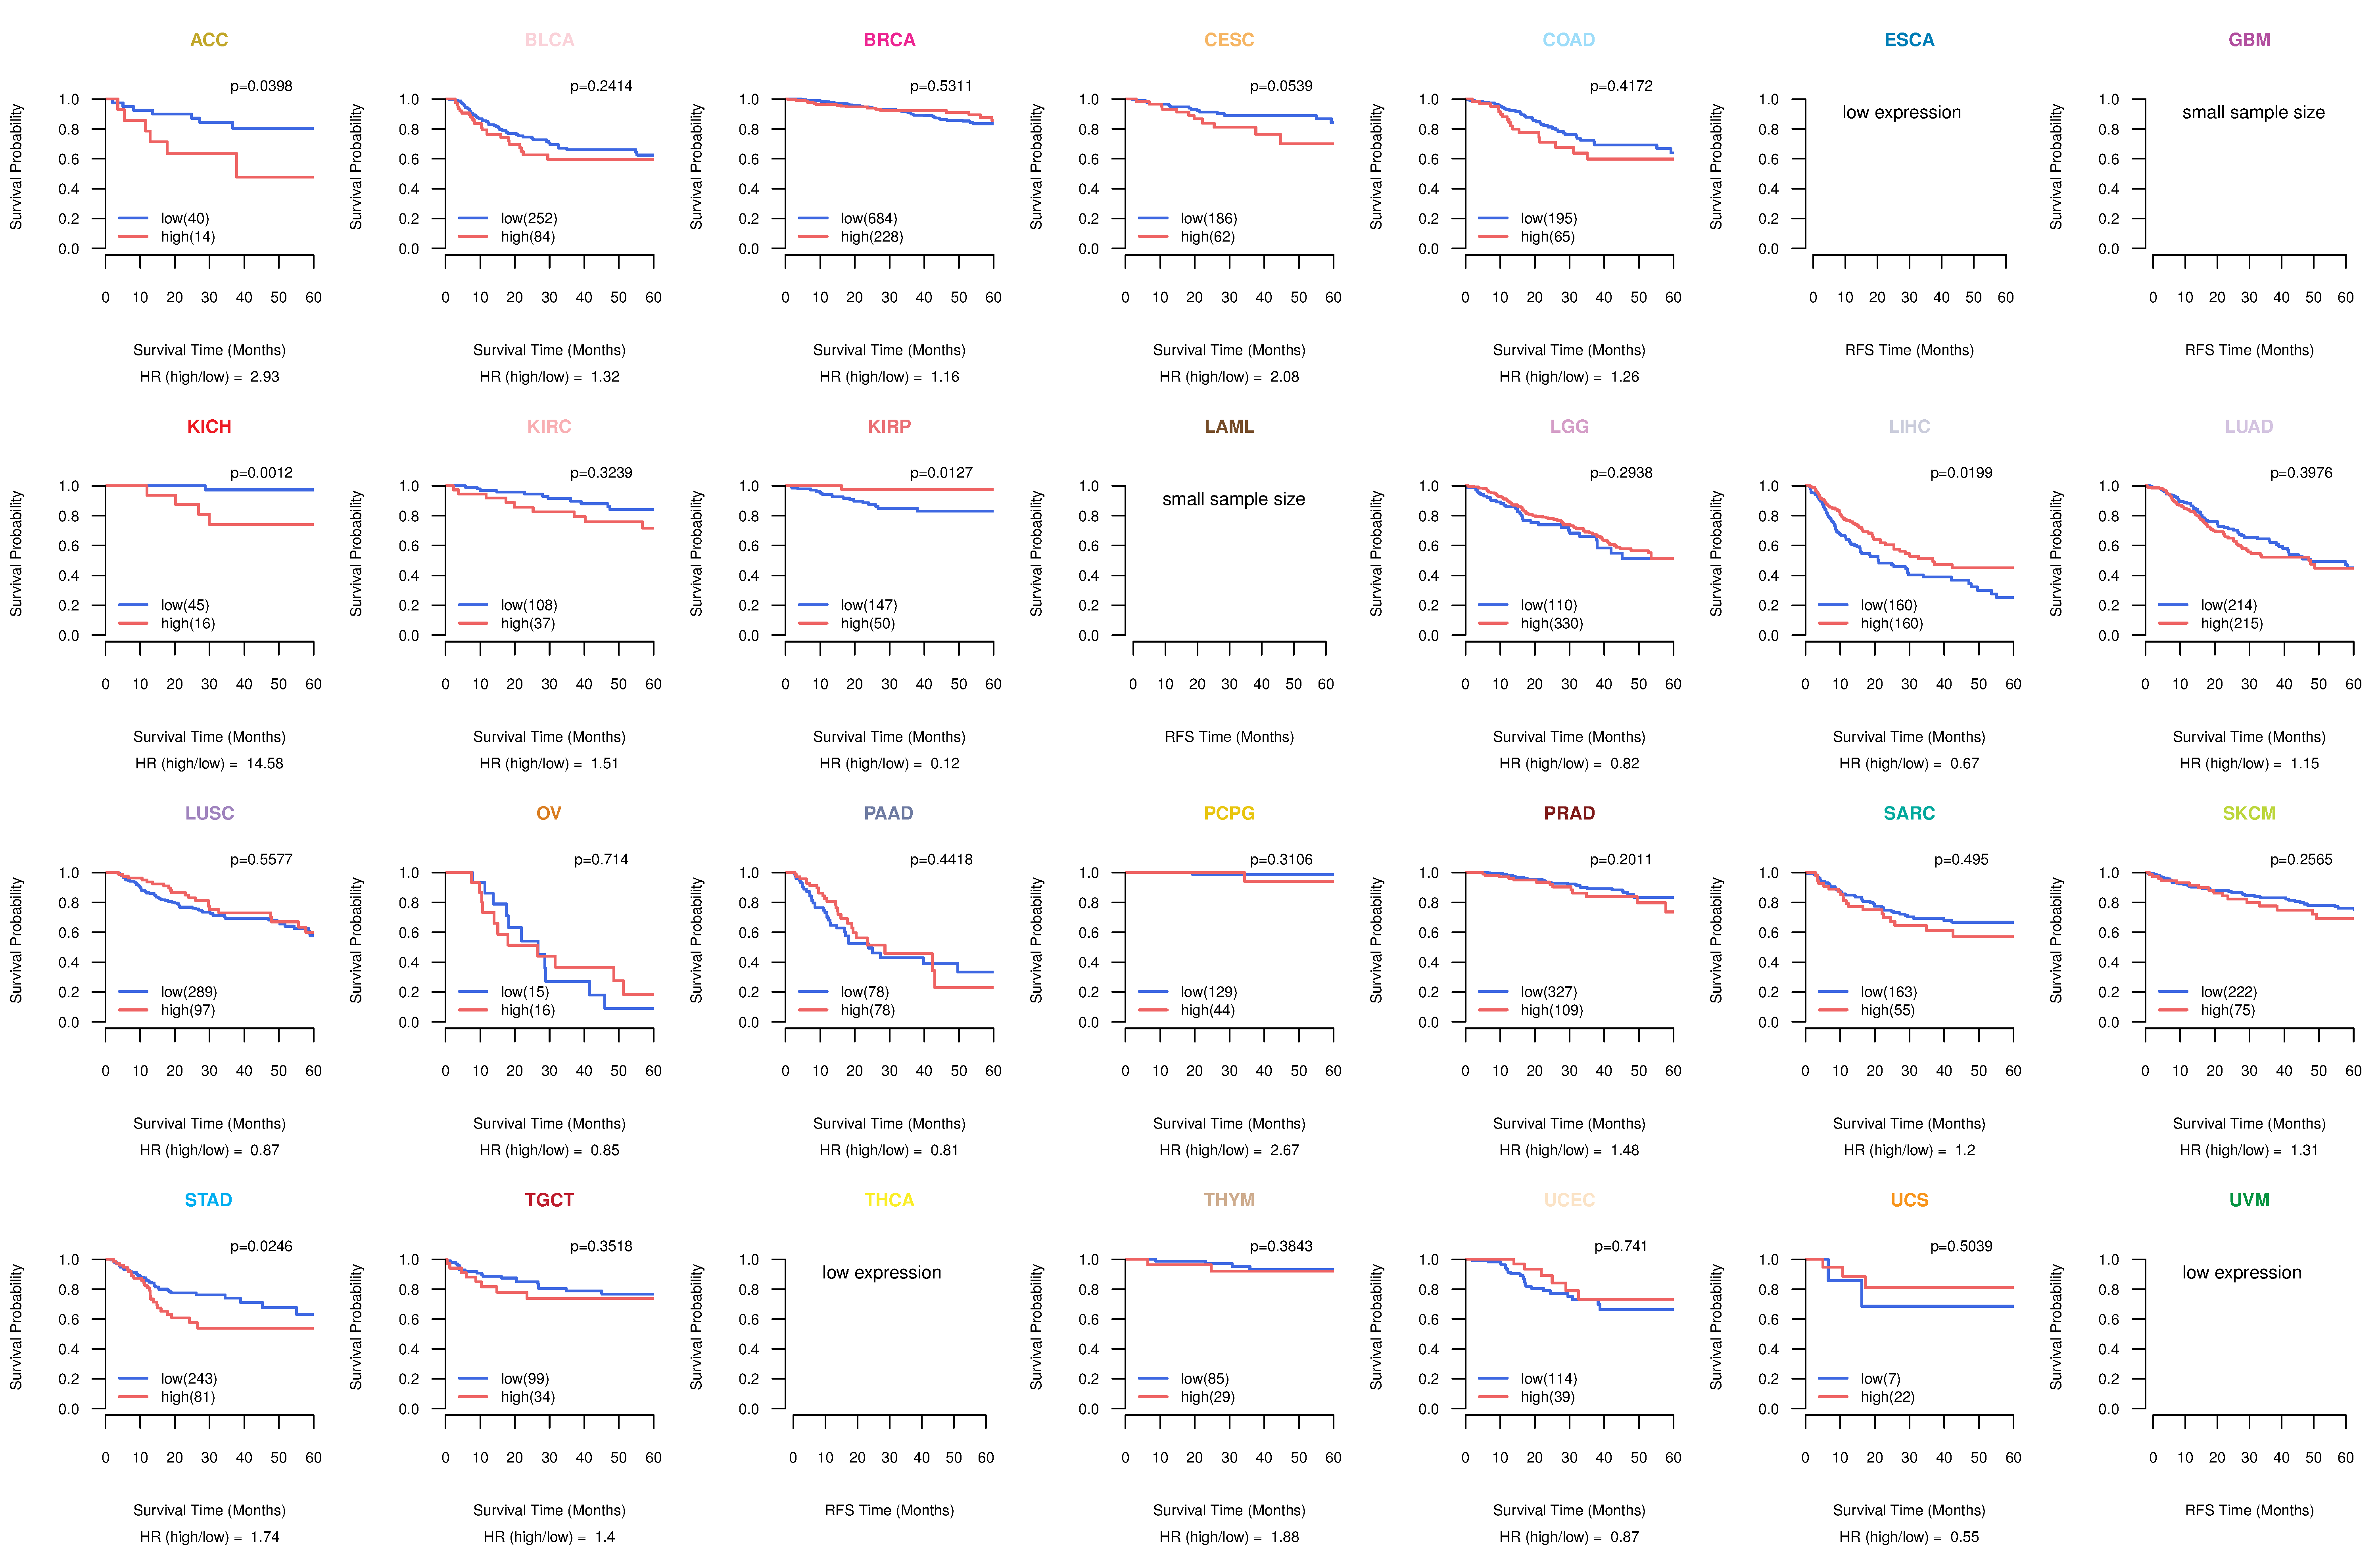
| Kaplan-Meier plots with logrank test of relapse free survival (RFS) using 28 cancer types (TCGA IlluminaHiSeq_RNASeqV2, pan-cancer normalized log2(norm_counts+1) data, version 2016-08-16) (TCGA clinicalMatrix, phenotype data, version 2016-04-27) * Click on the image enlarge it in a new window. |
 |
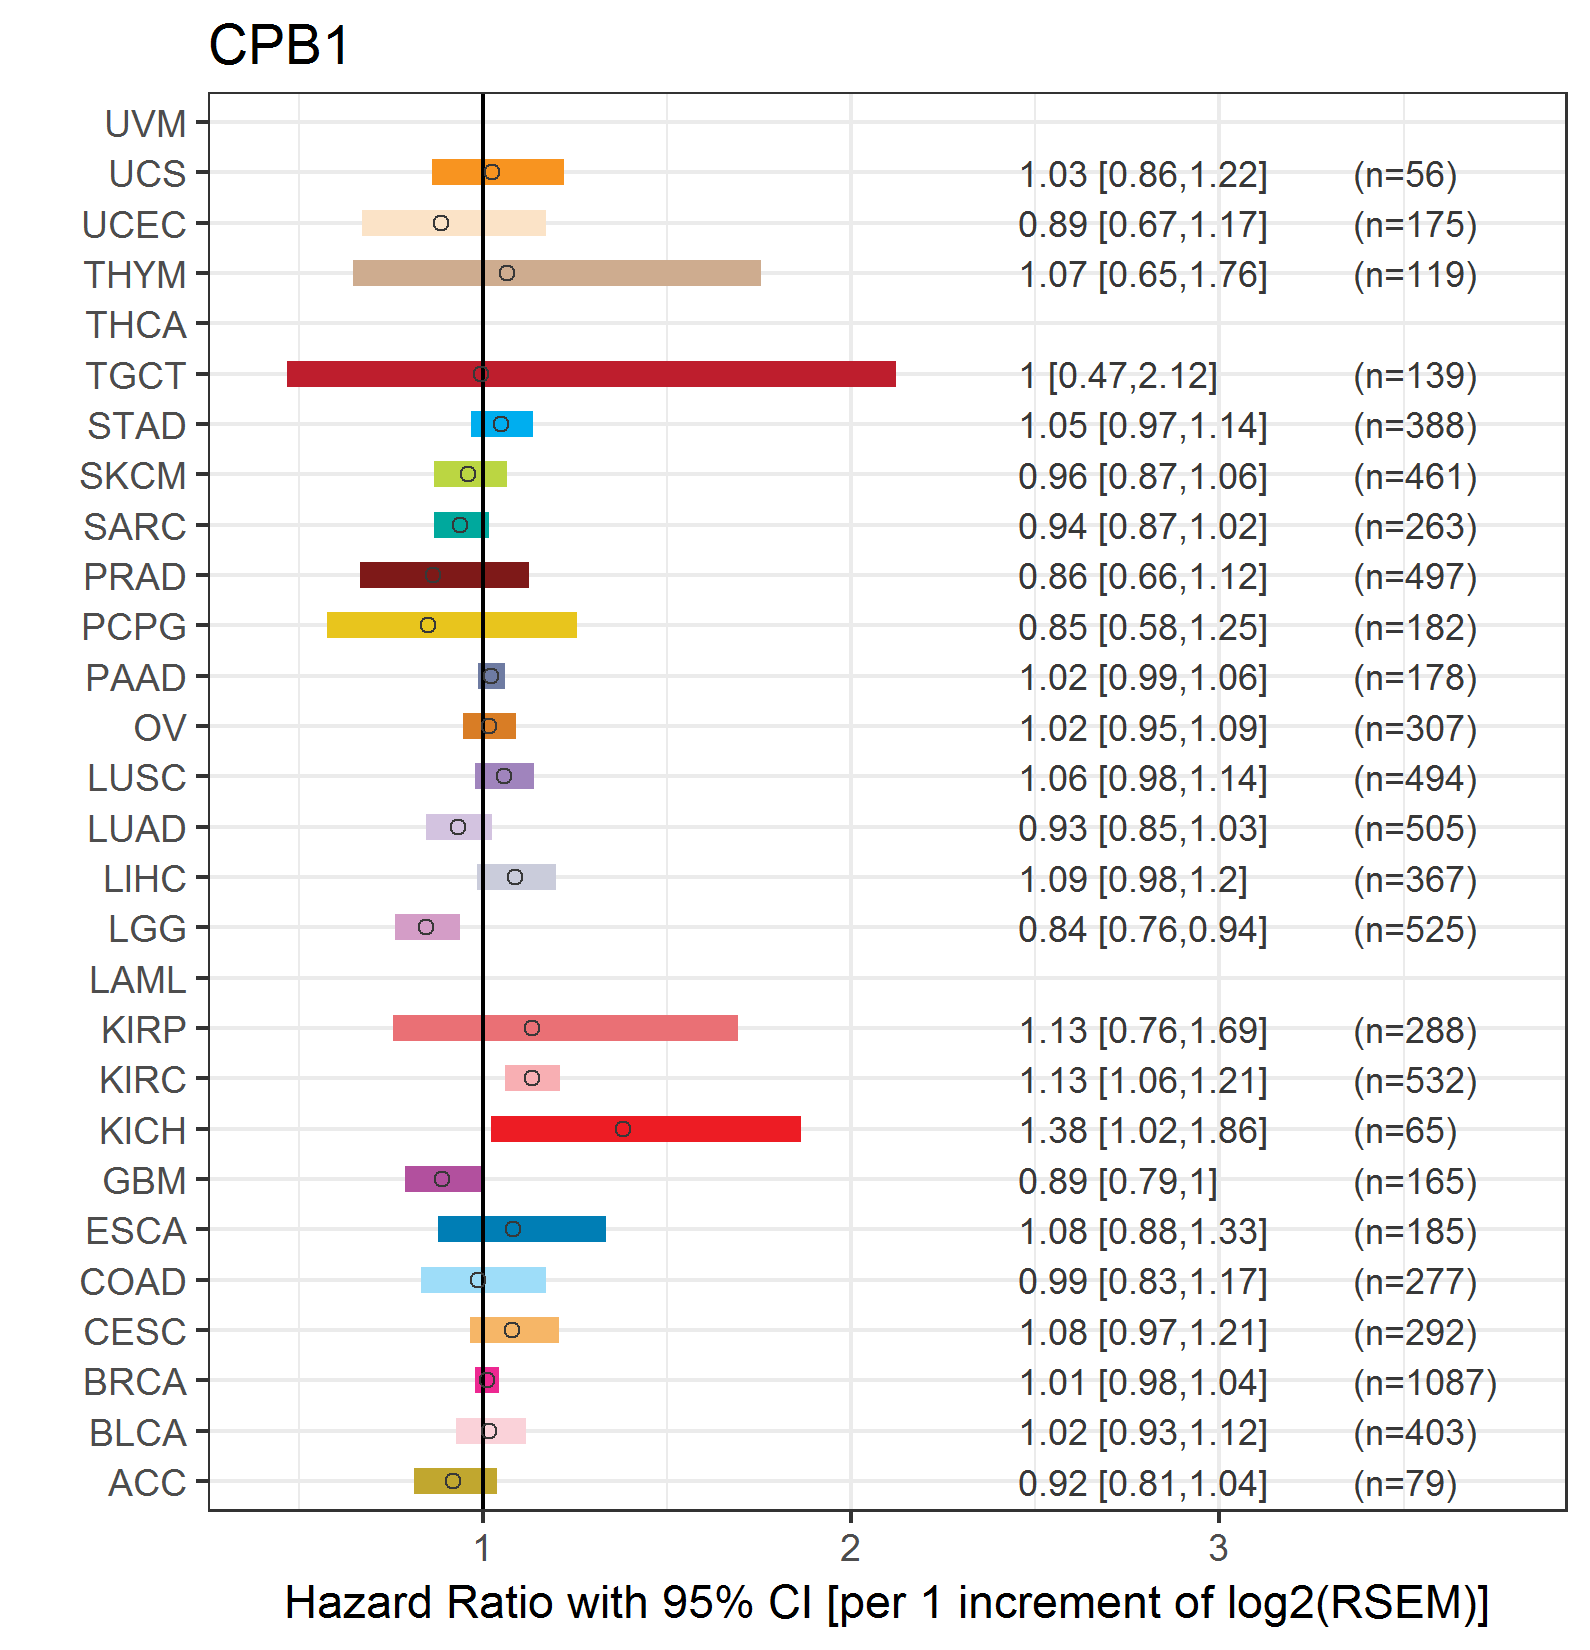
| Forest plot of Cox proportional hazard ratio (HR) and 95% CI of overall survival (OS) using 28 cancer types (TCGA IlluminaHiSeq_RNASeqV2, pan-cancer normalized log2(norm_counts+1) data, version 2016-08-16) (TCGA clinicalMatrix, phenotype data, version 2016-04-27) * Click on the image enlarge it in a new window. |
 |
| Forest plot of Cox proportional hazard ratio (HR) and 95% CI of relapse free survival (RFS) using 28 cancer types (TCGA IlluminaHiSeq_RNASeqV2, pan-cancer normalized log2(norm_counts+1) data, version 2016-08-16) (TCGA clinicalMatrix, phenotype data, version 2016-04-27) * Click on the image enlarge it in a new window. |
 |
| Top |
| TissGeneClin for CPB1 |
| TissGeneDrug for CPB1 |
| Drug information targeting TissGene (DrugBank Version 5.0.6, 2017-04-01) |
| DrugBank ID | Drug name | Drug activity | Drug type | Drug status |
| Top |
| TissGeneDisease for CPB1 |
| Disease information associated with TissGene (DisGeNet, 2016-06-01) |
| Disease ID | Disease name | # pubmeds | Source |
| umls:C0003873 | Rheumatoid Arthritis | 2 | BeFree |
| umls:C0029408 | Degenerative polyarthritis | 2 | BeFree |
| umls:C0001339 | Acute pancreatitis | 1 | BeFree |
| umls:C0003850 | Arteriosclerosis | 1 | BeFree |
| umls:C0003864 | Arthritis | 1 | BeFree |
| umls:C0004153 | Atherosclerosis | 1 | BeFree |
| umls:C0040336 | Tobacco Use Disorder | 1 | GAD |
| umls:C2931788 | Atypical Hemolytic Uremic Syndrome | 1 | BeFree |
|
Copyright 2016-Present - The University of Texas Health Science Center at Houston (UTHealth) Web File Viewing | How to Report, Fraud, Waste and Abuse | State of Texas | Statewide Search | Texas Homeland Security | Site Policies |