 |
| |
| |
| |
| |
| |
| |
|

| TissGeneSummary for EFCAB3 |
 Gene summary Gene summary |
| Basic gene information | Gene symbol | EFCAB3 |
| Gene name | EF-hand calcium binding domain 3 | |
| Synonyms | - | |
| Cytomap | UCSC genome browser: 17q23.2 | |
| Type of gene | protein-coding | |
| RefGenes | NM_001144933.1, NM_173503.3, | |
| Description | EF-hand calcium-binding domain-containing protein 3 | |
| Modification date | 20141207 | |
| dbXrefs | HGNC : HGNC | |
| Ensembl : ENSG00000172421 | ||
| HPRD : 08077 | ||
| Vega : OTTHUMG00000179175 | ||
| Protein | UniProt: go to UniProt's Cross Reference DB Table | |
| Expression | CleanEX: HS_EFCAB3 | |
| BioGPS: 146779 | ||
| Pathway | NCI Pathway Interaction Database: EFCAB3 | |
| KEGG: EFCAB3 | ||
| REACTOME: EFCAB3 | ||
| Pathway Commons: EFCAB3 | ||
| Context | iHOP: EFCAB3 | |
| ligand binding site mutation search in PubMed: EFCAB3 | ||
| UCL Cancer Institute: EFCAB3 | ||
| Assigned class in TissGDB* | C | |
| Included tissue-specific gene expression resources | HPA,GTEx | |
| Specific-tissues in normal samples (assigned by TissGDB using HPA, TiGER, and GTEx) | Testis | |
| Cancer types related to the specific-tissues in cancer samples (assigned by TissGDB using TCGA) | TGCT | |
| Reference showing the relevant tissue of EFCAB3 | ||
| Description by TissGene annotations | ||
| * Class A consists of genes with literature evidence and is part of the cTissGenes. Class B consists of only cTissGenes without additional evidence. The remaining genes belong to Class C. |
| Gene ontology having evidence of Inferred from Direct Assay (IDA) from Entrez |
| GO ID | GO term | PubMed ID |
| Top |
| TissGeneExp for EFCAB3 |
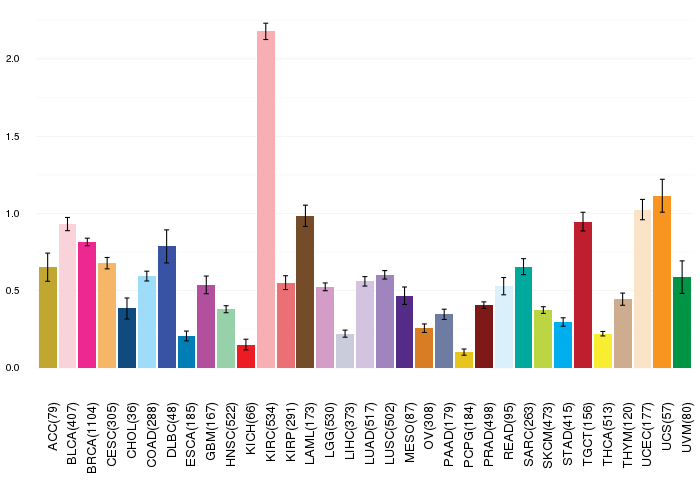
| Gene expressions across 28 cancer types (X-axis: cancer type and Y-axis: log2(norm_counts+1)) (TCGA IlluminaHiSeq_RNASeqV2, pan-cancer normalized log2(norm_counts+1) data, version 2016-08-16) |
 |
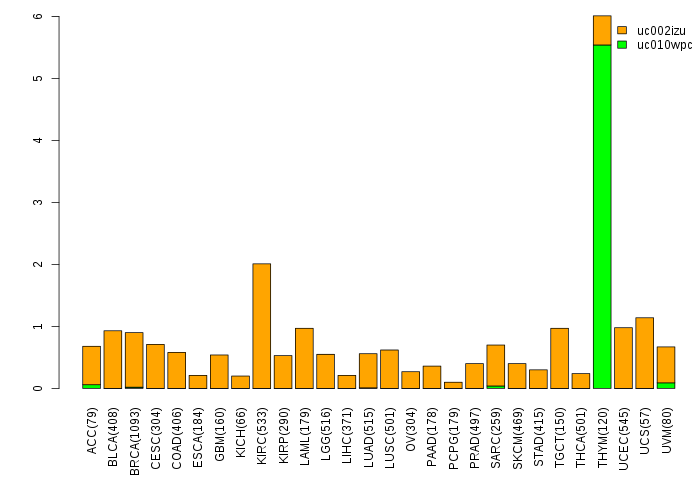
| Gene isoform expressions across 28 cancer types (X-axis: cancer type and Y-axis: log2(norm_counts+1)) (TCGA pan-cancer tcga_rsem_isoform_tpm, version 2016-09-01) |
 |
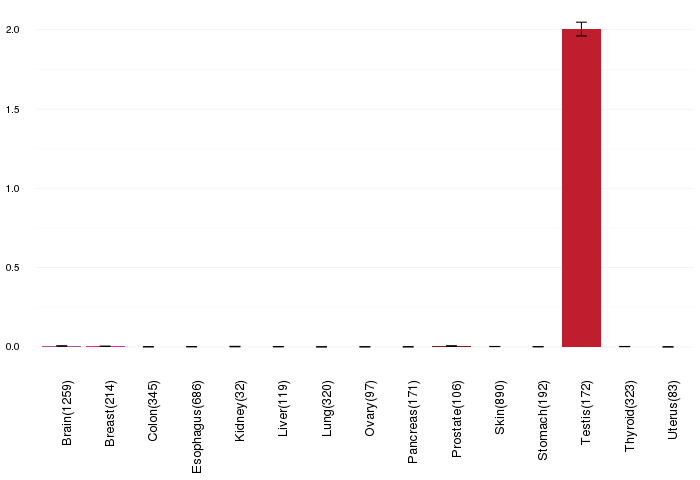
| Gene expressions across normal tissues of GTEx data (GTEx GTEx_Analysis_v6_RNA-seq_RNA-SeQCv1.1.8_gene_rpkm.gct) - Here, we shows the matched tissue types only among our 28 cancer types. |
 |
| Different expressions across 14 cancer types with more than 10 samples between matched tumors and normals (X-axis: cancer type and Y-axis: log2(norm_counts+1)) (TCGA IlluminaHiSeq_RNASeqV2, pan-cancer normalized log2(norm_counts+1) data, version 2016-08-16) |
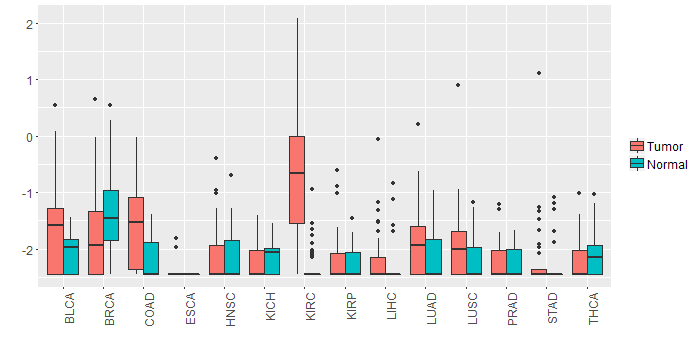 |
| - Significantly differentially expressed cancer types and information. (|Fold change|>1 and FDR<0.05) |
| Cancer type | Mean(exp) in tumor | Mean(exp) in matched normal | Log2FC | P-val. | FDR |
| KIRC | -0.749633853 | -2.327201909 | 1.577568056 | 4.03E-20 | 3.23E-19 |
| Top |
| TissGene-miRNA for EFCAB3 |
| Significantly anti-correlated miRNAs of TissGene across 28 cancer types (Gene-miRNA relations from TargetScanHuman Relsease 7.1, Conserved_Site_Context_Scores.txt.zip, 06.01.2016) (TCGA IlluminaHiSeq_miRNASeq, log2(RPM+1) data, version 2016-11-21) (TCGA IlluminaHiSeq_RNASeqV2, log2(normalized_count+1) data, version 2016-08-16) (Spearman’s Rank Correlation (p-value<0.05 and coefficient<-0.25)) |
| Cancer type | miRNA id | miRNA accession | P-val. | Coeff. | # samples |
| Top |
| TissGeneMut for EFCAB3 |
| TissGeneSNV for EFCAB3 |
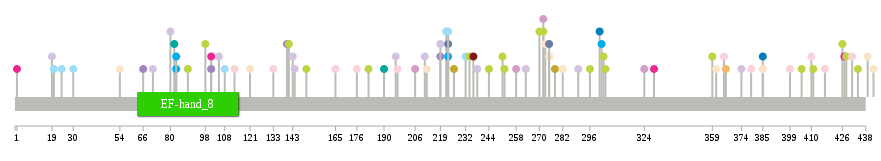
| nsSNV counts per each loci. Different colors of circles represent different cancer types. Circle size denotes number of samples. (TCGA somatic mutation (SNPs and small INDELs) data, version 2016-04-25) * Click on the image to enlarge it in a new window. |
 |
 |
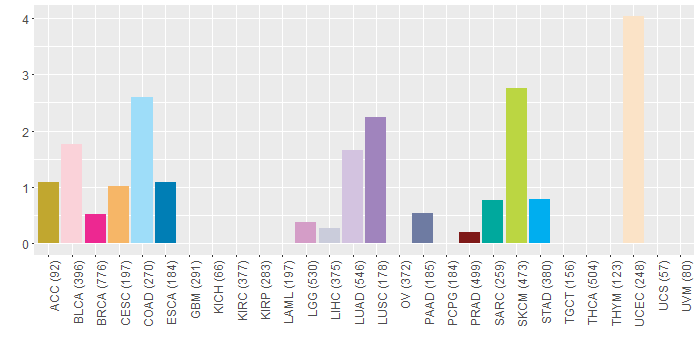
| Somatic nucleotide variants of TissGene across 28 cancer types (X-axis: cancer type and Y-axis: % of mutated samples) The numbers in parentheses are numbers of samples with mutation (nsSNVs). (TCGA somatic mutation (SNPs and small INDELs) data, version 2016-04-25) |
 |
| - nsSNVs sorted by frequency. |
| AAchange | Cancer type | # samples |
| p.E439* | UCEC | 1 |
| p.P324S | LGG | 1 |
| p.R426K | SKCM | 1 |
| p.P296S | SKCM | 1 |
| p.D417H | BLCA | 1 |
| p.I361V | UCEC | 1 |
| p.M101V | BRCA | 1 |
| p.D365H | BLCA | 1 |
| p.D98N | SKCM | 1 |
| p.A451T | UCEC | 1 |
| p.K316N | READ | 1 |
| p.A54T | UCEC | 1 |
| p.F108S | COAD | 1 |
| p.G236V | PRAD | 1 |
| p.L275I | PAAD | 1 |
| p.R385I | UCEC | 1 |
| p.G232S | COAD | 1 |
| p.L223I | PAAD | 1 |
| p.P176A | BLCA | 1 |
| p.V140F | LUSC | 1 |
| p.E212* | UCEC | 1 |
| p.R478K | SKCM | 1 |
| p.F121L | UCEC | 1 |
| p.N282S | UCEC | 1 |
| p.T113R | BLCA | 1 |
| p.P244S | SKCM | 1 |
| p.T379A | BLCA | 1 |
| p.A258V | LGG | 1 |
| p.R219K | LUSC | 1 |
| p.D270N | SKCM | 1 |
| p.E143* | LUAD | 1 |
| p.P19R | LUAD | 1 |
| p.K366N | CESC | 1 |
| p.L226H | ACC | 1 |
| p.M101K | LUSC | 1 |
| p.K24I | COAD | 1 |
| p.G251E | SKCM | 1 |
| p.G83* | STAD | 1 |
| p.Y452C | CESC | 1 |
| p.D150N | SKCM | 1 |
| p.G411E | SKCM | 1 |
| p.R482Q | LIHC | 1 |
| p.M1I | BRCA | 1 |
| p.Y141S | SKCM | 1 |
| p.F222C | COAD | 1 |
| p.R428K | SKCM | 1 |
| p.S157Y | READ | 1 |
| p.R399* | BLCA | 1 |
| p.R385I | ESCA | 1 |
| p.L117I | READ | 1 |
| p.S238* | LUAD | 1 |
| p.P272S | LGG | 1 |
| p.P71R | LUAD | 1 |
| p.G303E | SKCM | 1 |
| p.L278H | ACC | 1 |
| p.S442Y | UCEC | 1 |
| p.R480K | SKCM | 1 |
| p.R219* | LUAD | 1 |
| p.M133I | BLCA | 1 |
| p.T234I | SKCM | 1 |
| p.K15N | DLBC | 1 |
| p.T182I | SKCM | 1 |
| p.V301A | ESCA | 1 |
| p.K273T | UCEC | 1 |
| p.D302Y | STAD | 1 |
| p.V304M | SKCM | 1 |
| p.V252M | SKCM | 1 |
| p.P82Q | SARC | 1 |
| p.L144I | LUAD | 1 |
| p.L196I | LUAD | 1 |
| p.P30L | COAD | 1 |
| p.R410* | BLCA | 1 |
| p.Y89S | SKCM | 1 |
| p.I263F | LUAD | 1 |
| p.A206V | LGG | 1 |
| p.A374V | LUAD | 1 |
| p.I211F | LUAD | 1 |
| p.E329Q | BRCA | 1 |
| p.S457F | SKCM | 1 |
| p.S290* | LUAD | 1 |
| p.L275I | UCEC | 1 |
| p.G83X | STAD | 1 |
| p.G359E | SKCM | 1 |
| p.G477E | SKCM | 1 |
| p.F272C | SKCM | 1 |
| p.T431A | BLCA | 1 |
| p.Q105K | LUAD | 1 |
| p.S197* | BLCA | 1 |
| p.W434* | SKCM | 1 |
| p.L223I | COAD | 1 |
| p.D80Y | LUAD | 1 |
| p.L223I | STAD | 1 |
| p.F427S | BRCA | 1 |
| p.S20X | COAD | 1 |
| p.T165R | BLCA | 1 |
| p.P66A | LUSC | 1 |
| p.I190V | SARC | 1 |
| p.S405F | SKCM | 1 |
| Top |
| TissGeneCNV for EFCAB3 |
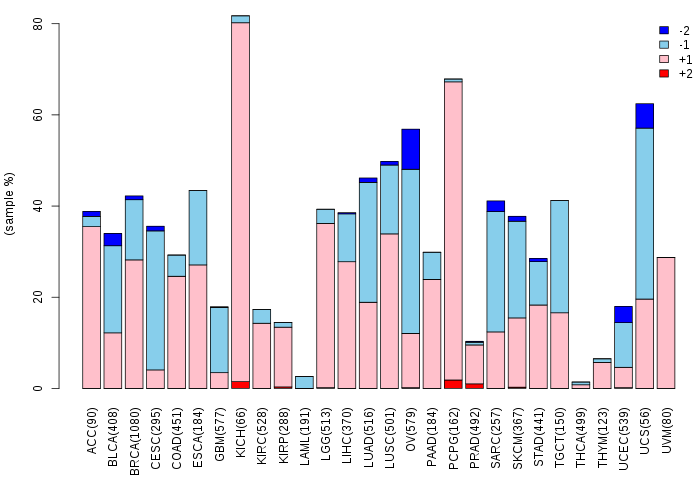
| Copy number variations of TissGene across 28 cancer types (X-axis: cancer type and Y-axis: % of CNV samples) (TCGA Gistic2_CopyNumber_Gistic2_all_data_by_genes, Gistic2 copy number data, version 2016-08-16) |
 |
| Top |
| TissGeneFusions for EFCAB3 |
| Fusion genes including TissGene (ChimerDB 3.0, 2016-12-01 and TCGA fusion Portal 2015-12-01) |
| Database | Src | Cancer type | Sample | Fusion gene | ORF | 5'-gene BP | 3'-gene BP |
| TCGAfusionPortal | PRADA | BRCA | TCGA-A8-A09I-01A | MBTD1-EFCAB3 | 5UTR-CDS | Chr17:49336504 | Chr17:60451175 |
| TCGAfusionPortal | PRADA | BRCA | TCGA-AN-A0FD-01A | RPS6KB1-EFCAB3 | CDS-5UTR | Chr17:57970686 | Chr17:60460324 |
| TCGAfusionPortal | PRADA | BRCA | TCGA-AR-A0TT-01A | AKAP8L-EFCAB3 | Out-of-frame | Chr19:15507961 | Chr17:60472429 |
| TCGAfusionPortal | PRADA | BRCA | TCGA-D8-A1JK-01A | TANC2-EFCAB3 | In-frame | Chr17:61278318 | Chr17:60451175 |
| Top |
| TissGeneNet for EFCAB3 |
| Co-expressed gene networks based on protein-protein interaction data (CePIN) (TCGA IlluminaHiSeq_RNASeqV2, pan-cancer normalized log2(norm_counts+1) data, version 2016-08-16) (PINA2 ppi data) |
| Top |
| TissGeneProg for EFCAB3 |
| Kaplan-Meier plots with logrank tests of overall survival (OS) using 28 cancer types (TCGA IlluminaHiSeq_RNASeqV2, pan-cancer normalized log2(norm_counts+1) data, version 2016-08-16) (TCGA clinicalMatrix, phenotype data, version 2016-04-27) * Click on the image to enlarge it in a new window. |
 |
| Kaplan-Meier plots with logrank test of relapse free survival (RFS) using 28 cancer types (TCGA IlluminaHiSeq_RNASeqV2, pan-cancer normalized log2(norm_counts+1) data, version 2016-08-16) (TCGA clinicalMatrix, phenotype data, version 2016-04-27) * Click on the image enlarge it in a new window. |
 |
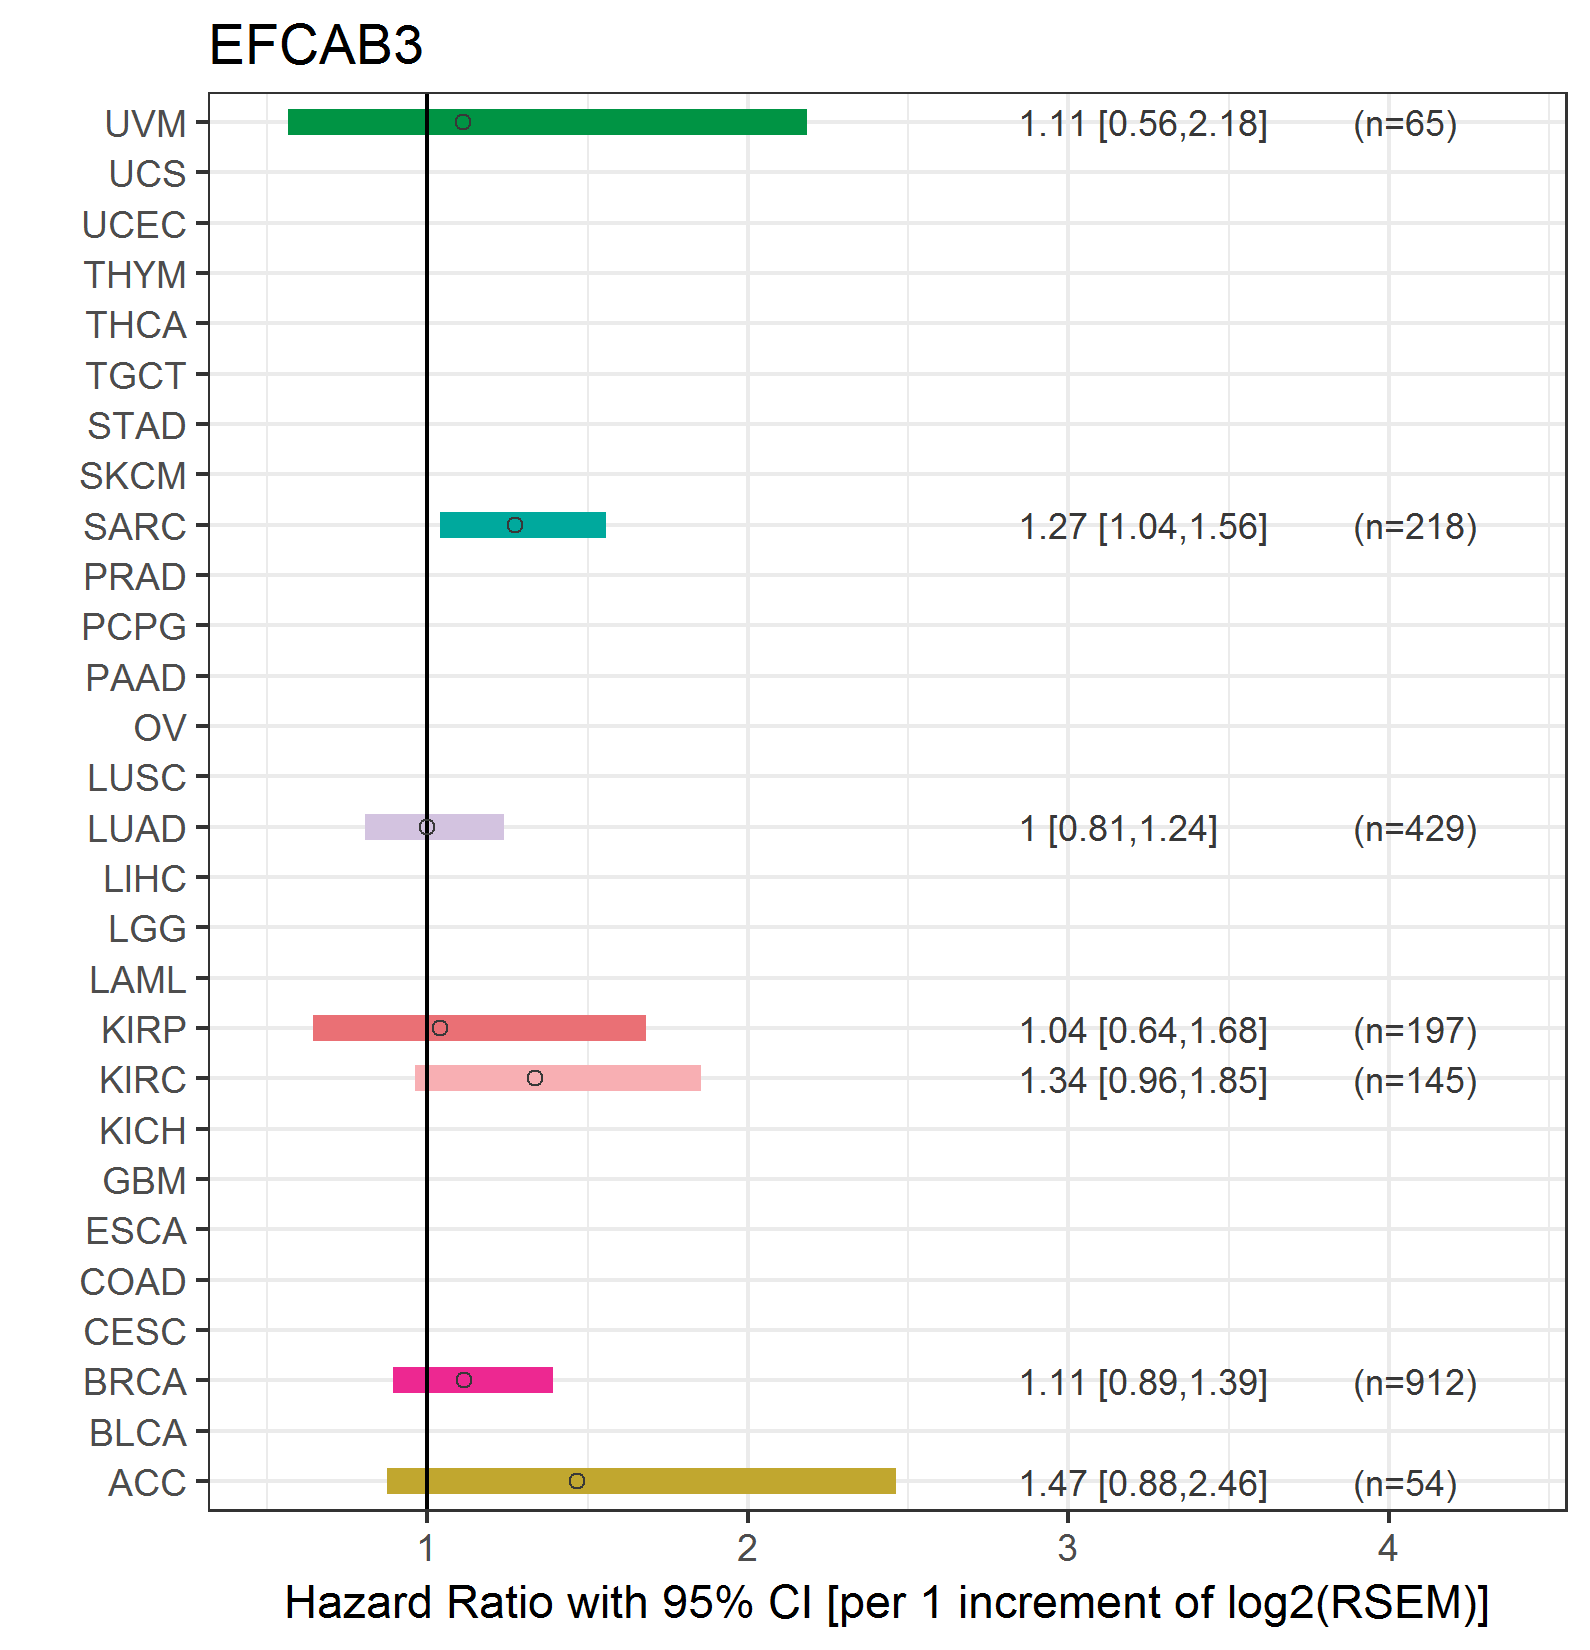
| Forest plot of Cox proportional hazard ratio (HR) and 95% CI of overall survival (OS) using 28 cancer types (TCGA IlluminaHiSeq_RNASeqV2, pan-cancer normalized log2(norm_counts+1) data, version 2016-08-16) (TCGA clinicalMatrix, phenotype data, version 2016-04-27) * Click on the image enlarge it in a new window. |
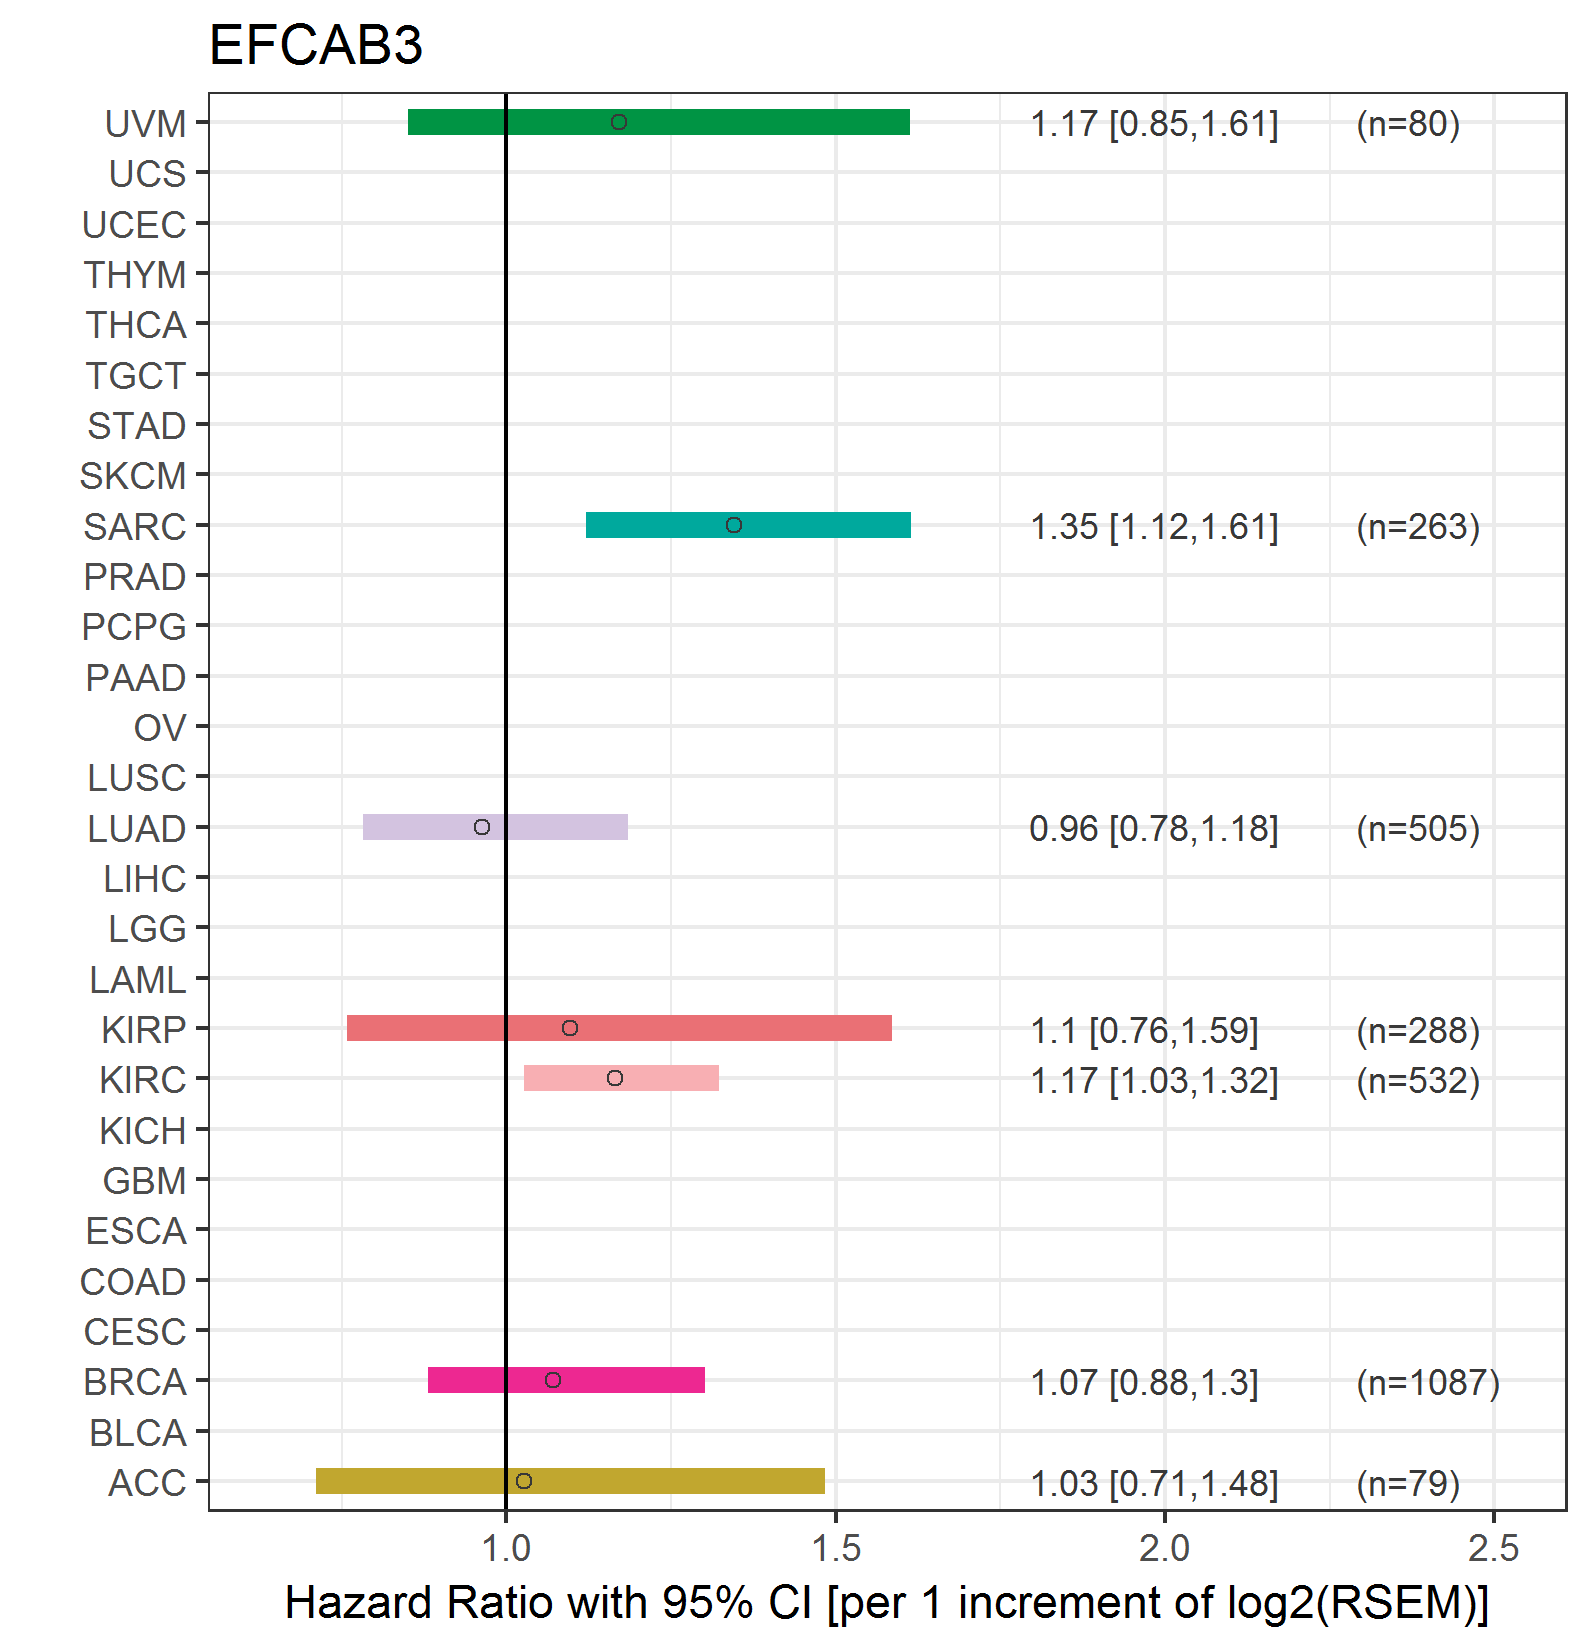 |
| Forest plot of Cox proportional hazard ratio (HR) and 95% CI of relapse free survival (RFS) using 28 cancer types (TCGA IlluminaHiSeq_RNASeqV2, pan-cancer normalized log2(norm_counts+1) data, version 2016-08-16) (TCGA clinicalMatrix, phenotype data, version 2016-04-27) * Click on the image enlarge it in a new window. |
 |
| Top |
| TissGeneClin for EFCAB3 |
| TissGeneDrug for EFCAB3 |
| Drug information targeting TissGene (DrugBank Version 5.0.6, 2017-04-01) |
| DrugBank ID | Drug name | Drug activity | Drug type | Drug status |
| Top |
| TissGeneDisease for EFCAB3 |
| Disease information associated with TissGene (DisGeNet, 2016-06-01) |
| Disease ID | Disease name | # pubmeds | Source |
| umls:C0040336 | Tobacco Use Disorder | 1 | GAD |
|
Copyright 2016-Present - The University of Texas Health Science Center at Houston (UTHealth) Web File Viewing | How to Report, Fraud, Waste and Abuse | State of Texas | Statewide Search | Texas Homeland Security | Site Policies |