 |
| |
| |
| |
| |
| |
| |
|

| TissGeneSummary for KLC3 |
 Gene summary Gene summary |
| Basic gene information | Gene symbol | KLC3 |
| Gene name | kinesin light chain 3 | |
| Synonyms | KLC2|KLC2L|KLCt|KNS2B | |
| Cytomap | UCSC genome browser: 19q13 | |
| Type of gene | protein-coding | |
| RefGenes | NM_177417.2, NM_145275.1, | |
| Description | kinesin light chain 2 | |
| Modification date | 20141207 | |
| dbXrefs | MIM : 601334 | |
| HGNC : HGNC | ||
| Ensembl : ENSG00000104892 | ||
| HPRD : 03212 | ||
| Vega : OTTHUMG00000143722 | ||
| Protein | UniProt: go to UniProt's Cross Reference DB Table | |
| Expression | CleanEX: HS_KLC3 | |
| BioGPS: 147700 | ||
| Pathway | NCI Pathway Interaction Database: KLC3 | |
| KEGG: KLC3 | ||
| REACTOME: KLC3 | ||
| Pathway Commons: KLC3 | ||
| Context | iHOP: KLC3 | |
| ligand binding site mutation search in PubMed: KLC3 | ||
| UCL Cancer Institute: KLC3 | ||
| Assigned class in TissGDB* | C | |
| Included tissue-specific gene expression resources | HPA,GTEx | |
| Specific-tissues in normal samples (assigned by TissGDB using HPA, TiGER, and GTEx) | Skin | |
| Cancer types related to the specific-tissues in cancer samples (assigned by TissGDB using TCGA) | SKCM | |
| Reference showing the relevant tissue of KLC3 | ||
| Description by TissGene annotations | ||
| * Class A consists of genes with literature evidence and is part of the cTissGenes. Class B consists of only cTissGenes without additional evidence. The remaining genes belong to Class C. |
| Gene ontology having evidence of Inferred from Direct Assay (IDA) from Entrez |
| GO ID | GO term | PubMed ID |
| Top |
| TissGeneExp for KLC3 |
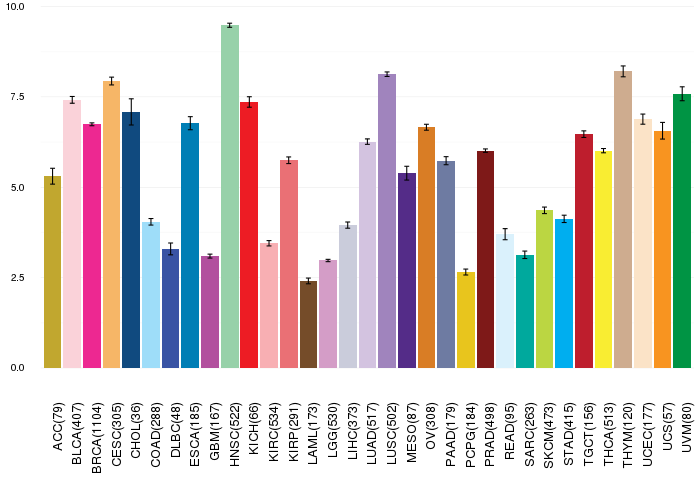
| Gene expressions across 28 cancer types (X-axis: cancer type and Y-axis: log2(norm_counts+1)) (TCGA IlluminaHiSeq_RNASeqV2, pan-cancer normalized log2(norm_counts+1) data, version 2016-08-16) |
 |
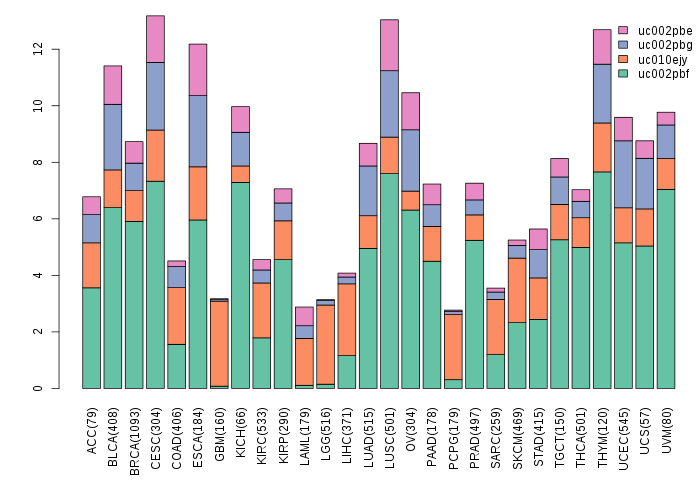
| Gene isoform expressions across 28 cancer types (X-axis: cancer type and Y-axis: log2(norm_counts+1)) (TCGA pan-cancer tcga_rsem_isoform_tpm, version 2016-09-01) |
 |
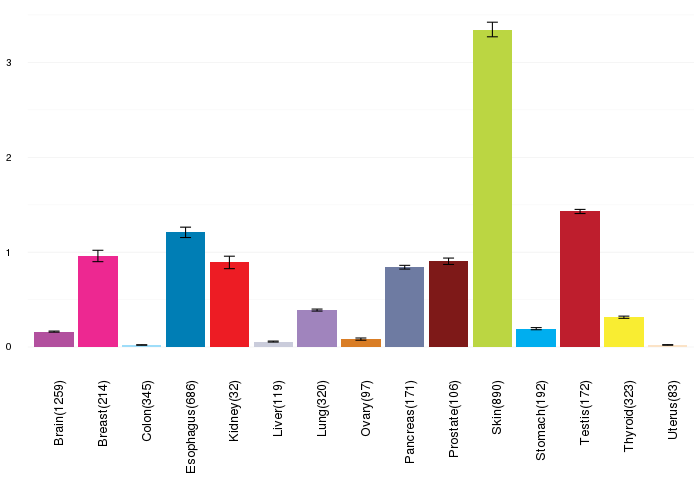
| Gene expressions across normal tissues of GTEx data (GTEx GTEx_Analysis_v6_RNA-seq_RNA-SeQCv1.1.8_gene_rpkm.gct) - Here, we shows the matched tissue types only among our 28 cancer types. |
 |
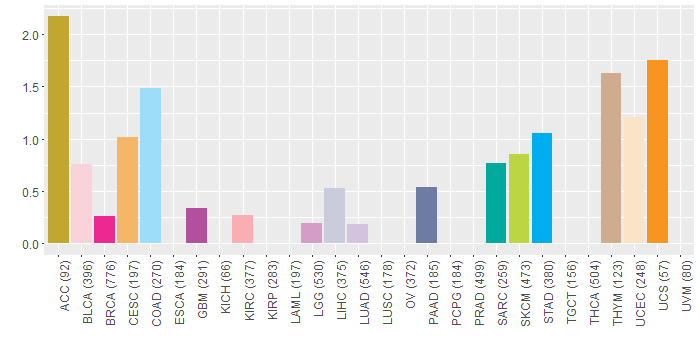
| Different expressions across 14 cancer types with more than 10 samples between matched tumors and normals (X-axis: cancer type and Y-axis: log2(norm_counts+1)) (TCGA IlluminaHiSeq_RNASeqV2, pan-cancer normalized log2(norm_counts+1) data, version 2016-08-16) |
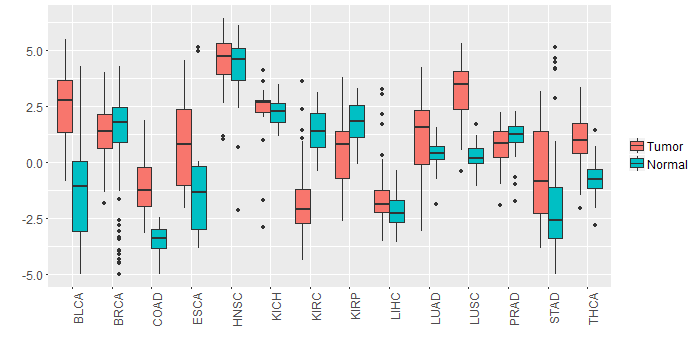 |
| - Significantly differentially expressed cancer types and information. (|Fold change|>1 and FDR<0.05) |
| Cancer type | Mean(exp) in tumor | Mean(exp) in matched normal | Log2FC | P-val. | FDR |
| LUSC | 3.194832144 | 0.239312536 | 2.955519608 | 4.12E-24 | 8.07E-23 |
| KIRC | -1.788833052 | 1.426223893 | -3.215056944 | 3.41E-30 | 6.53E-29 |
| COAD | -0.99255677 | -3.49485677 | 2.5023 | 3.28E-10 | 4.04E-09 |
| THCA | 0.977164547 | -0.676267656 | 1.653432203 | 2.70E-15 | 3.60E-14 |
| KIRP | 0.51128674 | 1.739171115 | -1.227884375 | 0.000811 | 0.00229289 |
| BLCA | 2.436124404 | -1.012191385 | 3.448315789 | 2.82E-05 | 0.000423762 |
| Top |
| TissGene-miRNA for KLC3 |
| Significantly anti-correlated miRNAs of TissGene across 28 cancer types (Gene-miRNA relations from TargetScanHuman Relsease 7.1, Conserved_Site_Context_Scores.txt.zip, 06.01.2016) (TCGA IlluminaHiSeq_miRNASeq, log2(RPM+1) data, version 2016-11-21) (TCGA IlluminaHiSeq_RNASeqV2, log2(normalized_count+1) data, version 2016-08-16) (Spearman’s Rank Correlation (p-value<0.05 and coefficient<-0.25)) |
| Cancer type | miRNA id | miRNA accession | P-val. | Coeff. | # samples |
| Top |
| TissGeneMut for KLC3 |
| TissGeneSNV for KLC3 |
| nsSNV counts per each loci. Different colors of circles represent different cancer types. Circle size denotes number of samples. (TCGA somatic mutation (SNPs and small INDELs) data, version 2016-04-25) * Click on the image to enlarge it in a new window. |
 |
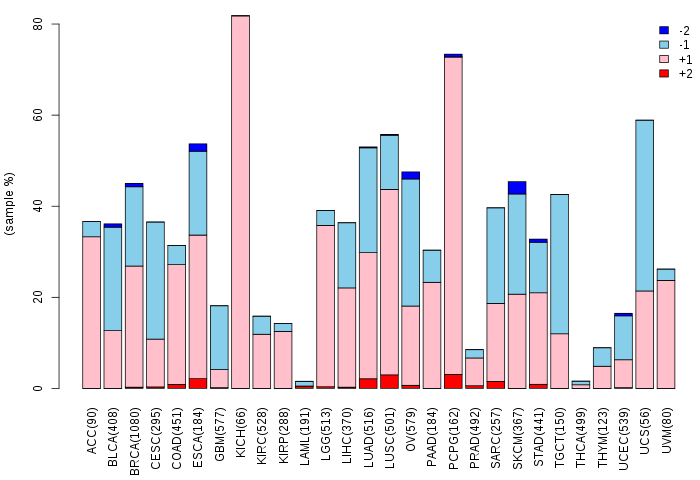
| Somatic nucleotide variants of TissGene across 28 cancer types (X-axis: cancer type and Y-axis: % of mutated samples) The numbers in parentheses are numbers of samples with mutation (nsSNVs). (TCGA somatic mutation (SNPs and small INDELs) data, version 2016-04-25) |
 |
| - nsSNVs sorted by frequency. |
| AAchange | Cancer type | # samples |
| p.R184C | SKCM | 1 |
| p.L374M | STAD | 1 |
| p.R372P | BLCA | 1 |
| p.R17C | UCEC | 1 |
| p.R206H | COAD | 1 |
| p.P159Q | LIHC | 1 |
| p.K476N | BLCA | 1 |
| p.E149Q | CESC | 1 |
| p.R442C | GBM | 1 |
| p.E113D | SARC | 1 |
| p.T430I | UCEC | 1 |
| p.T416I | UCEC | 1 |
| p.P424S | LGG | 1 |
| p.E367K | SKCM | 1 |
| p.S181F | LUAD | 1 |
| p.M465R | KIRC | 1 |
| p.R506W | CESC | 1 |
| p.V24M | DLBC | 1 |
| p.Q406* | PAAD | 1 |
| p.S383* | PAAD | 1 |
| p.Q392X | PAAD | 1 |
| p.E181K | STAD | 1 |
| p.Q392* | PAAD | 1 |
| p.E195K | STAD | 1 |
| p.L341M | COAD | 1 |
| p.Y237C | HNSC | 1 |
| p.R330H | ACC | 1 |
| p.T293M | UCEC | 1 |
| p.L360M | STAD | 1 |
| p.K144N | BRCA | 1 |
| p.S397* | PAAD | 1 |
| p.P182A | LUAD | 1 |
| p.R316H | ACC | 1 |
| p.P369H | HNSC | 1 |
| p.Q481H | STAD | 1 |
| p.T307M | UCEC | 1 |
| p.E400X | UCS | 1 |
| p.A240V | ACC | 1 |
| p.R358P | BLCA | 1 |
| p.E84K | COAD | 1 |
| p.E414* | UCS | 1 |
| p.A36V | COAD | 1 |
| p.R206H | BRCA | 1 |
| p.R222L | THYM | 1 |
| p.S383X | PAAD | 1 |
| p.E281K | SARC | 1 |
| p.G60S | LIHC | 1 |
| p.S150F | SKCM | 1 |
| p.D420N | SKCM | 1 |
| p.R492Q | STAD | 1 |
| p.E409* | BLCA | 1 |
| p.D351G | STAD | 1 |
| p.P383H | HNSC | 1 |
| p.K462N | BLCA | 1 |
| p.R308L | THYM | 1 |
| Top |
| TissGeneCNV for KLC3 |
| Copy number variations of TissGene across 28 cancer types (X-axis: cancer type and Y-axis: % of CNV samples) (TCGA Gistic2_CopyNumber_Gistic2_all_data_by_genes, Gistic2 copy number data, version 2016-08-16) |
 |
| Top |
| TissGeneFusions for KLC3 |
| Fusion genes including TissGene (ChimerDB 3.0, 2016-12-01 and TCGA fusion Portal 2015-12-01) |
| Database | Src | Cancer type | Sample | Fusion gene | ORF | 5'-gene BP | 3'-gene BP |
| Top |
| TissGeneNet for KLC3 |
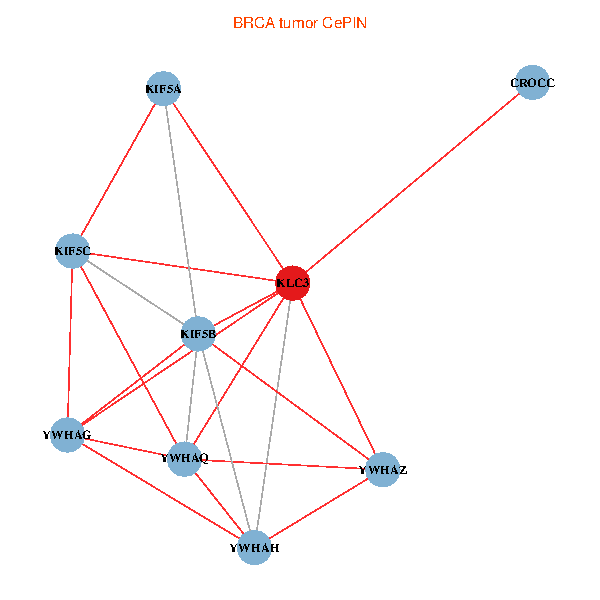
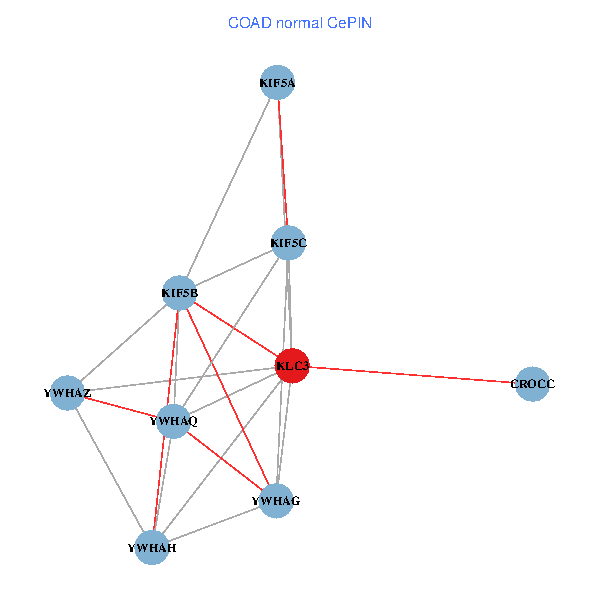
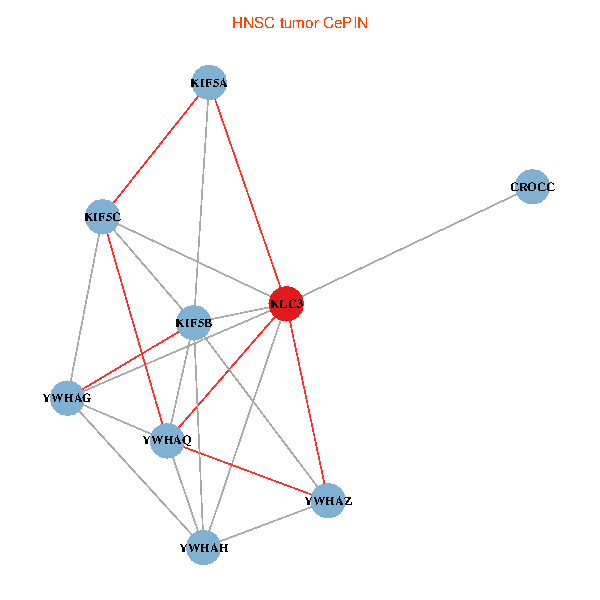
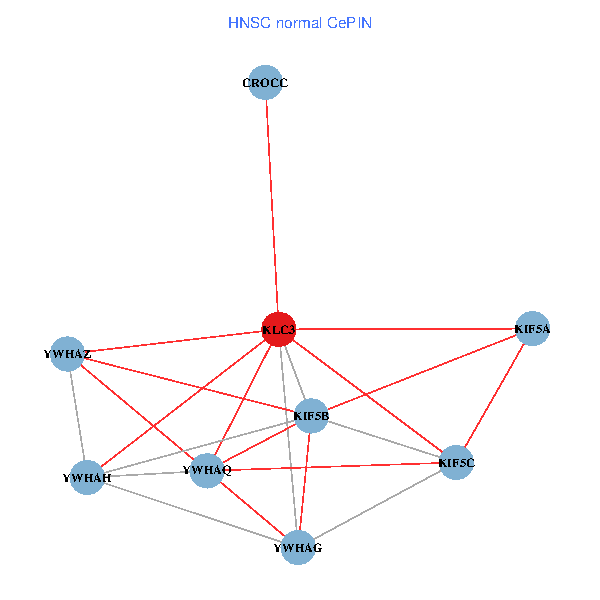
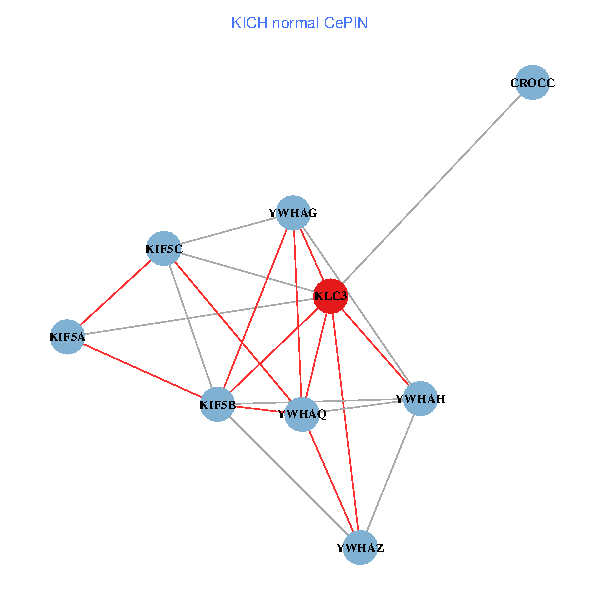
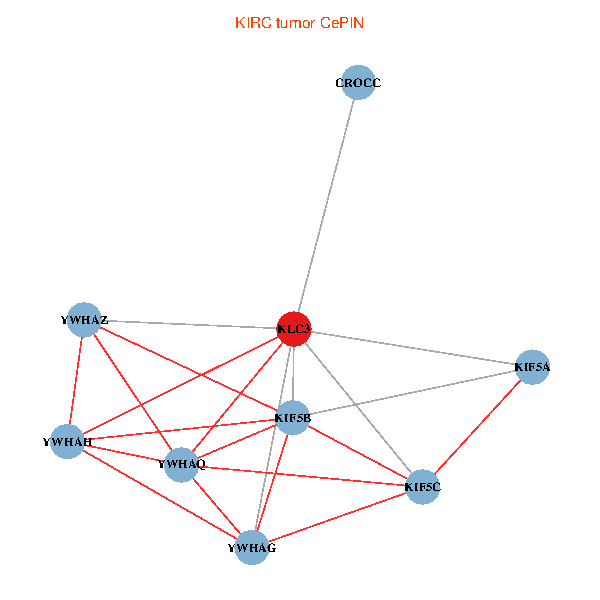
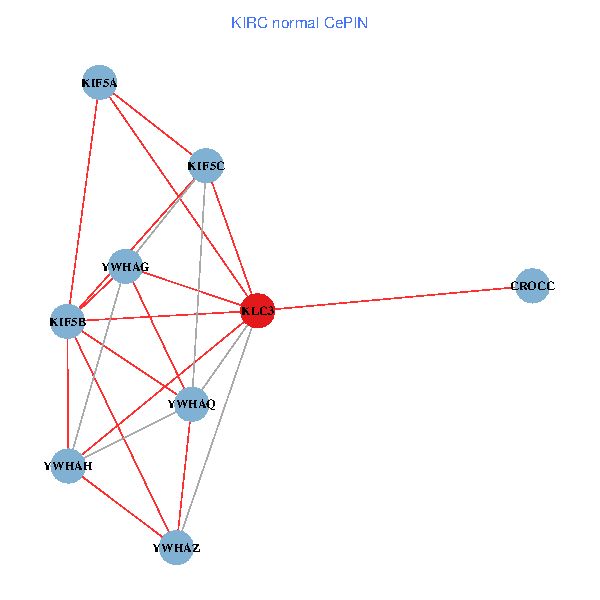
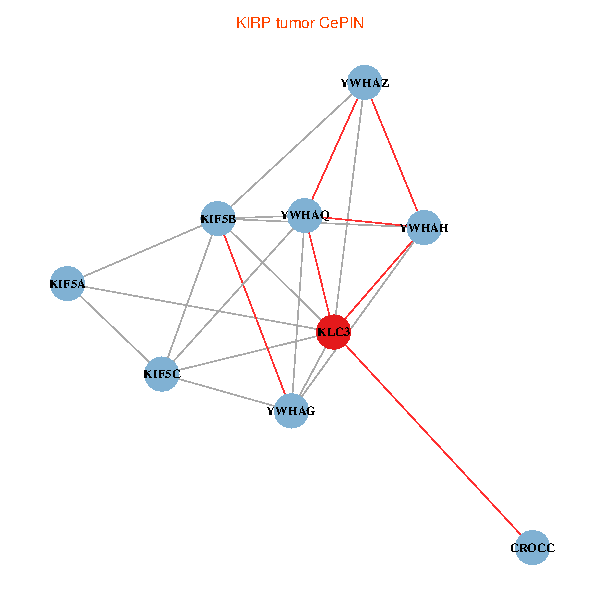
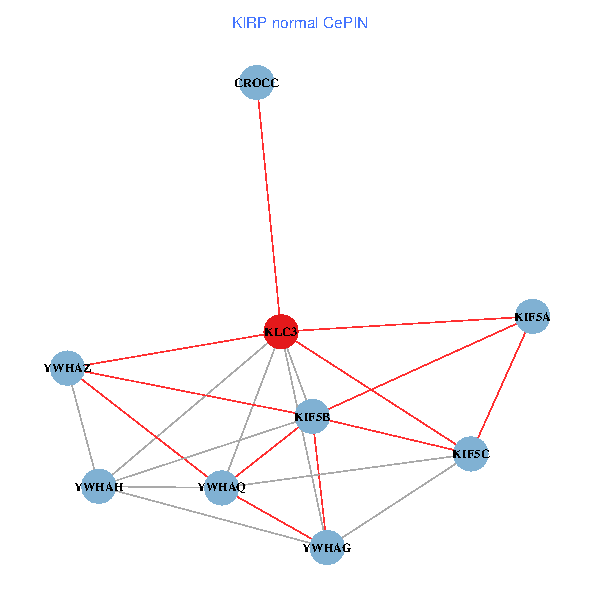
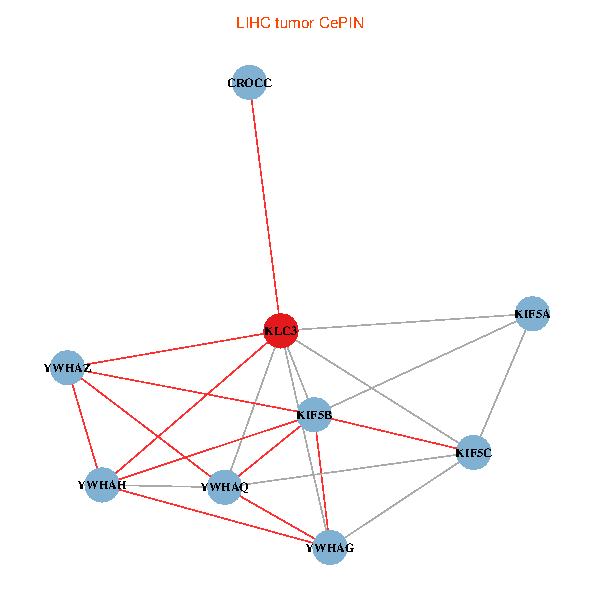
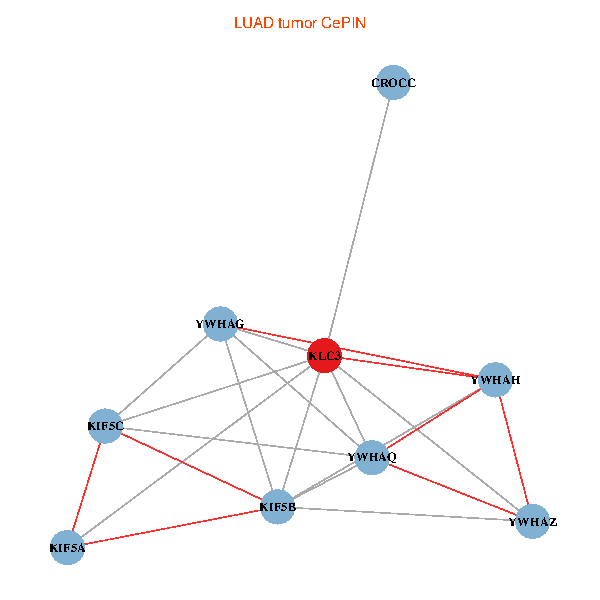
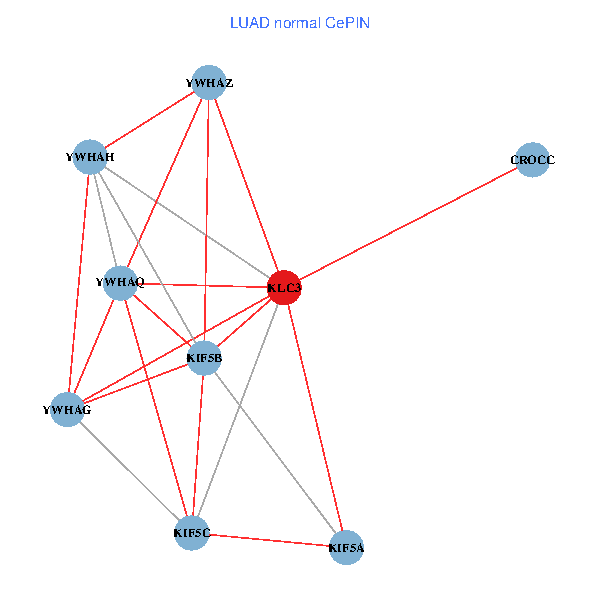
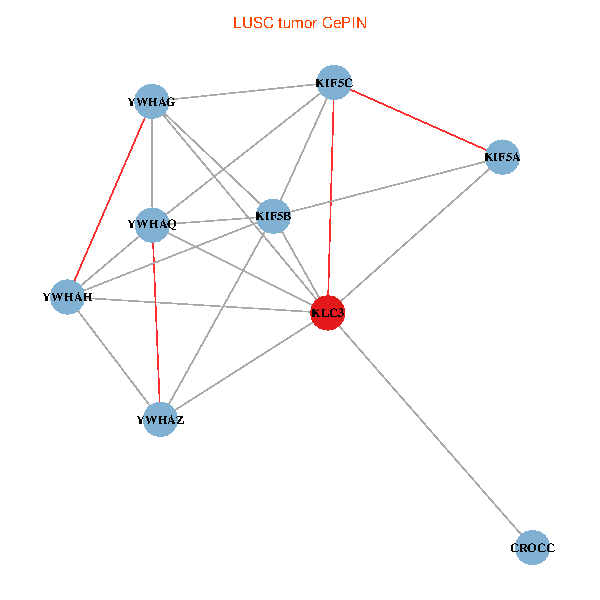
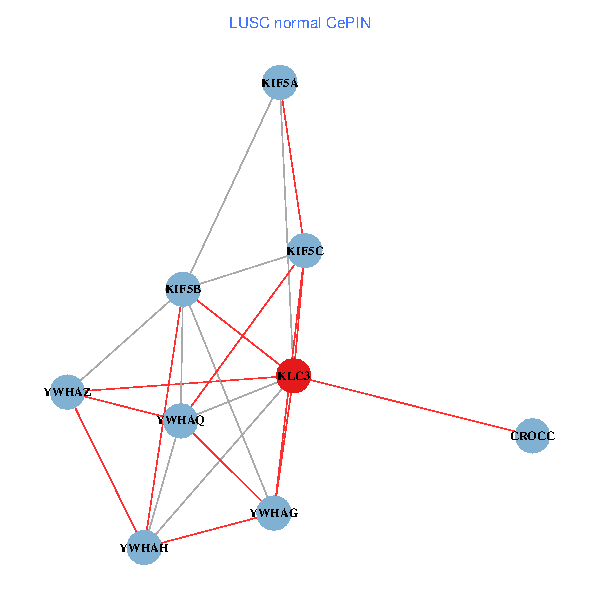
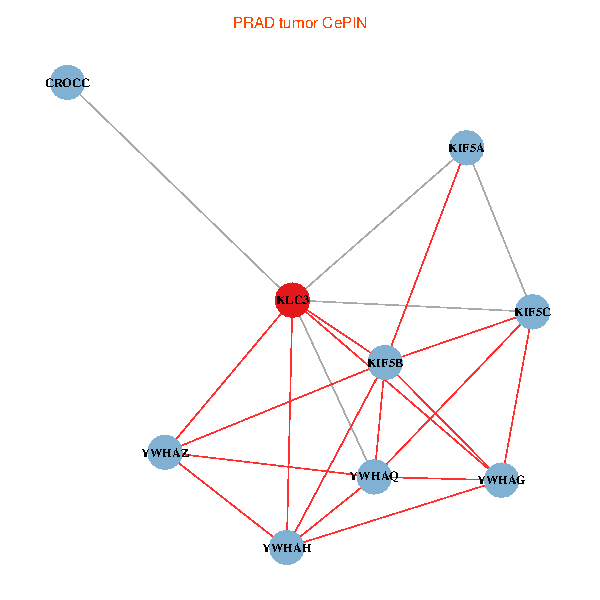
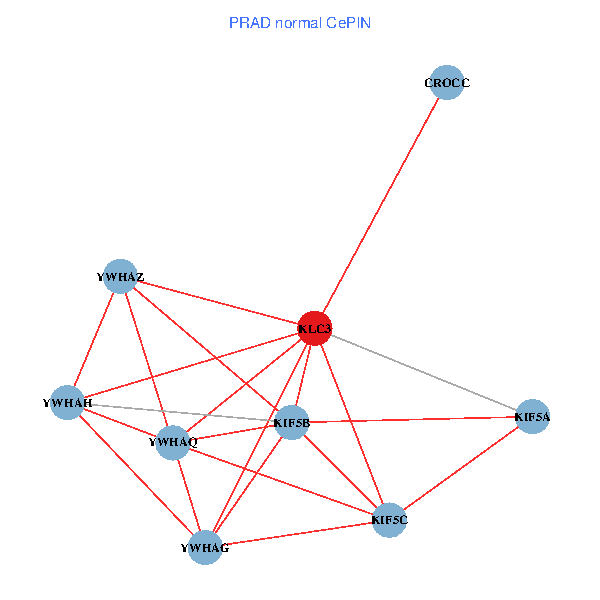
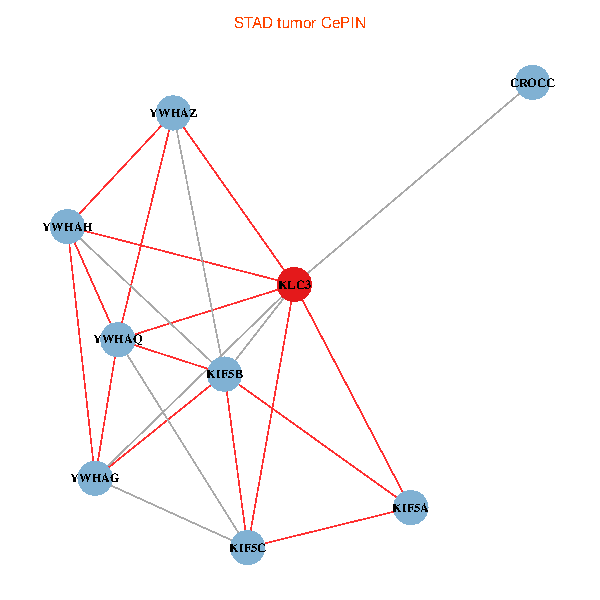
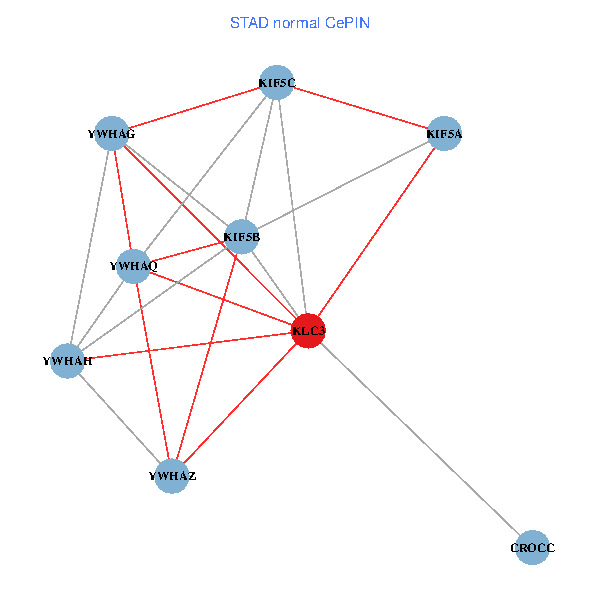
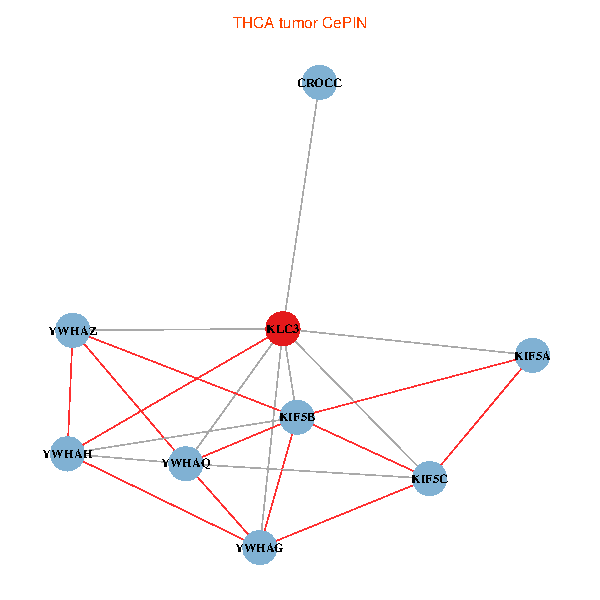
| Co-expressed gene networks based on protein-protein interaction data (CePIN) (TCGA IlluminaHiSeq_RNASeqV2, pan-cancer normalized log2(norm_counts+1) data, version 2016-08-16) (PINA2 ppi data) |
| BRCA (tumor) | BRCA (normal) |
| KLC3, KIF5A, YWHAZ, KIF5B, YWHAG, YWHAQ, YWHAH, KIF5C, CROCC (tumor) | KLC3, KIF5A, YWHAZ, KIF5B, YWHAG, YWHAQ, YWHAH, KIF5C, CROCC (normal) |
 |  |
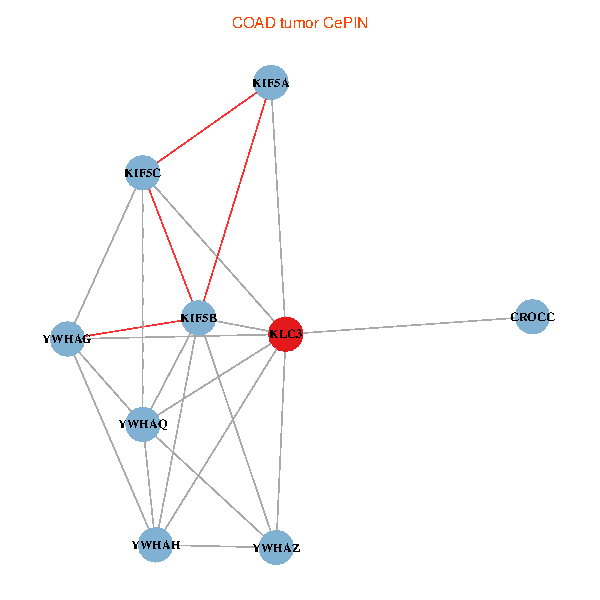
| COAD (tumor) | COAD (normal) |
| KLC3, KIF5A, YWHAZ, KIF5B, YWHAG, YWHAQ, YWHAH, KIF5C, CROCC (tumor) | KLC3, KIF5A, YWHAZ, KIF5B, YWHAG, YWHAQ, YWHAH, KIF5C, CROCC (normal) |
 |  |
| HNSC (tumor) | HNSC (normal) |
| KLC3, KIF5A, YWHAZ, KIF5B, YWHAG, YWHAQ, YWHAH, KIF5C, CROCC (tumor) | KLC3, KIF5A, YWHAZ, KIF5B, YWHAG, YWHAQ, YWHAH, KIF5C, CROCC (normal) |
 |  |
| KICH (tumor) | KICH (normal) |
| KLC3, KIF5A, YWHAZ, KIF5B, YWHAG, YWHAQ, YWHAH, KIF5C, CROCC (tumor) | KLC3, KIF5A, YWHAZ, KIF5B, YWHAG, YWHAQ, YWHAH, KIF5C, CROCC (normal) |
 |  |
| KIRC (tumor) | KIRC (normal) |
| KLC3, KIF5A, YWHAZ, KIF5B, YWHAG, YWHAQ, YWHAH, KIF5C, CROCC (tumor) | KLC3, KIF5A, YWHAZ, KIF5B, YWHAG, YWHAQ, YWHAH, KIF5C, CROCC (normal) |
 |  |
| KIRP (tumor) | KIRP (normal) |
| KLC3, KIF5A, YWHAZ, KIF5B, YWHAG, YWHAQ, YWHAH, KIF5C, CROCC (tumor) | KLC3, KIF5A, YWHAZ, KIF5B, YWHAG, YWHAQ, YWHAH, KIF5C, CROCC (normal) |
 |  |
| LIHC (tumor) | LIHC (normal) |
| KLC3, KIF5A, YWHAZ, KIF5B, YWHAG, YWHAQ, YWHAH, KIF5C, CROCC (tumor) | KLC3, KIF5A, YWHAZ, KIF5B, YWHAG, YWHAQ, YWHAH, KIF5C, CROCC (normal) |
 |  |
| LUAD (tumor) | LUAD (normal) |
| KLC3, KIF5A, YWHAZ, KIF5B, YWHAG, YWHAQ, YWHAH, KIF5C, CROCC (tumor) | KLC3, KIF5A, YWHAZ, KIF5B, YWHAG, YWHAQ, YWHAH, KIF5C, CROCC (normal) |
 |  |
| LUSC (tumor) | LUSC (normal) |
| KLC3, KIF5A, YWHAZ, KIF5B, YWHAG, YWHAQ, YWHAH, KIF5C, CROCC (tumor) | KLC3, KIF5A, YWHAZ, KIF5B, YWHAG, YWHAQ, YWHAH, KIF5C, CROCC (normal) |
 |  |
| PRAD (tumor) | PRAD (normal) |
| KLC3, KIF5A, YWHAZ, KIF5B, YWHAG, YWHAQ, YWHAH, KIF5C, CROCC (tumor) | KLC3, KIF5A, YWHAZ, KIF5B, YWHAG, YWHAQ, YWHAH, KIF5C, CROCC (normal) |
 |  |
| STAD (tumor) | STAD (normal) |
| KLC3, KIF5A, YWHAZ, KIF5B, YWHAG, YWHAQ, YWHAH, KIF5C, CROCC (tumor) | KLC3, KIF5A, YWHAZ, KIF5B, YWHAG, YWHAQ, YWHAH, KIF5C, CROCC (normal) |
 |  |
| THCA (tumor) | THCA (normal) |
| KLC3, KIF5A, YWHAZ, KIF5B, YWHAG, YWHAQ, YWHAH, KIF5C, CROCC (tumor) | KLC3, KIF5A, YWHAZ, KIF5B, YWHAG, YWHAQ, YWHAH, KIF5C, CROCC (normal) |
 |  |
| Top |
| TissGeneProg for KLC3 |
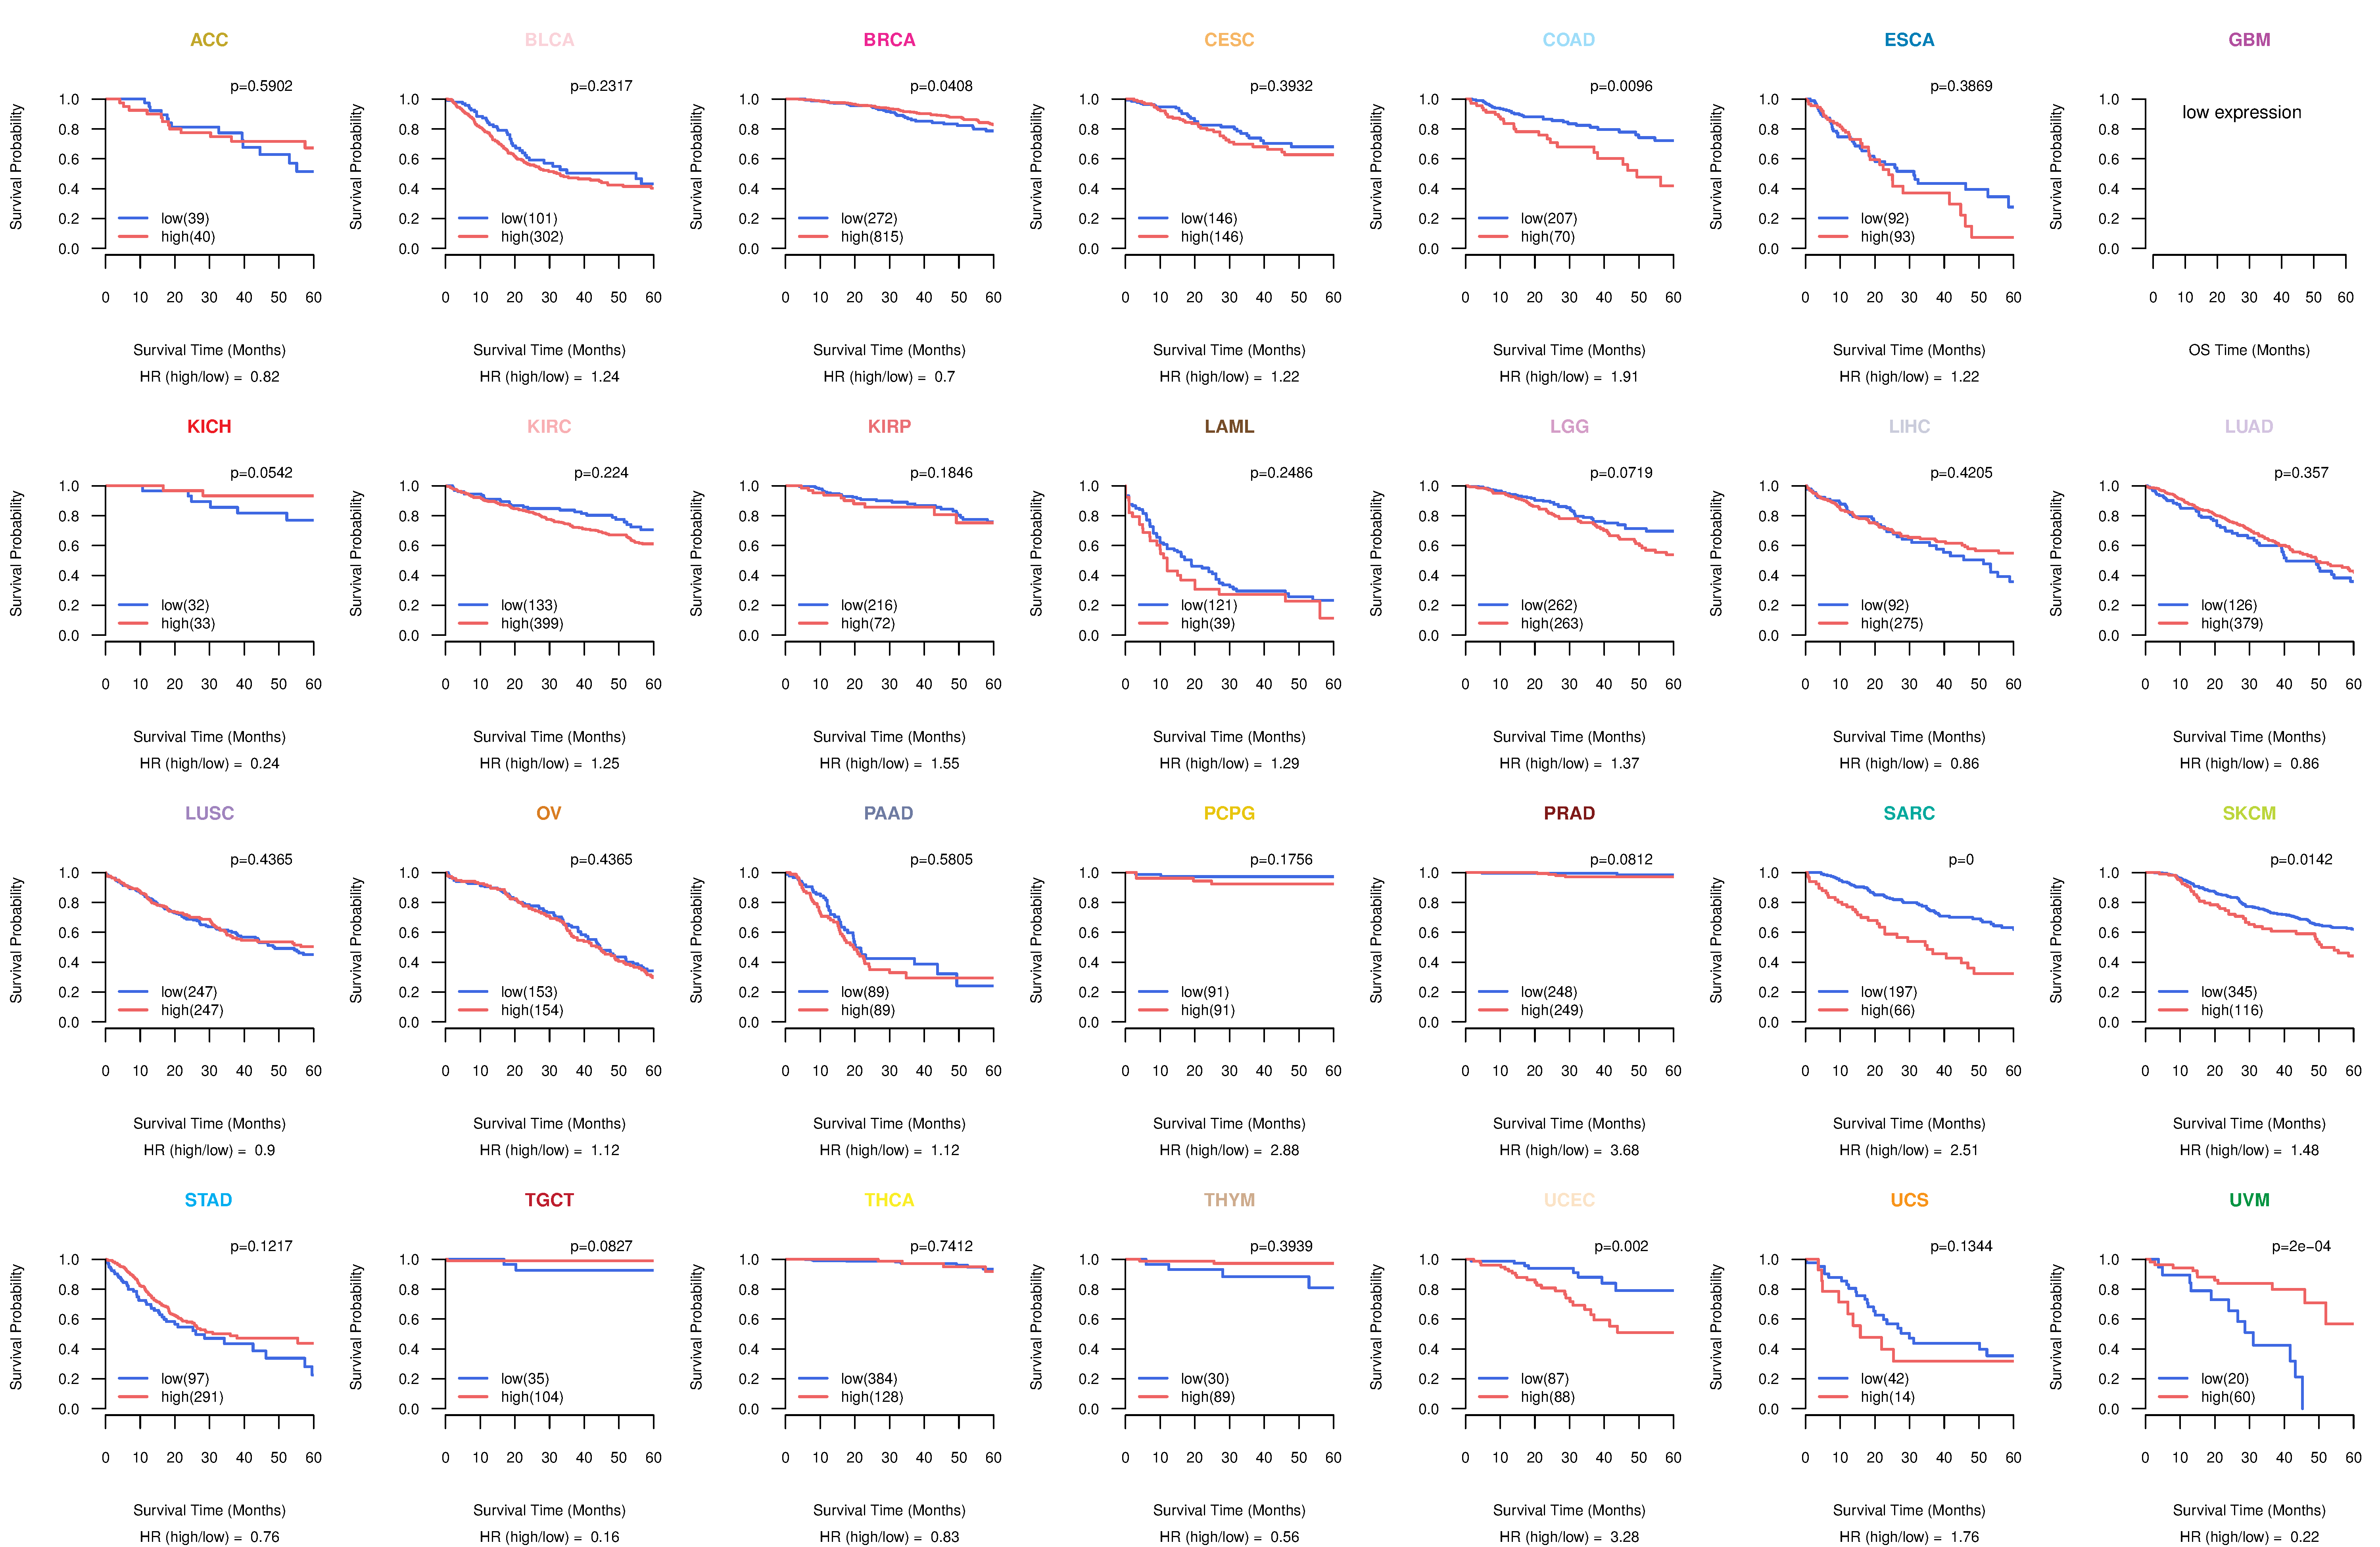
| Kaplan-Meier plots with logrank tests of overall survival (OS) using 28 cancer types (TCGA IlluminaHiSeq_RNASeqV2, pan-cancer normalized log2(norm_counts+1) data, version 2016-08-16) (TCGA clinicalMatrix, phenotype data, version 2016-04-27) * Click on the image to enlarge it in a new window. |
 |
| Kaplan-Meier plots with logrank test of relapse free survival (RFS) using 28 cancer types (TCGA IlluminaHiSeq_RNASeqV2, pan-cancer normalized log2(norm_counts+1) data, version 2016-08-16) (TCGA clinicalMatrix, phenotype data, version 2016-04-27) * Click on the image enlarge it in a new window. |
 |
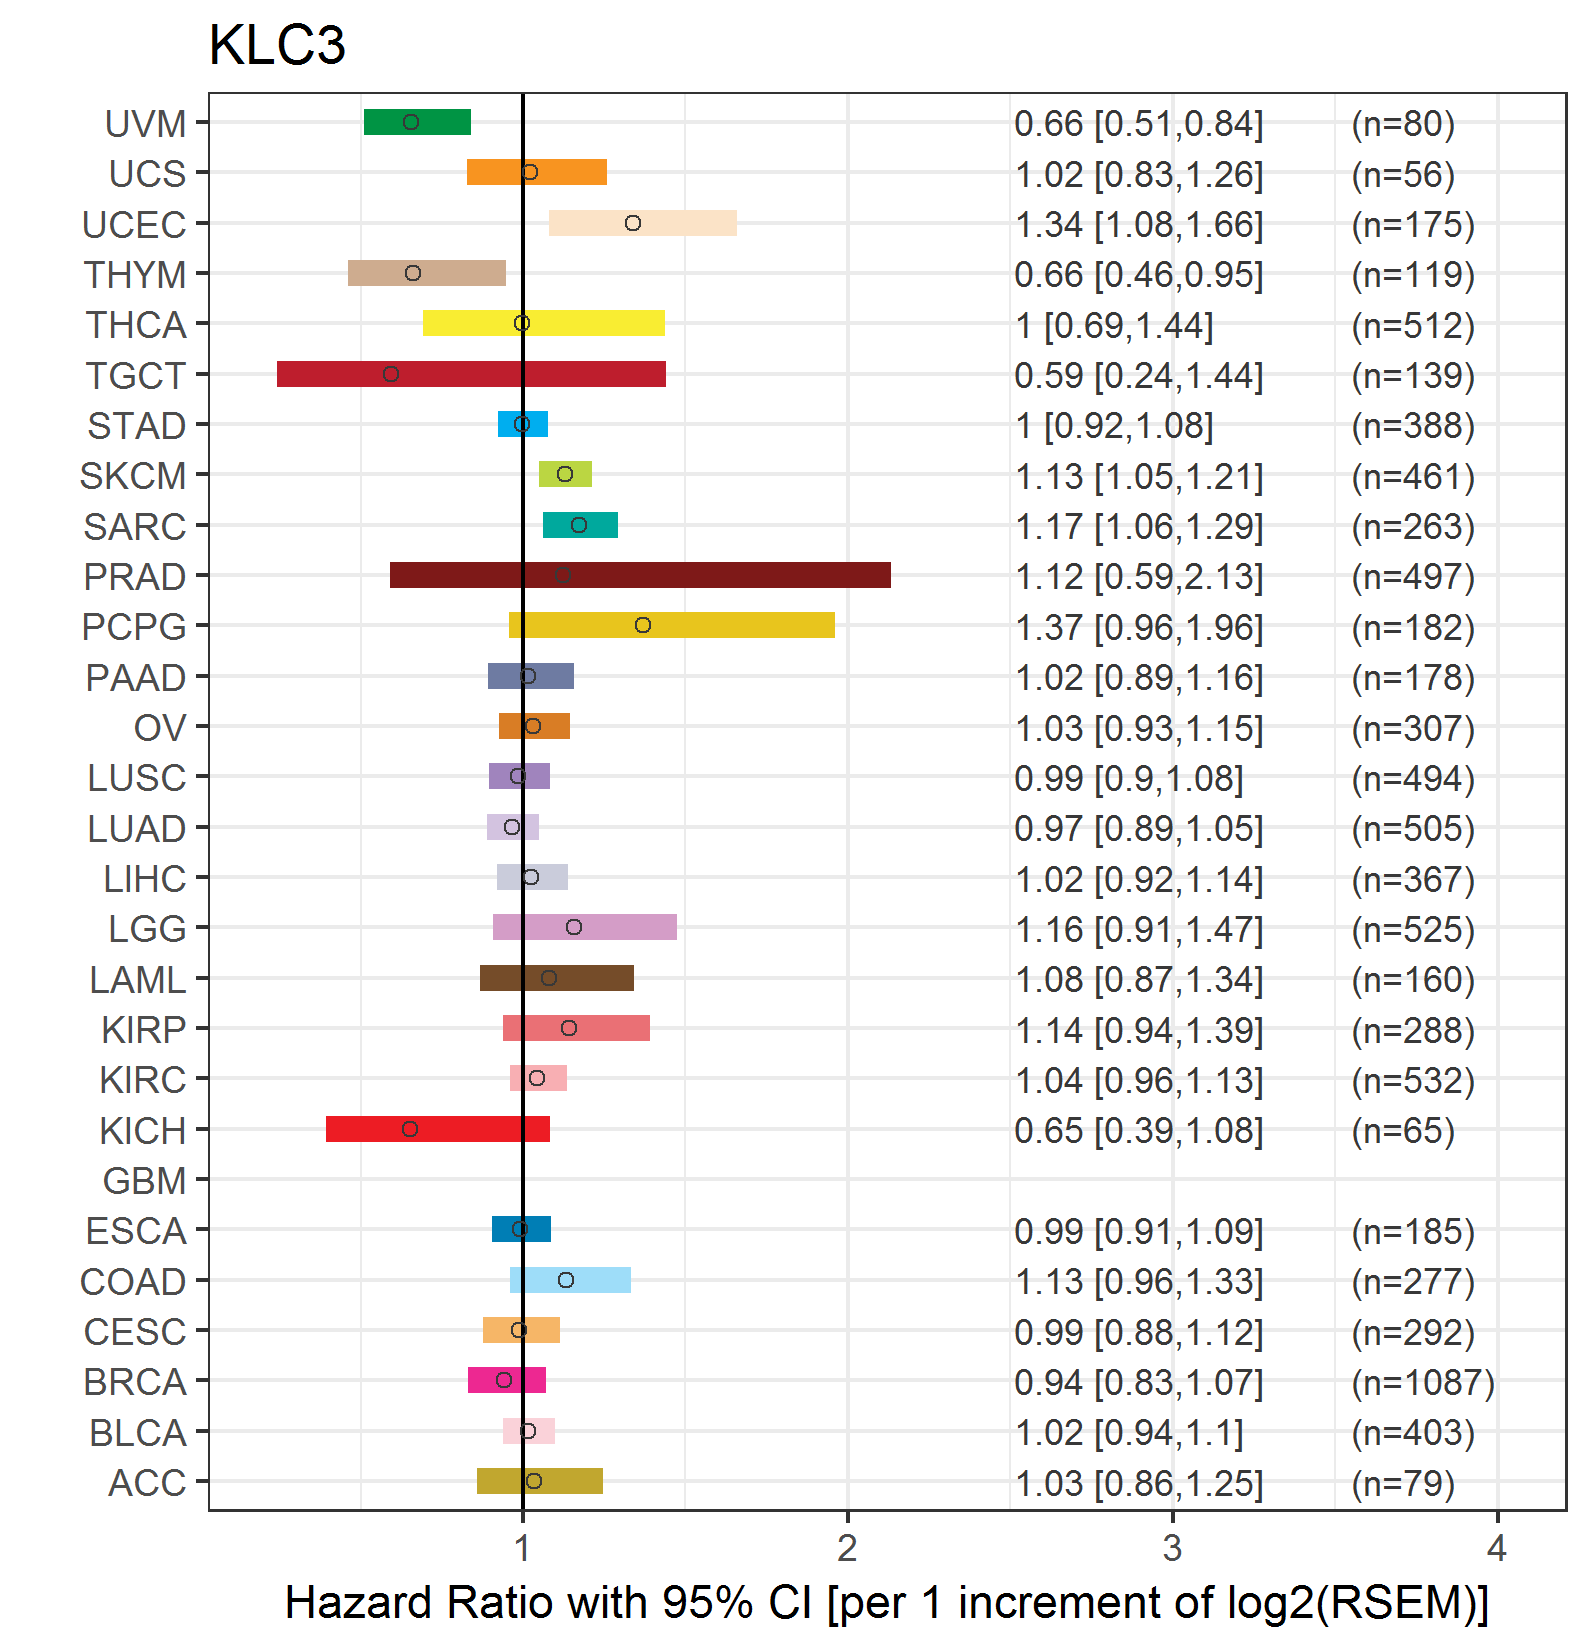
| Forest plot of Cox proportional hazard ratio (HR) and 95% CI of overall survival (OS) using 28 cancer types (TCGA IlluminaHiSeq_RNASeqV2, pan-cancer normalized log2(norm_counts+1) data, version 2016-08-16) (TCGA clinicalMatrix, phenotype data, version 2016-04-27) * Click on the image enlarge it in a new window. |
 |
| Forest plot of Cox proportional hazard ratio (HR) and 95% CI of relapse free survival (RFS) using 28 cancer types (TCGA IlluminaHiSeq_RNASeqV2, pan-cancer normalized log2(norm_counts+1) data, version 2016-08-16) (TCGA clinicalMatrix, phenotype data, version 2016-04-27) * Click on the image enlarge it in a new window. |
 |
| Top |
| TissGeneClin for KLC3 |
| TissGeneDrug for KLC3 |
| Drug information targeting TissGene (DrugBank Version 5.0.6, 2017-04-01) |
| DrugBank ID | Drug name | Drug activity | Drug type | Drug status |
| Top |
| TissGeneDisease for KLC3 |
| Disease information associated with TissGene (DisGeNet, 2016-06-01) |
| Disease ID | Disease name | # pubmeds | Source |
| umls:C0007131 | Non-Small Cell Lung Carcinoma | 1 | BeFree |
| umls:C0242379 | Malignant neoplasm of lung | 1 | GWASCAT |
|
Copyright 2016-Present - The University of Texas Health Science Center at Houston (UTHealth) Web File Viewing | How to Report, Fraud, Waste and Abuse | State of Texas | Statewide Search | Texas Homeland Security | Site Policies |