 |
| |
| |
| |
| |
| |
| |
|

| TissGeneSummary for NEK10 |
 Gene summary Gene summary |
| Basic gene information | Gene symbol | NEK10 |
| Gene name | NIMA-related kinase 10 | |
| Synonyms | - | |
| Cytomap | UCSC genome browser: 3p24.1 | |
| Type of gene | protein-coding | |
| RefGenes | NM_001031741.2, NM_152534.3,NM_199347.2, | |
| Description | NIMA (never in mitosis gene a)- related kinase 10never in mitosis A-related kinase 10nimA-related protein kinase 10serine/threonine-protein kinase Nek10 | |
| Modification date | 20141207 | |
| dbXrefs | HGNC : HGNC | |
| Ensembl : ENSG00000163491 | ||
| HPRD : 08135 | ||
| Vega : OTTHUMG00000130571 | ||
| Protein | UniProt: go to UniProt's Cross Reference DB Table | |
| Expression | CleanEX: HS_NEK10 | |
| BioGPS: 152110 | ||
| Pathway | NCI Pathway Interaction Database: NEK10 | |
| KEGG: NEK10 | ||
| REACTOME: NEK10 | ||
| Pathway Commons: NEK10 | ||
| Context | iHOP: NEK10 | |
| ligand binding site mutation search in PubMed: NEK10 | ||
| UCL Cancer Institute: NEK10 | ||
| Assigned class in TissGDB* | C | |
| Included tissue-specific gene expression resources | ||
| Specific-tissues in normal samples (assigned by TissGDB using HPA, TiGER, and GTEx) | Testis | |
| Cancer types related to the specific-tissues in cancer samples (assigned by TissGDB using TCGA) | TGCT | |
| Reference showing the relevant tissue of NEK10 | ||
| Description by TissGene annotations | Cancer gene Have significant anti-correlated miRNA | |
| * Class A consists of genes with literature evidence and is part of the cTissGenes. Class B consists of only cTissGenes without additional evidence. The remaining genes belong to Class C. |
| Gene ontology having evidence of Inferred from Direct Assay (IDA) from Entrez |
| GO ID | GO term | PubMed ID | GO:0006468 | protein phosphorylation | 20956560 | GO:0031954 | positive regulation of protein autophosphorylation | 20956560 | GO:0006468 | protein phosphorylation | 20956560 | GO:0031954 | positive regulation of protein autophosphorylation | 20956560 |
| Top |
| TissGeneExp for NEK10 |
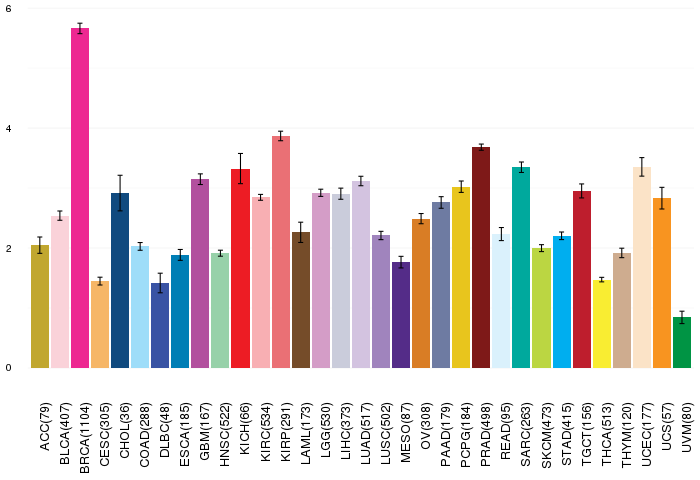
| Gene expressions across 28 cancer types (X-axis: cancer type and Y-axis: log2(norm_counts+1)) (TCGA IlluminaHiSeq_RNASeqV2, pan-cancer normalized log2(norm_counts+1) data, version 2016-08-16) |
 |
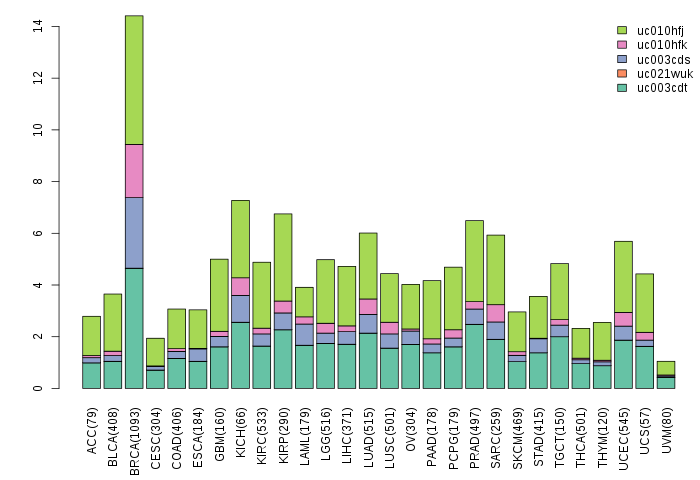
| Gene isoform expressions across 28 cancer types (X-axis: cancer type and Y-axis: log2(norm_counts+1)) (TCGA pan-cancer tcga_rsem_isoform_tpm, version 2016-09-01) |
 |
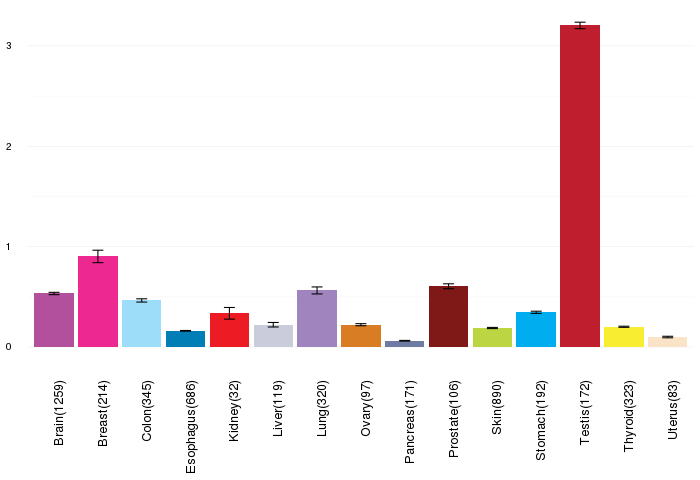
| Gene expressions across normal tissues of GTEx data (GTEx GTEx_Analysis_v6_RNA-seq_RNA-SeQCv1.1.8_gene_rpkm.gct) - Here, we shows the matched tissue types only among our 28 cancer types. |
 |
| Different expressions across 14 cancer types with more than 10 samples between matched tumors and normals (X-axis: cancer type and Y-axis: log2(norm_counts+1)) (TCGA IlluminaHiSeq_RNASeqV2, pan-cancer normalized log2(norm_counts+1) data, version 2016-08-16) |
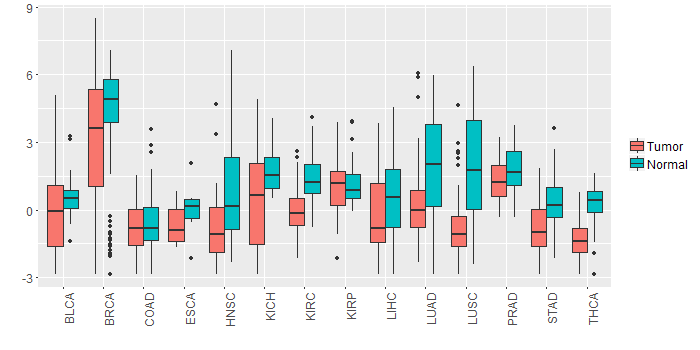 |
| - Significantly differentially expressed cancer types and information. (|Fold change|>1 and FDR<0.05) |
| Cancer type | Mean(exp) in tumor | Mean(exp) in matched normal | Log2FC | P-val. | FDR |
| THCA | -1.370790505 | 0.267194241 | -1.637984746 | 2.63E-18 | 6.69E-17 |
| KIRC | -0.013674639 | 1.372048972 | -1.385723611 | 8.12E-14 | 3.76E-13 |
| LUSC | -0.6458699 | 1.907286962 | -2.553156863 | 8.84E-09 | 2.81E-08 |
| KICH | 0.518824139 | 1.725908139 | -1.207084 | 0.0123 | 0.02168736 |
| BRCA | 3.125731648 | 4.226201823 | -1.100470175 | 0.0018 | 0.003418029 |
| HNSC | -0.697927675 | 0.878402558 | -1.576330233 | 0.000308 | 0.001207317 |
| STAD | -0.893893736 | 0.419940639 | -1.313834375 | 7.07E-05 | 0.000578197 |
| LUAD | 0.295264346 | 1.797550553 | -1.502286207 | 0.000211 | 0.000505094 |
| Top |
| TissGene-miRNA for NEK10 |
| Significantly anti-correlated miRNAs of TissGene across 28 cancer types (Gene-miRNA relations from TargetScanHuman Relsease 7.1, Conserved_Site_Context_Scores.txt.zip, 06.01.2016) (TCGA IlluminaHiSeq_miRNASeq, log2(RPM+1) data, version 2016-11-21) (TCGA IlluminaHiSeq_RNASeqV2, log2(normalized_count+1) data, version 2016-08-16) (Spearman’s Rank Correlation (p-value<0.05 and coefficient<-0.25)) |
| Cancer type | miRNA id | miRNA accession | P-val. | Coeff. | # samples |
| ACC | hsa-miR-15a-5p | MIMAT0000068 | 0.022 | -0.26 | 78 |
| ACC | hsa-miR-15a-5p | MIMAT0000068 | 0.022 | -0.26 | 78 |
| ESCA | hsa-miR-93-5p | MIMAT0000093 | 0.0053 | -0.26 | 192 |
| ESCA | hsa-miR-93-5p | MIMAT0000093 | 0.0053 | -0.26 | 192 |
| ESCA | hsa-miR-93-5p | MIMAT0000093 | 0.0053 | -0.26 | 192 |
| THYM | hsa-miR-373-3p | MIMAT0000726 | 0.024 | -0.27 | 122 |
| LUAD | hsa-miR-503-5p | MIMAT0002874 | 0.022 | -0.3 | 60 |
| ACC | hsa-miR-200b-3p | MIMAT0000318 | 0.0084 | -0.33 | 78 |
| ACC | hsa-miR-26a-5p | MIMAT0000082 | 0.0034 | -0.33 | 78 |
| ACC | hsa-miR-200b-3p | MIMAT0000318 | 0.0084 | -0.33 | 78 |
| ACC | hsa-miR-26a-5p | MIMAT0000082 | 0.0034 | -0.33 | 78 |
| LUAD | hsa-miR-19a-3p | MIMAT0000073 | 0.012 | -0.33 | 60 |
| Top |
| TissGeneMut for NEK10 |
| TissGeneSNV for NEK10 |
| nsSNV counts per each loci. Different colors of circles represent different cancer types. Circle size denotes number of samples. (TCGA somatic mutation (SNPs and small INDELs) data, version 2016-04-25) * Click on the image to enlarge it in a new window. |
 |
 |
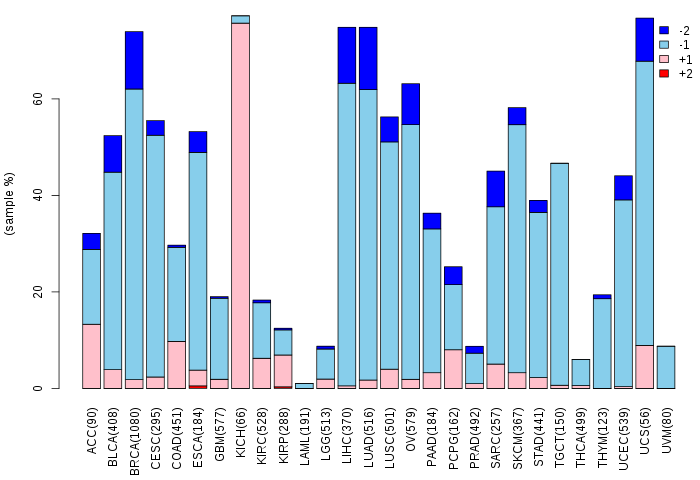
| Somatic nucleotide variants of TissGene across 28 cancer types (X-axis: cancer type and Y-axis: % of mutated samples) The numbers in parentheses are numbers of samples with mutation (nsSNVs). (TCGA somatic mutation (SNPs and small INDELs) data, version 2016-04-25) |
 |
| - nsSNVs sorted by frequency. |
| AAchange | Cancer type | # samples |
| p.R103H | UCEC | 2 |
| p.E882K | UCEC | 2 |
| p.D145A | UCEC | 1 |
| p.W1163* | SKCM | 1 |
| p.P281L | SKCM | 1 |
| p.N346H | COAD | 1 |
| p.E699K | UCEC | 1 |
| p.H1168Y | LIHC | 1 |
| p.D477N | BLCA | 1 |
| p.G526* | LUAD | 1 |
| p.E621X | PAAD | 1 |
| p.I119K | PAAD | 1 |
| p.S917* | BLCA | 1 |
| p.C532S | THCA | 1 |
| p.T687A | LUAD | 1 |
| p.R275C | PAAD | 1 |
| p.V712A | ACC | 1 |
| p.E207K | STAD | 1 |
| p.Y290H | UCEC | 1 |
| p.Q318H | STAD | 1 |
| p.E895G | HNSC | 1 |
| p.R1107C | BLCA | 1 |
| p.S688F | UCEC | 1 |
| p.S230R | UCEC | 1 |
| p.S1015* | BLCA | 1 |
| p.N999Y | HNSC | 1 |
| p.S795C | BLCA | 1 |
| p.Q336* | STAD | 1 |
| p.H835Y | BLCA | 1 |
| p.S1067F | UCEC | 1 |
| p.V671I | PAAD | 1 |
| p.R821Q | UCEC | 1 |
| p.R33W | SKCM | 1 |
| p.A723V | STAD | 1 |
| p.W299L | LUAD | 1 |
| p.D1002Y | UCEC | 1 |
| p.R643X | SKCM | 1 |
| p.Q193X | LGG | 1 |
| p.I693N | KIRP | 1 |
| p.D477A | LUAD | 1 |
| p.E207G | HNSC | 1 |
| p.K21T | HNSC | 1 |
| p.A480G | BRCA | 1 |
| p.H1103N | BLCA | 1 |
| p.S991I | LUAD | 1 |
| p.S909L | UCEC | 1 |
| p.S540R | LUAD | 1 |
| p.R998* | BRCA | 1 |
| p.S618Y | BLCA | 1 |
| p.R807Q | UCEC | 1 |
| p.N1117D | LIHC | 1 |
| p.D23Y | STAD | 1 |
| p.Q19H | BRCA | 1 |
| p.W987L | LUAD | 1 |
| p.Q33K | LUAD | 1 |
| p.D51N | THYM | 1 |
| p.G867D | SKCM | 1 |
| p.R998Q | SKCM | 1 |
| p.S952L | BLCA | 1 |
| p.Y591F | LUAD | 1 |
| p.I693L | STAD | 1 |
| p.K633E | BLCA | 1 |
| p.R1058I | STAD | 1 |
| p.A35T | LUSC | 1 |
| p.L612P | STAD | 1 |
| p.Q721K | LUAD | 1 |
| p.R1107C | SKCM | 1 |
| p.S107C | BLCA | 1 |
| p.L308I | COAD | 1 |
| p.A63T | COAD | 1 |
| p.R119Q | UCEC | 1 |
| p.N1117I | LUAD | 1 |
| p.D962N | LUAD | 1 |
| p.T947I | LGG | 1 |
| p.H584Q | LUSC | 1 |
| p.F409L | STAD | 1 |
| p.G1017E | SKCM | 1 |
| p.V136I | GBM | 1 |
| p.K709T | HNSC | 1 |
| p.K685N | CESC | 1 |
| p.K427N | UCEC | 1 |
| p.F50L | OV | 1 |
| p.P461S | SKCM | 1 |
| p.G526E | SKCM | 1 |
| p.R123C | KICH | 1 |
| p.S109C | HNSC | 1 |
| p.I661V | BLCA | 1 |
| p.D274N | LUAD | 1 |
| p.N479S | LUAD | 1 |
| p.D209Y | LUAD | 1 |
| p.S372* | CESC | 1 |
| p.R643* | SKCM | 1 |
| p.N1112K | LUAD | 1 |
| p.Q336X | STAD | 1 |
| p.D303N | BLCA | 1 |
| p.N1167S | LUAD | 1 |
| p.E621* | PAAD | 1 |
| p.A328T | STAD | 1 |
| p.E501V | LUSC | 1 |
| p.E901D | UCEC | 1 |
| p.R31I | COAD | 1 |
| p.E771K | SKCM | 1 |
| p.N659K | TGCT | 1 |
| p.E253Q | HNSC | 1 |
| p.I293M | COAD | 1 |
| p.Y534H | STAD | 1 |
| p.L801F | SKCM | 1 |
| p.L31F | LUAD | 1 |
| p.N311Y | HNSC | 1 |
| p.S208I | COAD | 1 |
| p.Q282L | LIHC | 1 |
| p.D910N | SKCM | 1 |
| p.L455V | ESCA | 1 |
| p.R365Q | UCS | 1 |
| p.L884M | UCEC | 1 |
| p.Q1027H | UCEC | 1 |
| p.A879T | LUAD | 1 |
| p.S618Y | THCA | 1 |
| p.D200Y | ESCA | 1 |
| p.P1092Q | STAD | 1 |
| p.Q367H | UCEC | 1 |
| p.H480Y | STAD | 1 |
| p.S229F | SKCM | 1 |
| p.E882K | SARC | 1 |
| p.P705S | SKCM | 1 |
| p.H584Y | SKCM | 1 |
| p.E379Q | OV | 1 |
| p.E682G | PAAD | 1 |
| p.E621K | SKCM | 1 |
| p.F385L | UCEC | 1 |
| p.E118A | GBM | 1 |
| p.N90S | UCEC | 1 |
| p.S696F | BLCA | 1 |
| p.R811G | BRCA | 1 |
| p.Q193* | LGG | 1 |
| p.D272Y | OV | 1 |
| p.V568I | OV | 1 |
| p.Q721H | LUAD | 1 |
| p.R275C | ACC | 1 |
| p.E876K | UCEC | 1 |
| p.Q39* | SKCM | 1 |
| p.V671I | STAD | 1 |
| p.E94X | ESCA | 1 |
| p.S496Y | OV | 1 |
| p.G292E | SKCM | 1 |
| p.Q869L | LIHC | 1 |
| p.S797C | HNSC | 1 |
| p.I1126T | HNSC | 1 |
| p.Y1151* | TGCT | 1 |
| p.R930I | UCEC | 1 |
| p.Y172H | HNSC | 1 |
| p.L719F | LUAD | 1 |
| p.P1050S | SKCM | 1 |
| p.L455P | LIHC | 1 |
| Top |
| TissGeneCNV for NEK10 |
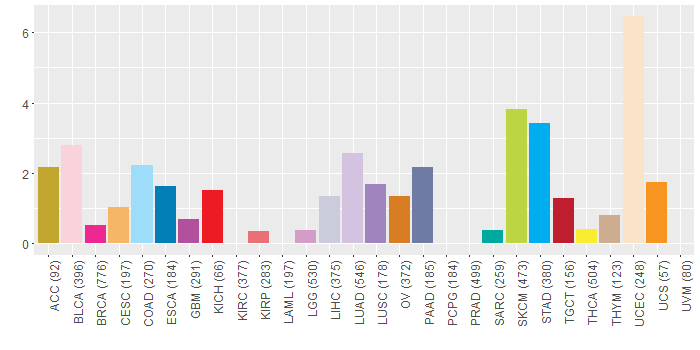
| Copy number variations of TissGene across 28 cancer types (X-axis: cancer type and Y-axis: % of CNV samples) (TCGA Gistic2_CopyNumber_Gistic2_all_data_by_genes, Gistic2 copy number data, version 2016-08-16) |
 |
| Top |
| TissGeneFusions for NEK10 |
| Fusion genes including TissGene (ChimerDB 3.0, 2016-12-01 and TCGA fusion Portal 2015-12-01) |
| Database | Src | Cancer type | Sample | Fusion gene | ORF | 5'-gene BP | 3'-gene BP |
| Chimerdb3.0 | ChiTaRs | NA | AF142421 | NEK10-QKI | chr3:27262344 | chr6:163836232 | |
| Chimerdb3.0 | ChiTaRs | NA | DA119783 | NEK10-DCUN1D4 | chr3:27410852 | chr4:52726708 |
| Top |
| TissGeneNet for NEK10 |
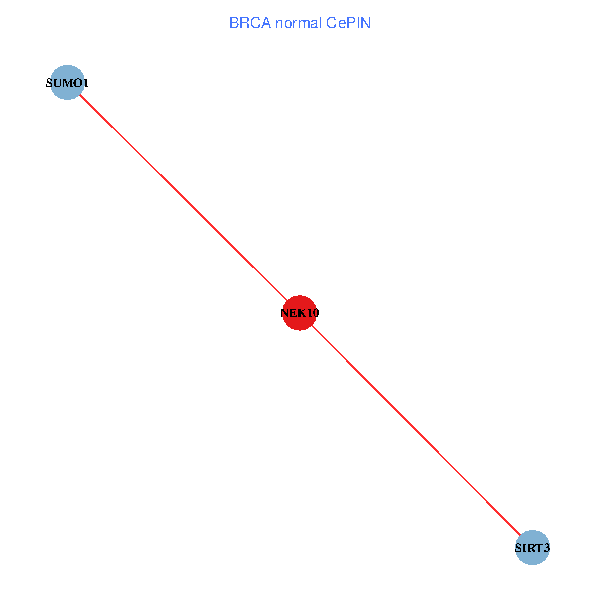
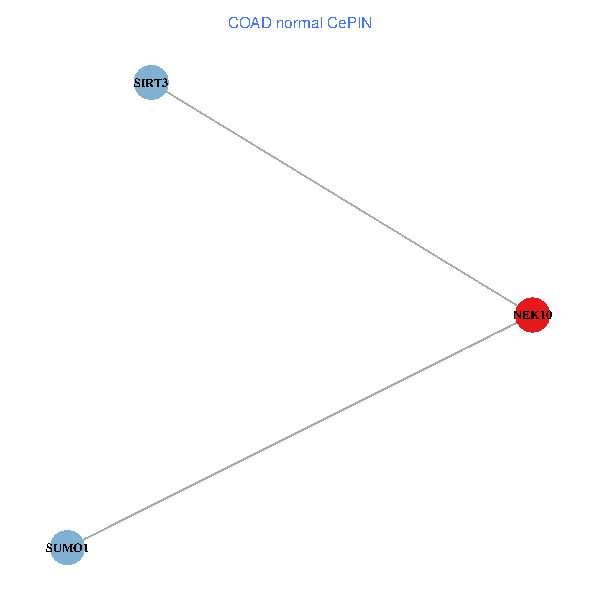
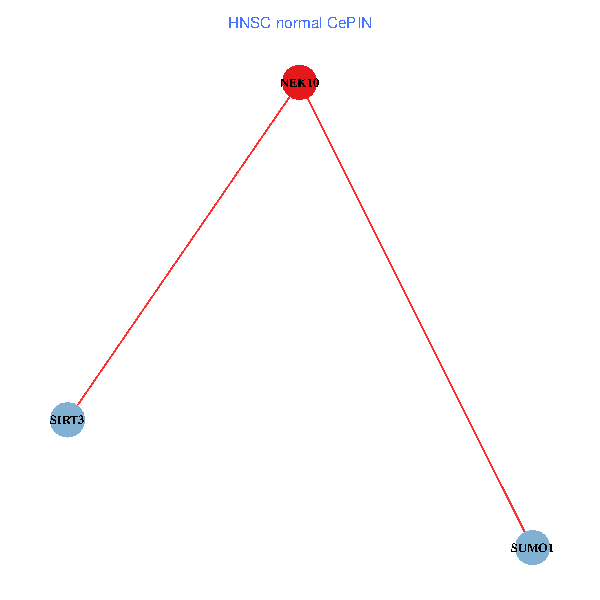
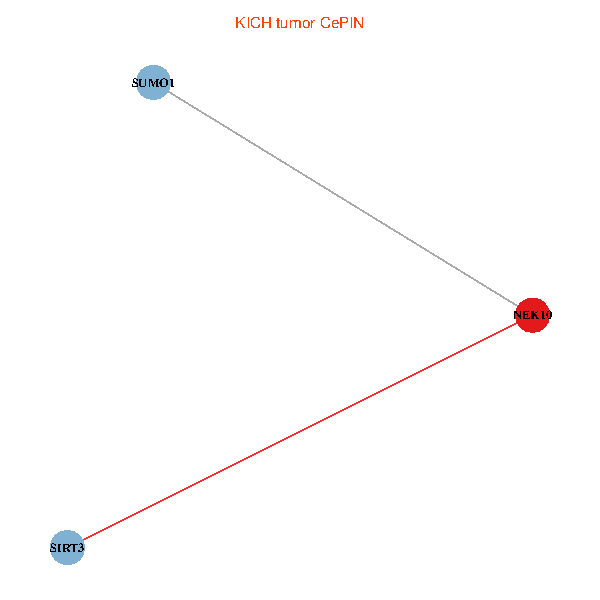
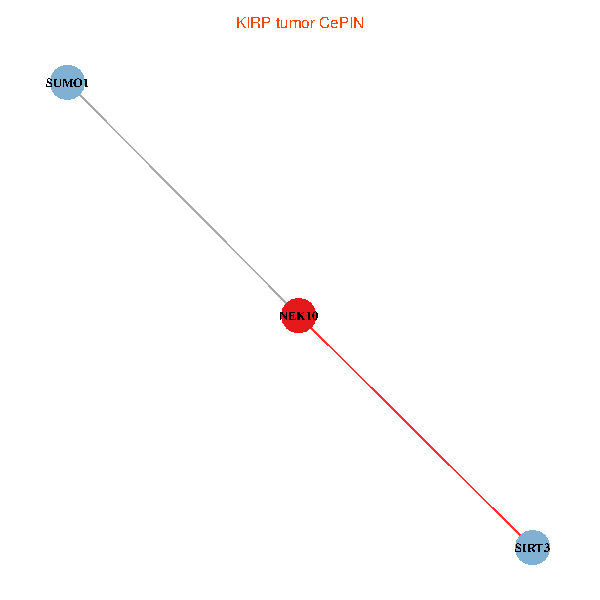
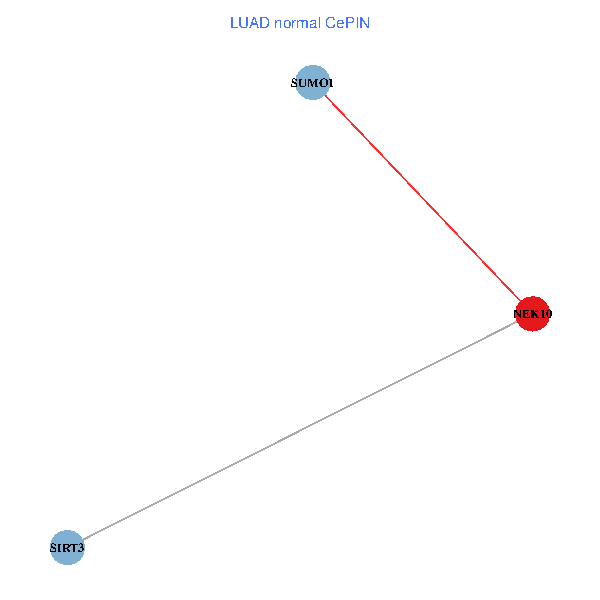
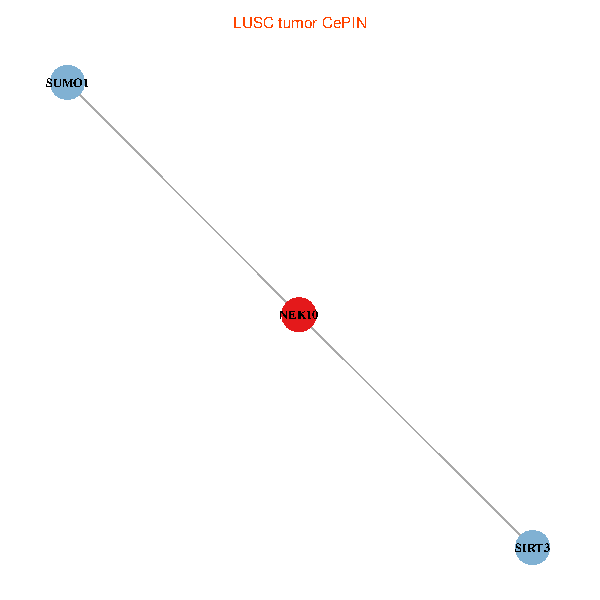
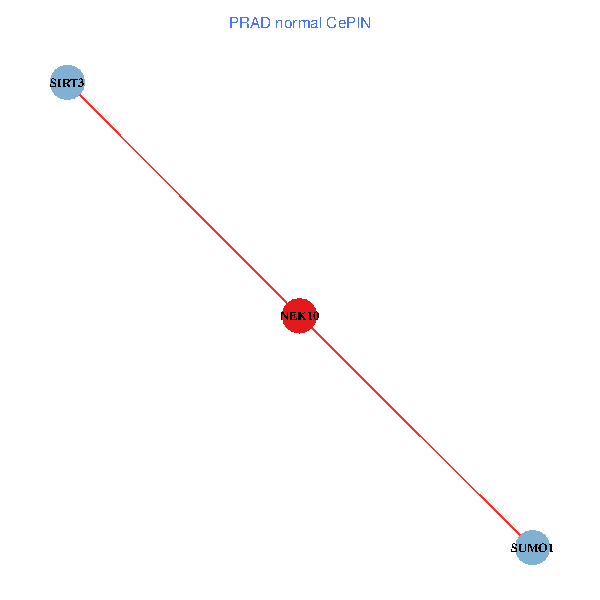
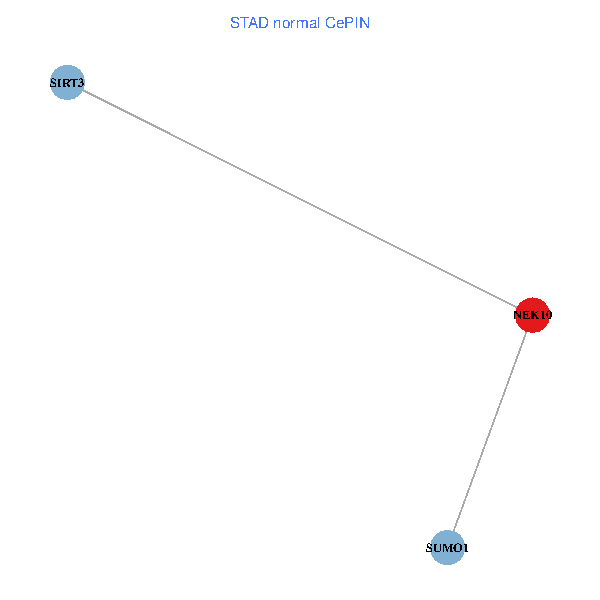
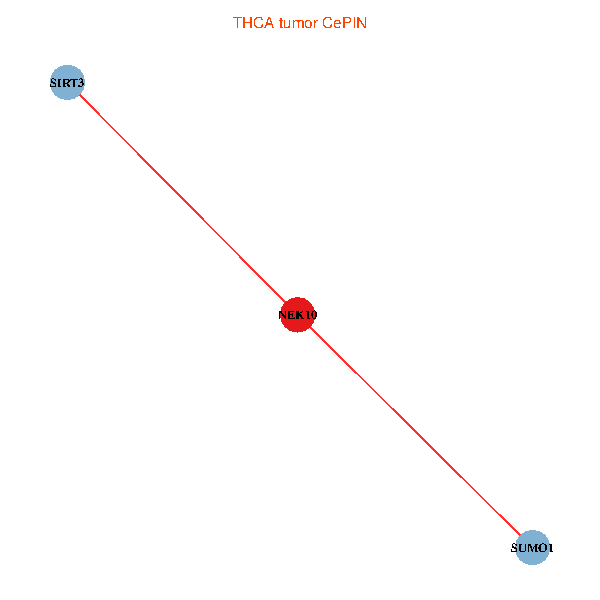
| Co-expressed gene networks based on protein-protein interaction data (CePIN) (TCGA IlluminaHiSeq_RNASeqV2, pan-cancer normalized log2(norm_counts+1) data, version 2016-08-16) (PINA2 ppi data) |
| BRCA (tumor) | BRCA (normal) |
| NEK10, SIRT3, SUMO1 (tumor) | NEK10, SIRT3, SUMO1 (normal) |
 |  |
| COAD (tumor) | COAD (normal) |
| NEK10, SIRT3, SUMO1 (tumor) | NEK10, SIRT3, SUMO1 (normal) |
 |  |
| HNSC (tumor) | HNSC (normal) |
| NEK10, SIRT3, SUMO1 (tumor) | NEK10, SIRT3, SUMO1 (normal) |
 |  |
| KICH (tumor) | KICH (normal) |
| NEK10, SIRT3, SUMO1 (tumor) | NEK10, SIRT3, SUMO1 (normal) |
 |  |
| KIRC (tumor) | KIRC (normal) |
| NEK10, SIRT3, SUMO1 (tumor) | NEK10, SIRT3, SUMO1 (normal) |
 |  |
| KIRP (tumor) | KIRP (normal) |
| NEK10, SIRT3, SUMO1 (tumor) | NEK10, SIRT3, SUMO1 (normal) |
 |  |
| LIHC (tumor) | LIHC (normal) |
| NEK10, SIRT3, SUMO1 (tumor) | NEK10, SIRT3, SUMO1 (normal) |
 |  |
| LUAD (tumor) | LUAD (normal) |
| NEK10, SIRT3, SUMO1 (tumor) | NEK10, SIRT3, SUMO1 (normal) |
 |  |
| LUSC (tumor) | LUSC (normal) |
| NEK10, SIRT3, SUMO1 (tumor) | NEK10, SIRT3, SUMO1 (normal) |
 |  |
| PRAD (tumor) | PRAD (normal) |
| NEK10, SIRT3, SUMO1 (tumor) | NEK10, SIRT3, SUMO1 (normal) |
 |  |
| STAD (tumor) | STAD (normal) |
| NEK10, SIRT3, SUMO1 (tumor) | NEK10, SIRT3, SUMO1 (normal) |
 |  |
| THCA (tumor) | THCA (normal) |
| NEK10, SIRT3, SUMO1 (tumor) | NEK10, SIRT3, SUMO1 (normal) |
 |  |
| Top |
| TissGeneProg for NEK10 |
| Kaplan-Meier plots with logrank tests of overall survival (OS) using 28 cancer types (TCGA IlluminaHiSeq_RNASeqV2, pan-cancer normalized log2(norm_counts+1) data, version 2016-08-16) (TCGA clinicalMatrix, phenotype data, version 2016-04-27) * Click on the image to enlarge it in a new window. |
 |
| Kaplan-Meier plots with logrank test of relapse free survival (RFS) using 28 cancer types (TCGA IlluminaHiSeq_RNASeqV2, pan-cancer normalized log2(norm_counts+1) data, version 2016-08-16) (TCGA clinicalMatrix, phenotype data, version 2016-04-27) * Click on the image enlarge it in a new window. |
 |
| Forest plot of Cox proportional hazard ratio (HR) and 95% CI of overall survival (OS) using 28 cancer types (TCGA IlluminaHiSeq_RNASeqV2, pan-cancer normalized log2(norm_counts+1) data, version 2016-08-16) (TCGA clinicalMatrix, phenotype data, version 2016-04-27) * Click on the image enlarge it in a new window. |
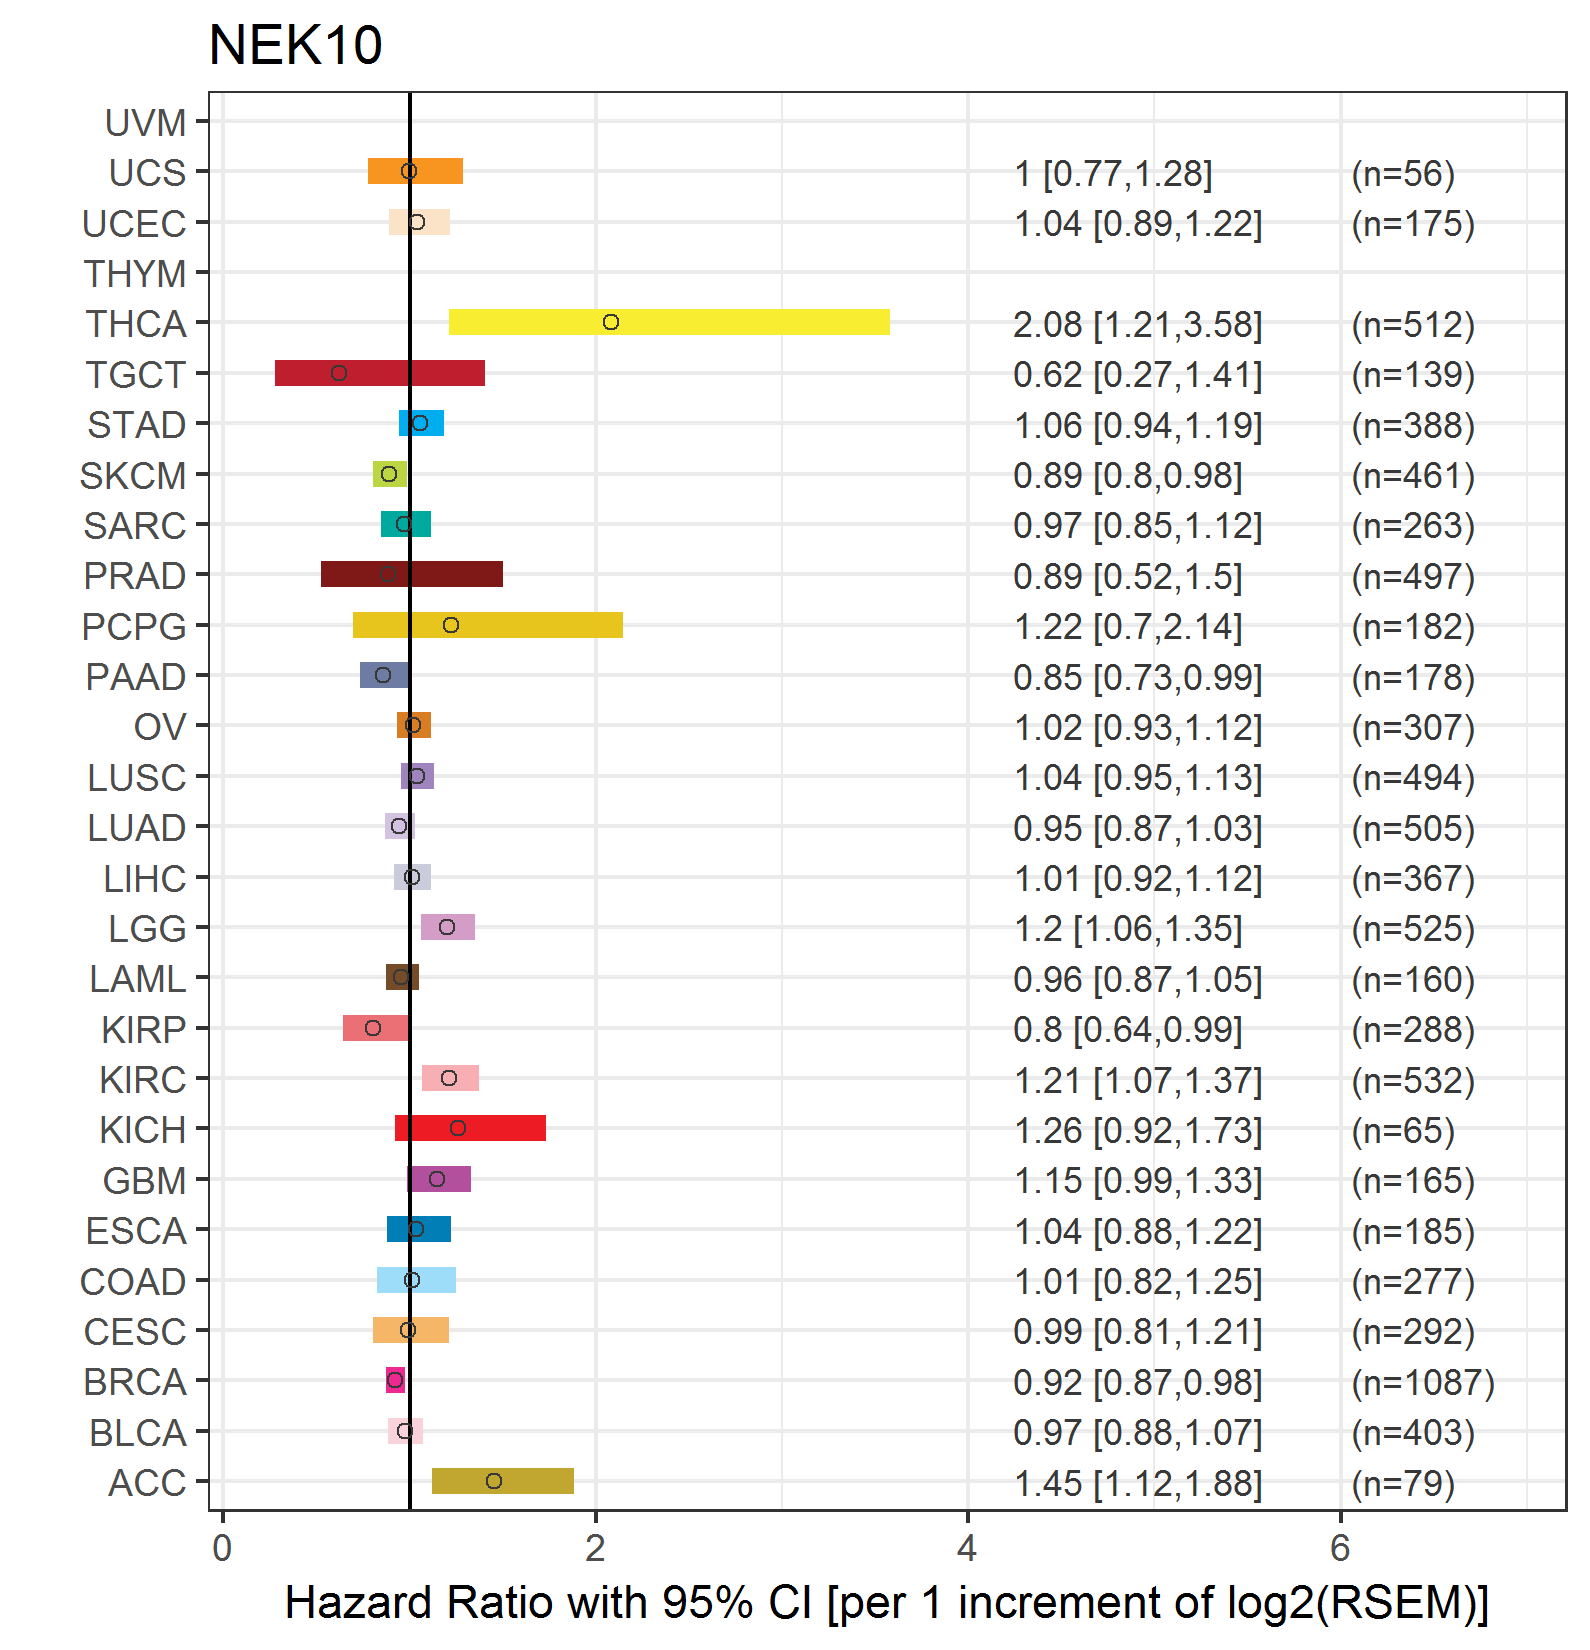 |
| Forest plot of Cox proportional hazard ratio (HR) and 95% CI of relapse free survival (RFS) using 28 cancer types (TCGA IlluminaHiSeq_RNASeqV2, pan-cancer normalized log2(norm_counts+1) data, version 2016-08-16) (TCGA clinicalMatrix, phenotype data, version 2016-04-27) * Click on the image enlarge it in a new window. |
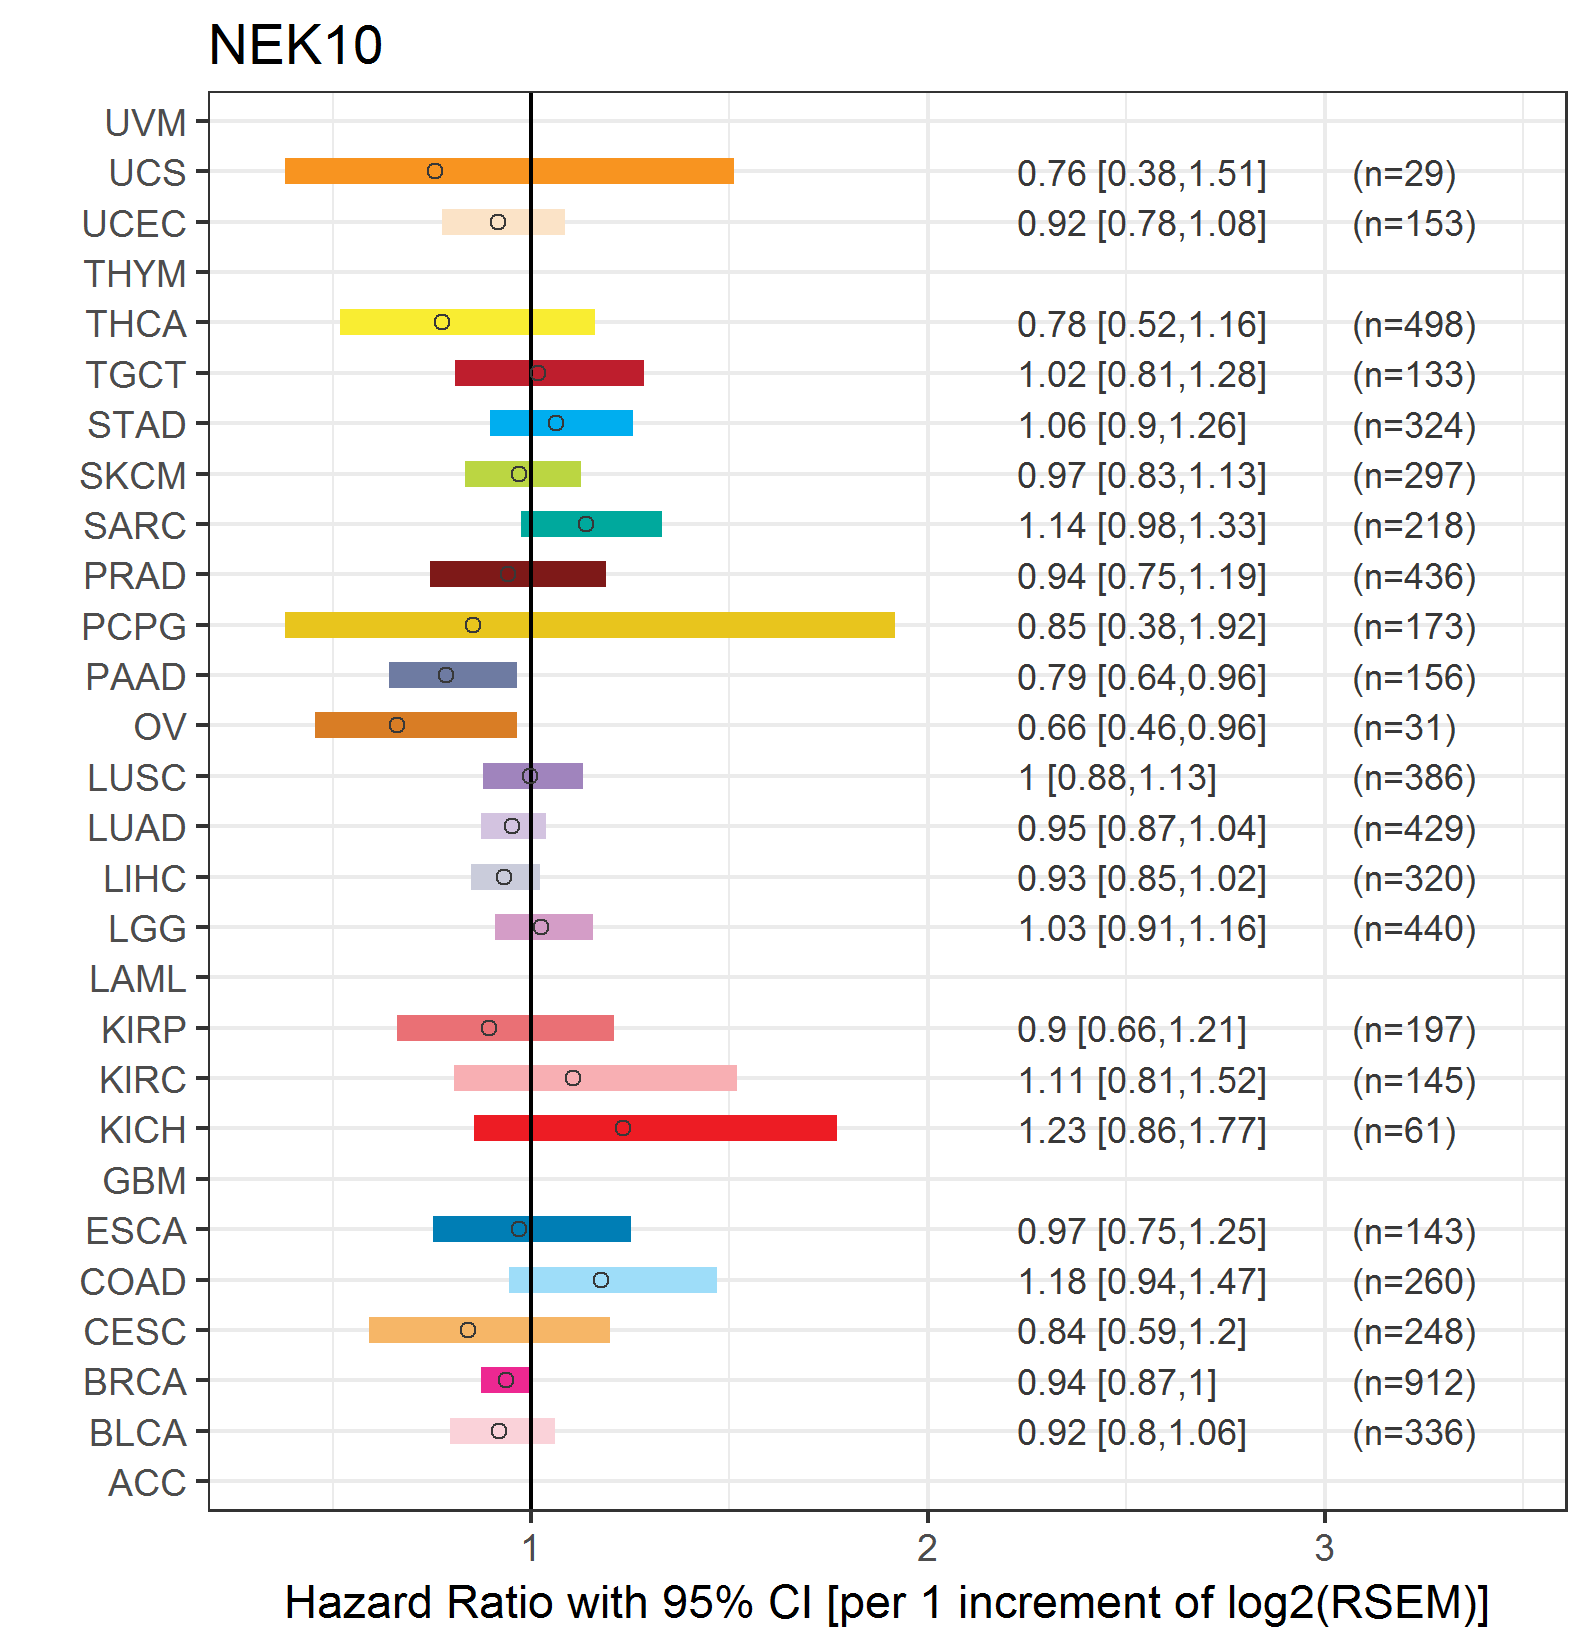 |
| Top |
| TissGeneClin for NEK10 |
| TissGeneDrug for NEK10 |
| Drug information targeting TissGene (DrugBank Version 5.0.6, 2017-04-01) |
| DrugBank ID | Drug name | Drug activity | Drug type | Drug status |
| Top |
| TissGeneDisease for NEK10 |
| Disease information associated with TissGene (DisGeNet, 2016-06-01) |
| Disease ID | Disease name | # pubmeds | Source |
| umls:C0006142 | Malignant neoplasm of breast | 4 | GAD,GWASCAT |
| umls:C0040336 | Tobacco Use Disorder | 1 | GAD |
|
Copyright 2016-Present - The University of Texas Health Science Center at Houston (UTHealth) Web File Viewing | How to Report, Fraud, Waste and Abuse | State of Texas | Statewide Search | Texas Homeland Security | Site Policies |