 |
| |
| |
| |
| |
| |
| |
|

| TissGeneSummary for IGSF11 |
 Gene summary Gene summary |
| Basic gene information | Gene symbol | IGSF11 |
| Gene name | immunoglobulin superfamily, member 11 | |
| Synonyms | BT-IgSF|CT119|CXADRL1|Igsf13|VSIG3 | |
| Cytomap | UCSC genome browser: 3q13.32 | |
| Type of gene | protein-coding | |
| RefGenes | NM_001015887.1, NM_152538.2, | |
| Description | CXADR like 1V-set and immunoglobulin domain containing 3V-set and immunoglobulin domain-containing protein 3brain and testis-specific immunoglobin superfamily proteinbrain and testis-specific immunoglobulin superfamily proteincancer/testis antigen 11 | |
| Modification date | 20141207 | |
| dbXrefs | MIM : 608351 | |
| HGNC : HGNC | ||
| Ensembl : ENSG00000144847 | ||
| HPRD : 16321 | ||
| Vega : OTTHUMG00000159387 | ||
| Protein | UniProt: go to UniProt's Cross Reference DB Table | |
| Expression | CleanEX: HS_IGSF11 | |
| BioGPS: 152404 | ||
| Pathway | NCI Pathway Interaction Database: IGSF11 | |
| KEGG: IGSF11 | ||
| REACTOME: IGSF11 | ||
| Pathway Commons: IGSF11 | ||
| Context | iHOP: IGSF11 | |
| ligand binding site mutation search in PubMed: IGSF11 | ||
| UCL Cancer Institute: IGSF11 | ||
| Assigned class in TissGDB* | C | |
| Included tissue-specific gene expression resources | TiGER,GTEx | |
| Specific-tissues in normal samples (assigned by TissGDB using HPA, TiGER, and GTEx) | Testis | |
| Cancer types related to the specific-tissues in cancer samples (assigned by TissGDB using TCGA) | TGCT | |
| Reference showing the relevant tissue of IGSF11 | ||
| Description by TissGene annotations | Have significant anti-correlated miRNA Fused withTSGene | |
| * Class A consists of genes with literature evidence and is part of the cTissGenes. Class B consists of only cTissGenes without additional evidence. The remaining genes belong to Class C. |
| Gene ontology having evidence of Inferred from Direct Assay (IDA) from Entrez |
| GO ID | GO term | PubMed ID |
| Top |
| TissGeneExp for IGSF11 |
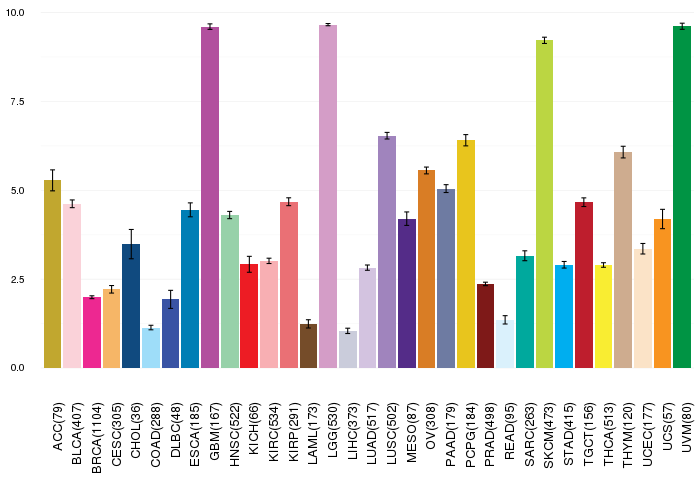
| Gene expressions across 28 cancer types (X-axis: cancer type and Y-axis: log2(norm_counts+1)) (TCGA IlluminaHiSeq_RNASeqV2, pan-cancer normalized log2(norm_counts+1) data, version 2016-08-16) |
 |
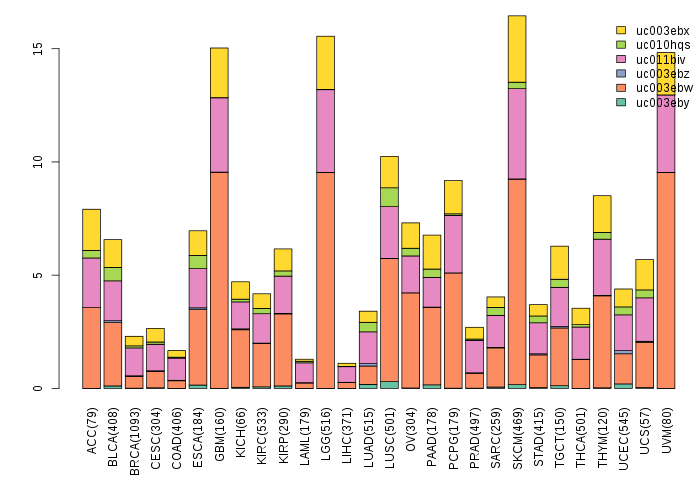
| Gene isoform expressions across 28 cancer types (X-axis: cancer type and Y-axis: log2(norm_counts+1)) (TCGA pan-cancer tcga_rsem_isoform_tpm, version 2016-09-01) |
 |
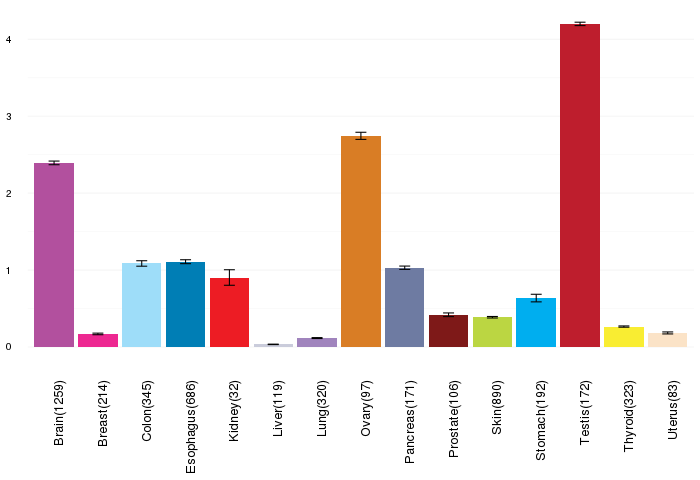
| Gene expressions across normal tissues of GTEx data (GTEx GTEx_Analysis_v6_RNA-seq_RNA-SeQCv1.1.8_gene_rpkm.gct) - Here, we shows the matched tissue types only among our 28 cancer types. |
 |
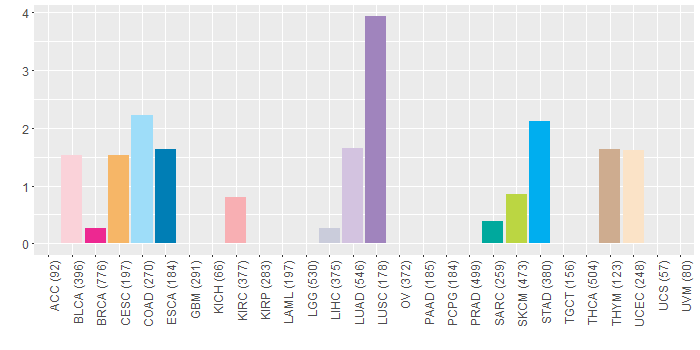
| Different expressions across 14 cancer types with more than 10 samples between matched tumors and normals (X-axis: cancer type and Y-axis: log2(norm_counts+1)) (TCGA IlluminaHiSeq_RNASeqV2, pan-cancer normalized log2(norm_counts+1) data, version 2016-08-16) |
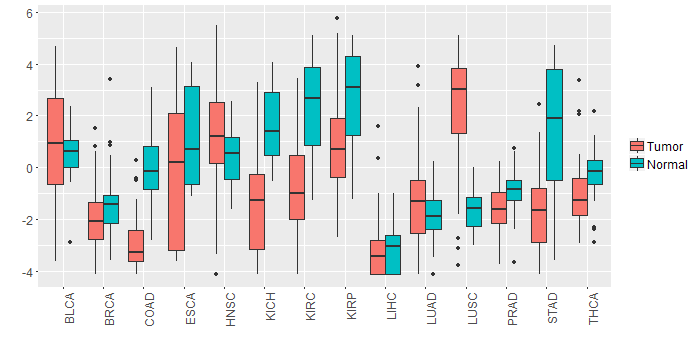 |
| - Significantly differentially expressed cancer types and information. (|Fold change|>1 and FDR<0.05) |
| Cancer type | Mean(exp) in tumor | Mean(exp) in matched normal | Log2FC | P-val. | FDR |
| KICH | -1.234210243 | 1.656813757 | -2.891024 | 1.98E-06 | 7.11E-06 |
| LUSC | 2.268926698 | -1.629441929 | 3.898368627 | 6.31E-18 | 5.69E-17 |
| KIRC | -0.877855409 | 2.398102924 | -3.275958333 | 5.19E-22 | 4.67E-21 |
| COAD | -2.883130089 | 0.041073757 | -2.924203846 | 3.10E-10 | 3.85E-09 |
| STAD | -1.633410618 | 1.616283132 | -3.24969375 | 8.67E-08 | 2.44E-06 |
| KIRP | 0.956864382 | 2.639676882 | -1.6828125 | 0.00123 | 0.003310516 |
| Top |
| TissGene-miRNA for IGSF11 |
| Significantly anti-correlated miRNAs of TissGene across 28 cancer types (Gene-miRNA relations from TargetScanHuman Relsease 7.1, Conserved_Site_Context_Scores.txt.zip, 06.01.2016) (TCGA IlluminaHiSeq_miRNASeq, log2(RPM+1) data, version 2016-11-21) (TCGA IlluminaHiSeq_RNASeqV2, log2(normalized_count+1) data, version 2016-08-16) (Spearman’s Rank Correlation (p-value<0.05 and coefficient<-0.25)) |
| Cancer type | miRNA id | miRNA accession | P-val. | Coeff. | # samples |
| UCS | hsa-miR-125a-5p | MIMAT0000443 | 0.028 | -0.3 | 56 |
| Top |
| TissGeneMut for IGSF11 |
| TissGeneSNV for IGSF11 |
| nsSNV counts per each loci. Different colors of circles represent different cancer types. Circle size denotes number of samples. (TCGA somatic mutation (SNPs and small INDELs) data, version 2016-04-25) * Click on the image to enlarge it in a new window. |
 |
 |
| Somatic nucleotide variants of TissGene across 28 cancer types (X-axis: cancer type and Y-axis: % of mutated samples) The numbers in parentheses are numbers of samples with mutation (nsSNVs). (TCGA somatic mutation (SNPs and small INDELs) data, version 2016-04-25) |
 |
| - nsSNVs sorted by frequency. |
| AAchange | Cancer type | # samples |
| p.S402F | SKCM | 2 |
| p.L211F | BLCA | 1 |
| p.L340W | HNSC | 1 |
| p.R203W | BRCA | 1 |
| p.V431I | STAD | 1 |
| p.N271Y | LUAD | 1 |
| p.S112T | LUAD | 1 |
| p.A263T | COAD | 1 |
| p.G350D | STAD | 1 |
| p.V160I | LUAD | 1 |
| p.R413Q | STAD | 1 |
| p.P234T | COAD | 1 |
| p.I220V | BLCA | 1 |
| p.P125T | HNSC | 1 |
| p.R426Q | STAD | 1 |
| p.C292R | COAD | 1 |
| p.I243T | BLCA | 1 |
| p.S323N | LUSC | 1 |
| p.C149Y | THYM | 1 |
| p.L241V | COAD | 1 |
| p.N271S | READ | 1 |
| p.R320Q | KIRC | 1 |
| p.N271K | KIRC | 1 |
| p.R413Q | UCEC | 1 |
| p.R202W | HNSC | 1 |
| p.R412Q | COAD | 1 |
| p.G350D | UCEC | 1 |
| p.M384I | LUAD | 1 |
| p.A146V | UCEC | 1 |
| p.S381L | CESC | 1 |
| p.A427T | THYM | 1 |
| p.L289P | STAD | 1 |
| p.F256L | HNSC | 1 |
| p.E412* | LUAD | 1 |
| p.K270E | LUAD | 1 |
| p.S49I | UCEC | 1 |
| p.S15F | LUSC | 1 |
| p.S113* | CESC | 1 |
| p.F255L | HNSC | 1 |
| p.A409T | STAD | 1 |
| p.N309K | BRCA | 1 |
| p.P325T | ESCA | 1 |
| p.T114N | LUAD | 1 |
| p.S313F | LUSC | 1 |
| p.L6I | UCEC | 1 |
| p.P290L | HNSC | 1 |
| p.N272Y | LUAD | 1 |
| p.K271E | LUAD | 1 |
| p.L6R | ESCA | 1 |
| p.H300N | KIRC | 1 |
| p.R203W | READ | 1 |
| p.L288P | STAD | 1 |
| p.R172* | SKCM | 1 |
| p.S209* | BLCA | 1 |
| p.V430I | STAD | 1 |
| p.G90S | CESC | 1 |
| p.S218C | LUSC | 1 |
| p.Y404H | STAD | 1 |
| p.S65F | LUSC | 1 |
| p.N323K | LUAD | 1 |
| p.P365L | SARC | 1 |
| p.P326T | ESCA | 1 |
| p.G89S | CESC | 1 |
| p.D159N | SKCM | 1 |
| p.T409S | LUAD | 1 |
| p.T410S | LUAD | 1 |
| p.S345C | BLCA | 1 |
| p.E411* | LUAD | 1 |
| p.V196I | STAD | 1 |
| p.I242T | BLCA | 1 |
| p.D82H | BLCA | 1 |
| p.M59I | LUAD | 1 |
| p.L212F | BLCA | 1 |
| p.V34A | DLBC | 1 |
| p.R319Q | KIRC | 1 |
| p.T312P | LUSC | 1 |
| p.N282K | LUSC | 1 |
| p.E333* | STAD | 1 |
| p.Q37K | LIHC | 1 |
| p.G341D | COAD | 1 |
| p.T249N | LUSC | 1 |
| p.N309K | ESCA | 1 |
| Top |
| TissGeneCNV for IGSF11 |
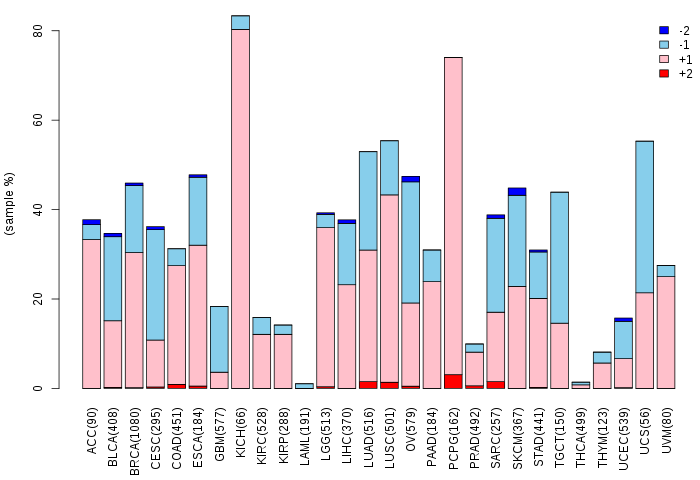
| Copy number variations of TissGene across 28 cancer types (X-axis: cancer type and Y-axis: % of CNV samples) (TCGA Gistic2_CopyNumber_Gistic2_all_data_by_genes, Gistic2 copy number data, version 2016-08-16) |
 |
| Top |
| TissGeneFusions for IGSF11 |
| Fusion genes including TissGene (ChimerDB 3.0, 2016-12-01 and TCGA fusion Portal 2015-12-01) |
| Database | Src | Cancer type | Sample | Fusion gene | ORF | 5'-gene BP | 3'-gene BP |
| Chimerdb3.0 | ChiTaRs | NA | AB209289 | IGSF11-PPP2R5B | chr3:118691581 | chr11:64692198 | |
| TCGAfusionPortal | PRADA | BLCA | TCGA-DK-A3X2-01A | MFI2-IGSF11 | In-frame | Chr3:196730772 | Chr3:118624565 |
| TCGAfusionPortal | PRADA | LUAD | TCGA-99-8032-01A | PBRM1-IGSF11 | Out-of-frame | Chr3:52712516 | Chr3:118647563 |
| Top |
| TissGeneNet for IGSF11 |
| Co-expressed gene networks based on protein-protein interaction data (CePIN) (TCGA IlluminaHiSeq_RNASeqV2, pan-cancer normalized log2(norm_counts+1) data, version 2016-08-16) (PINA2 ppi data) |
| Top |
| TissGeneProg for IGSF11 |
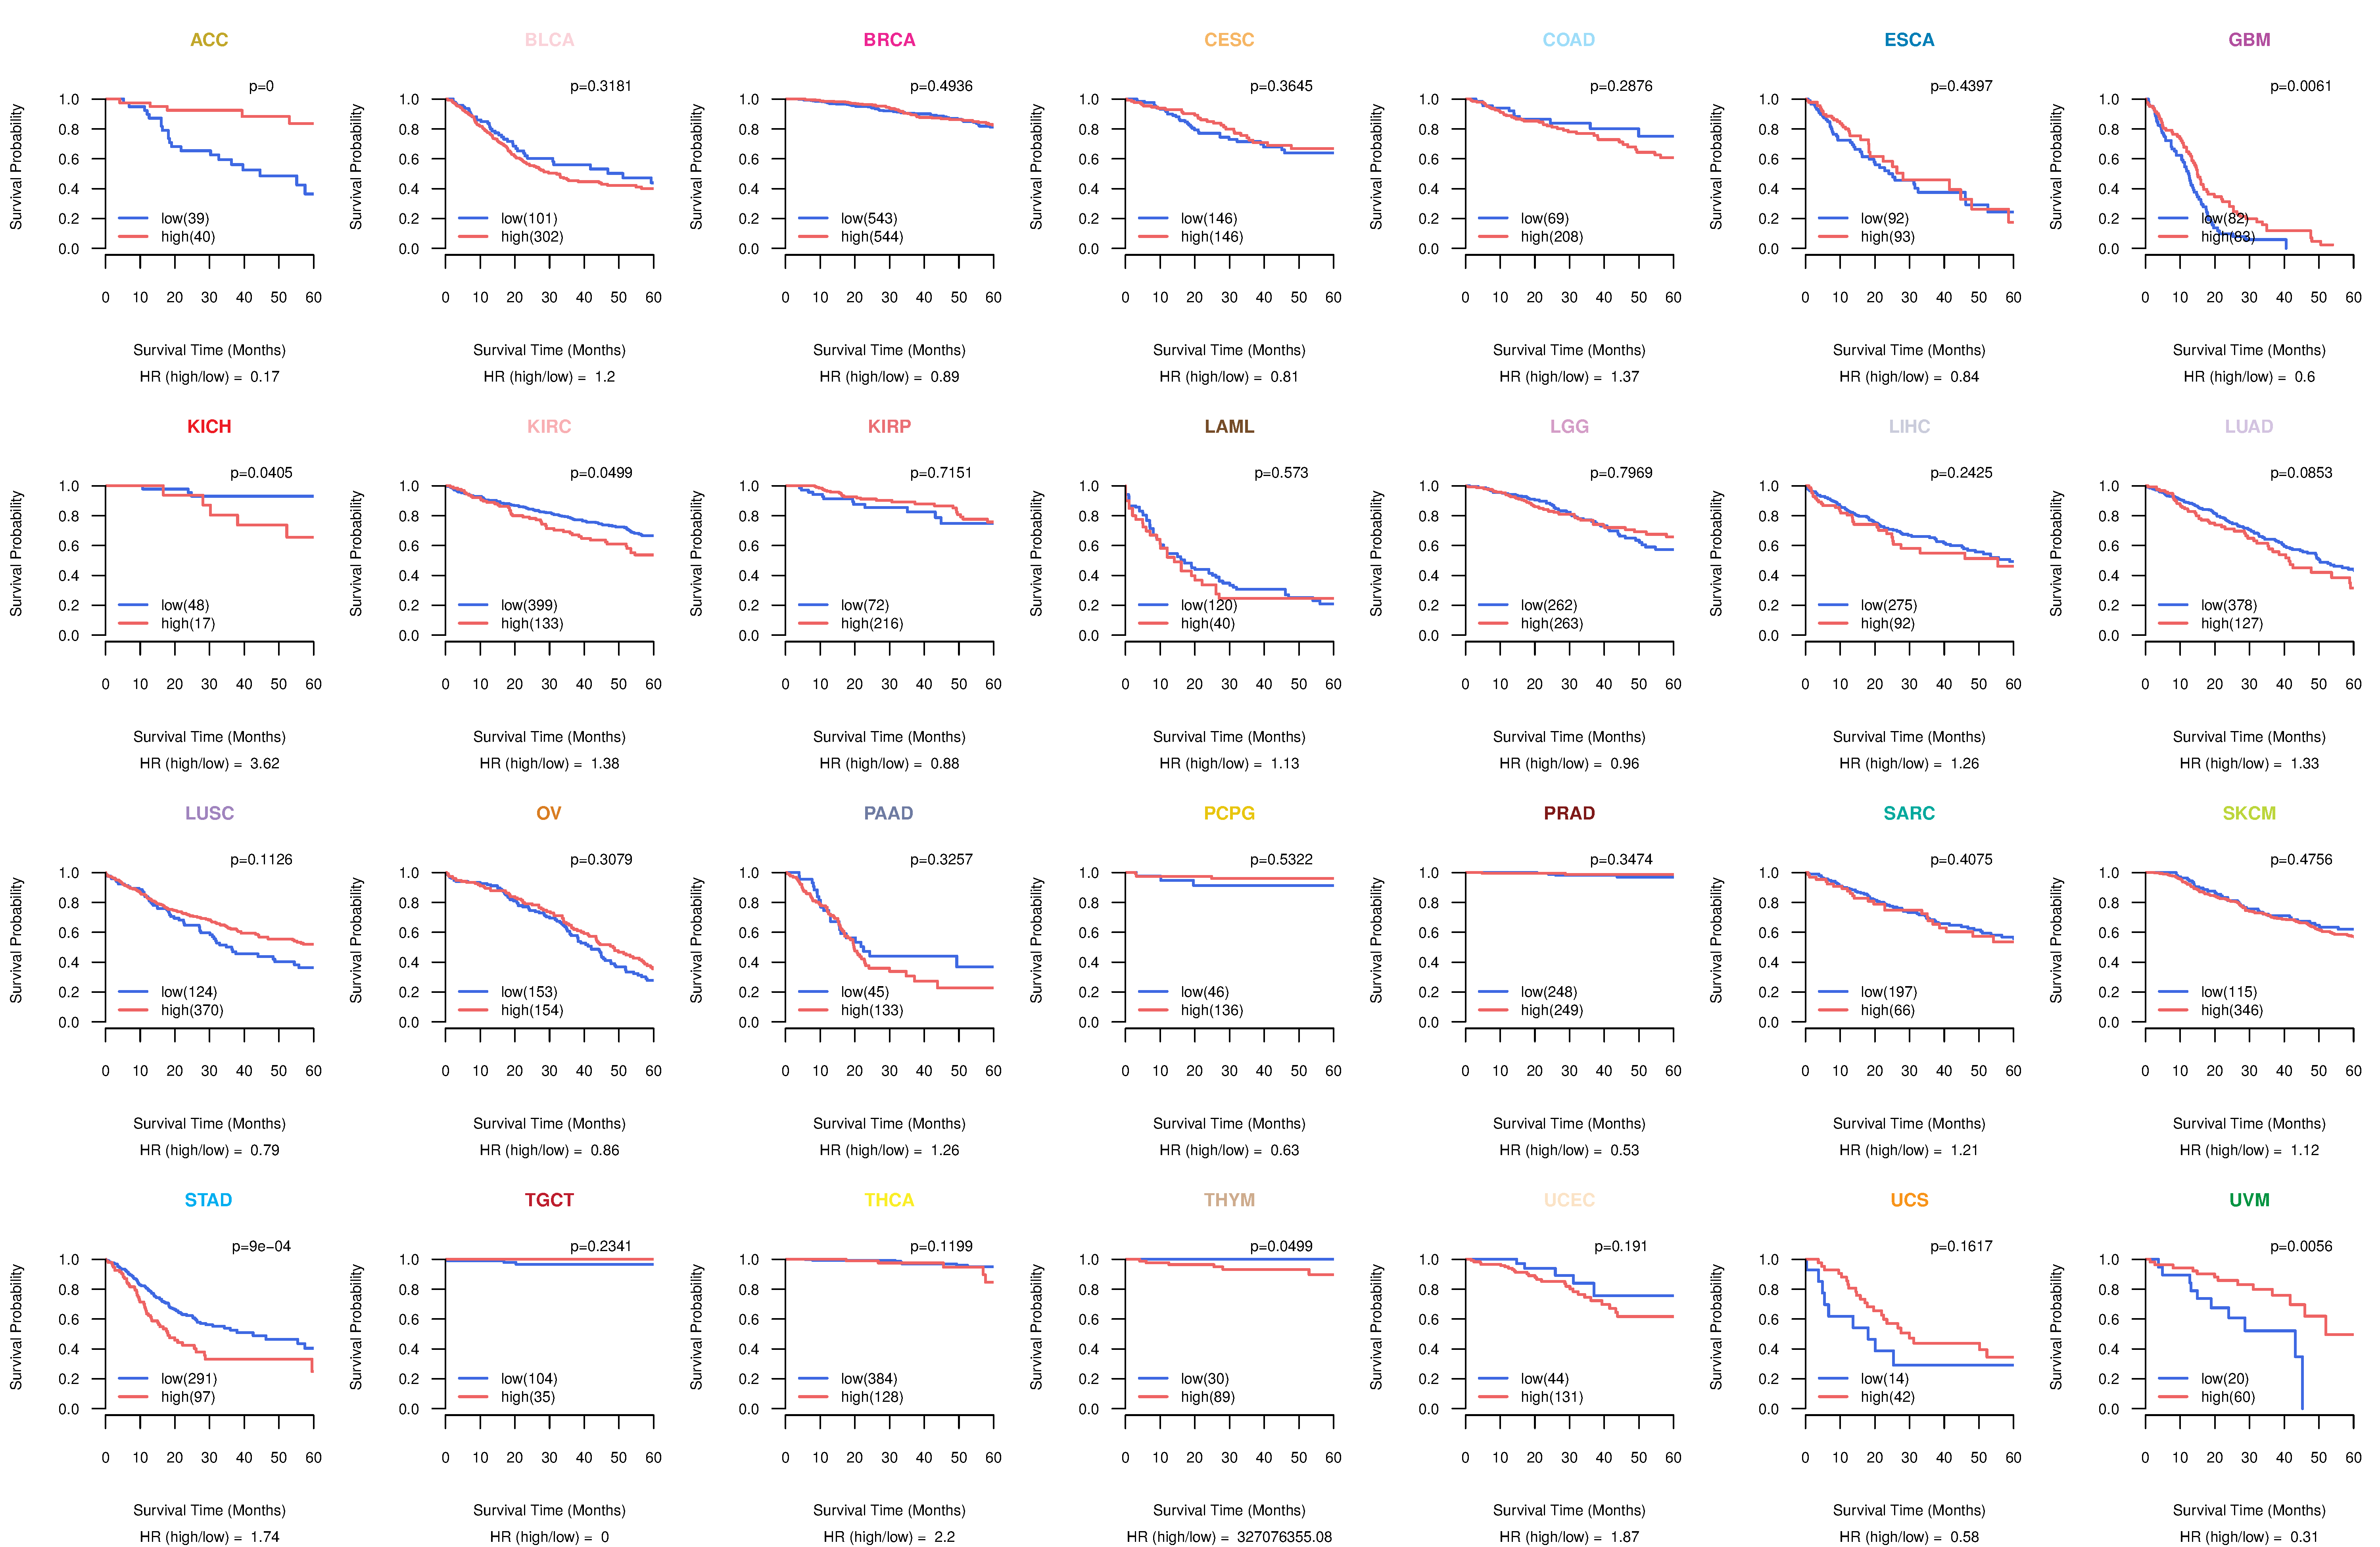
| Kaplan-Meier plots with logrank tests of overall survival (OS) using 28 cancer types (TCGA IlluminaHiSeq_RNASeqV2, pan-cancer normalized log2(norm_counts+1) data, version 2016-08-16) (TCGA clinicalMatrix, phenotype data, version 2016-04-27) * Click on the image to enlarge it in a new window. |
 |
| Kaplan-Meier plots with logrank test of relapse free survival (RFS) using 28 cancer types (TCGA IlluminaHiSeq_RNASeqV2, pan-cancer normalized log2(norm_counts+1) data, version 2016-08-16) (TCGA clinicalMatrix, phenotype data, version 2016-04-27) * Click on the image enlarge it in a new window. |
 |
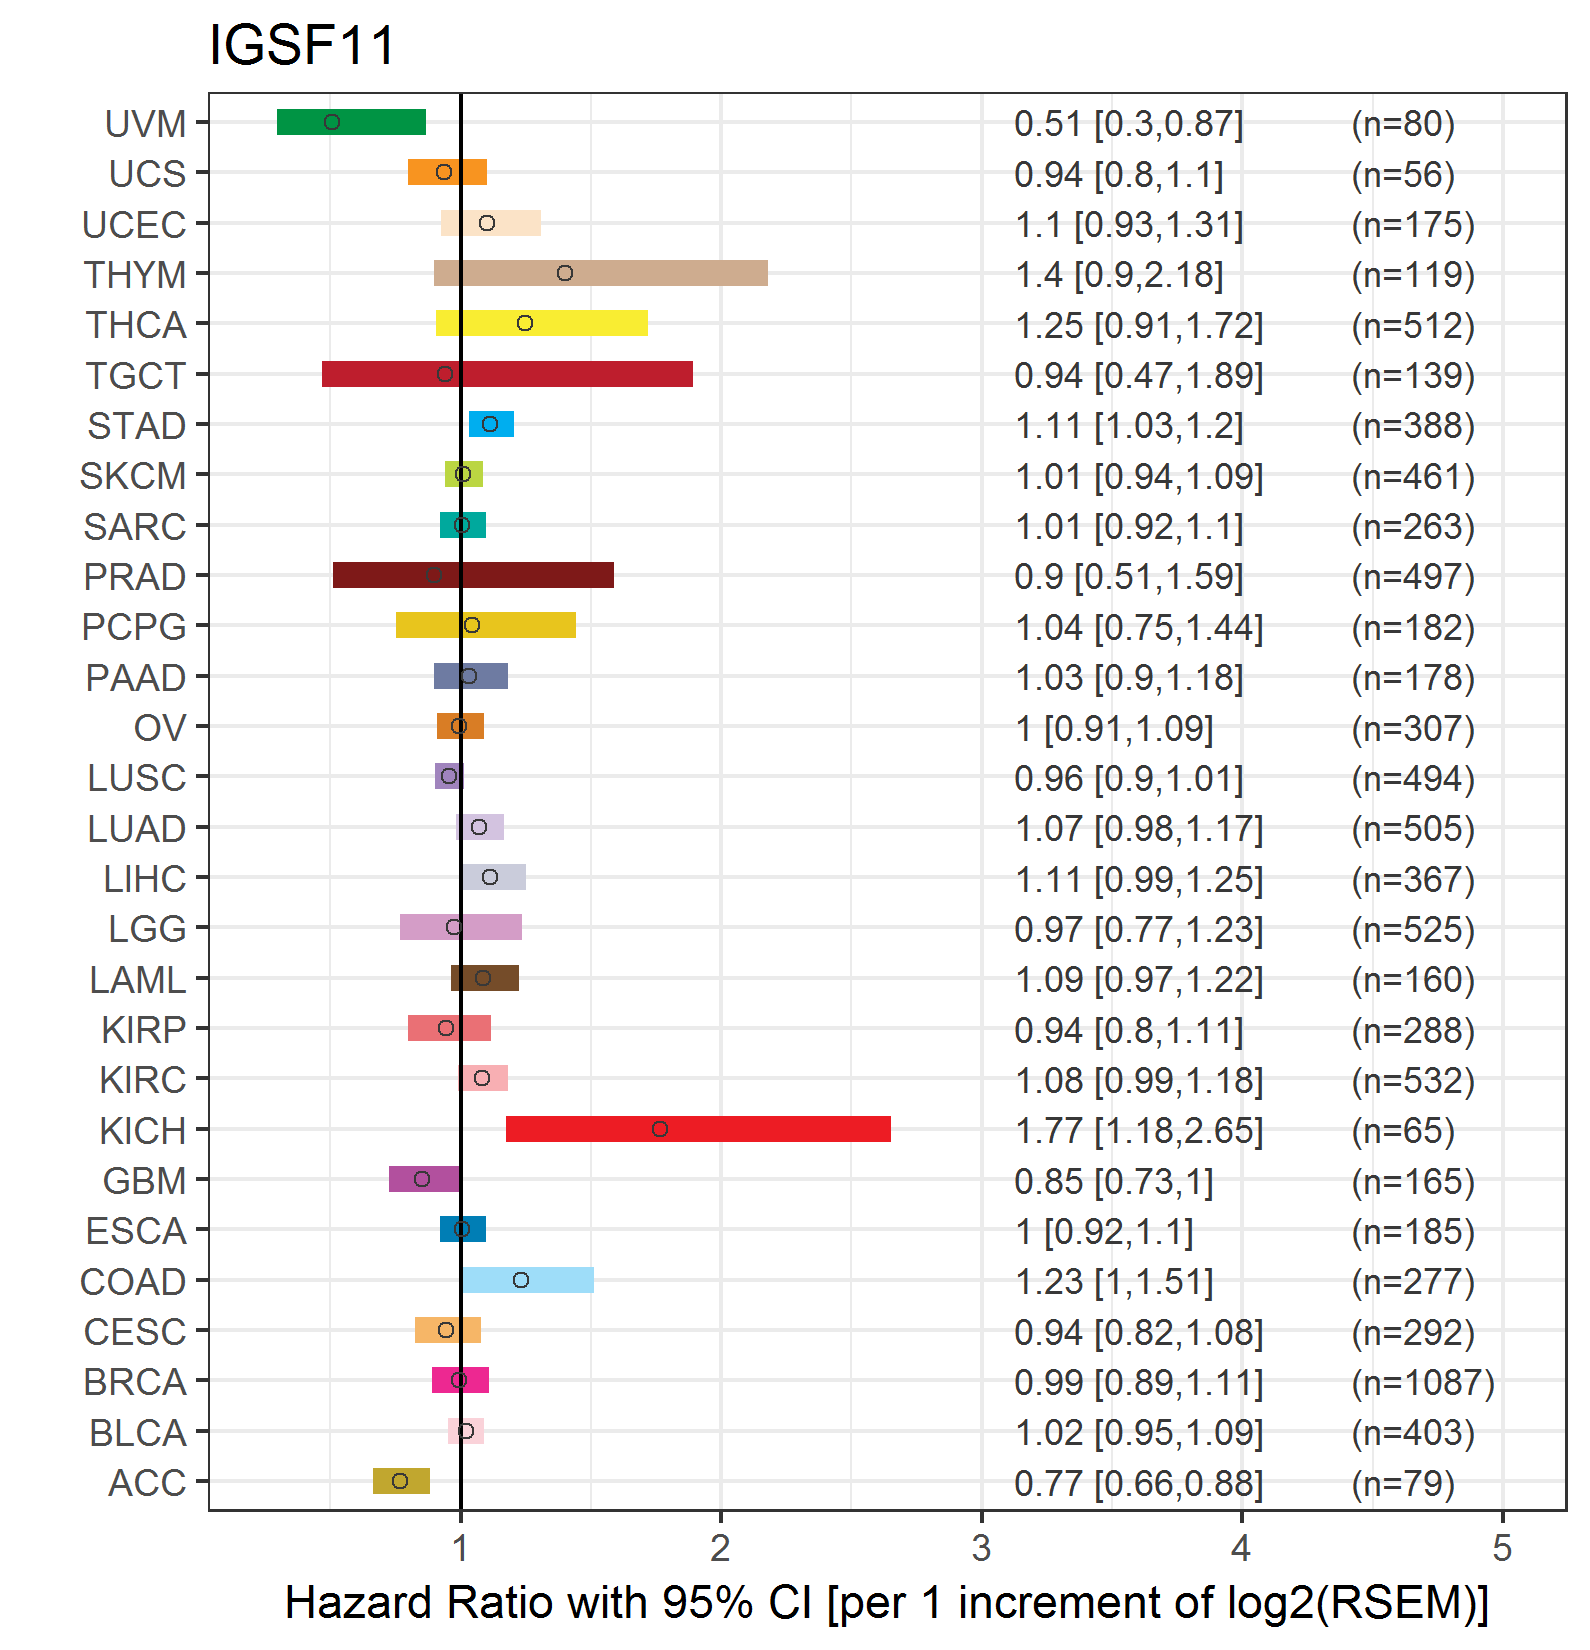
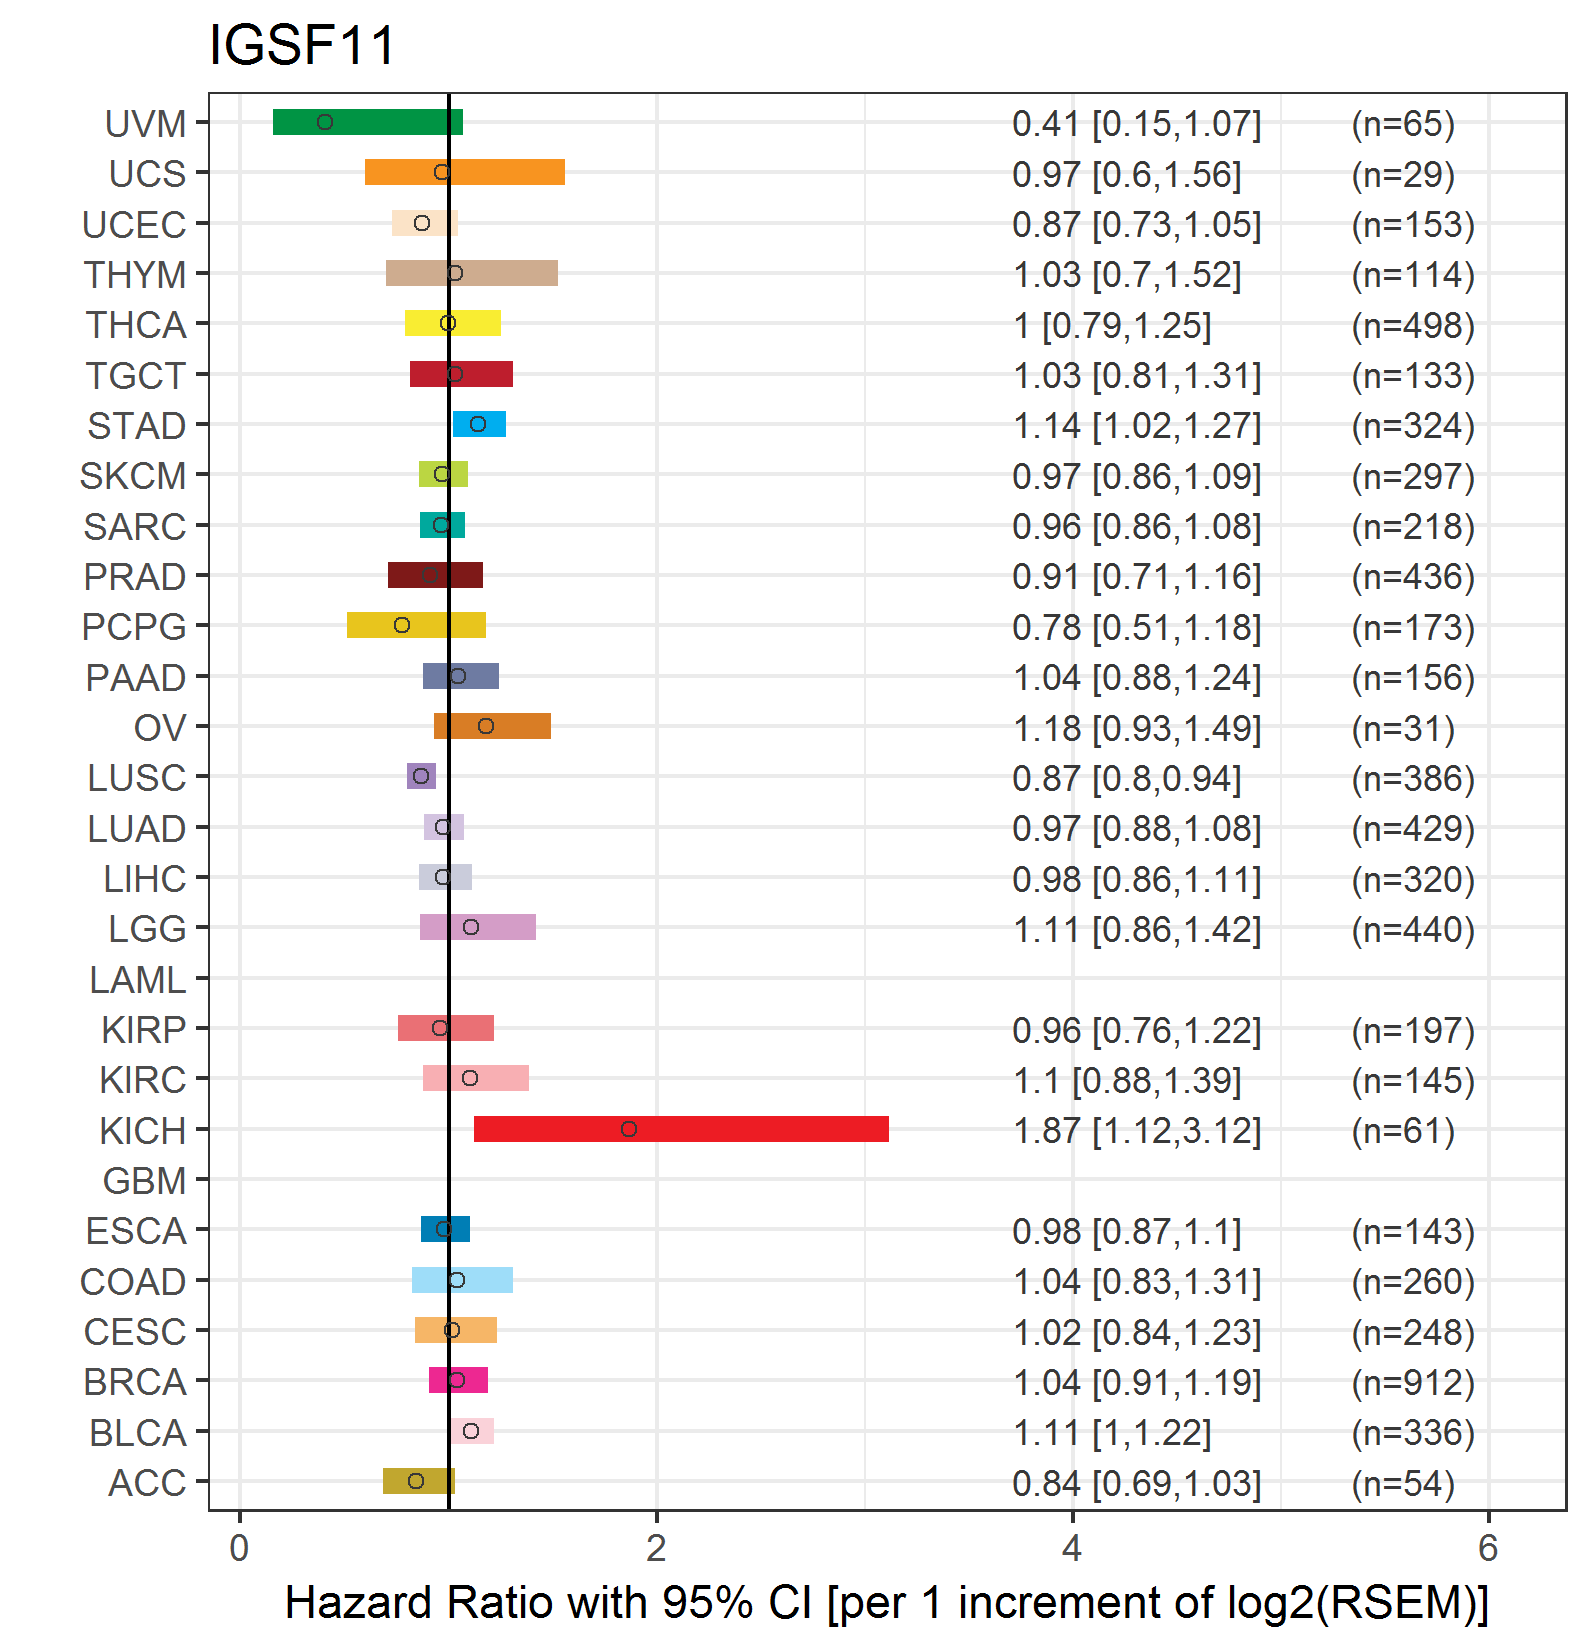
| Forest plot of Cox proportional hazard ratio (HR) and 95% CI of overall survival (OS) using 28 cancer types (TCGA IlluminaHiSeq_RNASeqV2, pan-cancer normalized log2(norm_counts+1) data, version 2016-08-16) (TCGA clinicalMatrix, phenotype data, version 2016-04-27) * Click on the image enlarge it in a new window. |
 |
| Forest plot of Cox proportional hazard ratio (HR) and 95% CI of relapse free survival (RFS) using 28 cancer types (TCGA IlluminaHiSeq_RNASeqV2, pan-cancer normalized log2(norm_counts+1) data, version 2016-08-16) (TCGA clinicalMatrix, phenotype data, version 2016-04-27) * Click on the image enlarge it in a new window. |
 |
| Top |
| TissGeneClin for IGSF11 |
| TissGeneDrug for IGSF11 |
| Drug information targeting TissGene (DrugBank Version 5.0.6, 2017-04-01) |
| DrugBank ID | Drug name | Drug activity | Drug type | Drug status |
| Top |
| TissGeneDisease for IGSF11 |
| Disease information associated with TissGene (DisGeNet, 2016-06-01) |
| Disease ID | Disease name | # pubmeds | Source |
| umls:C0024623 | Malignant neoplasm of stomach | 1 | BeFree |
| umls:C0038356 | Stomach Neoplasms | 1 | LHGDN |
| umls:C0153594 | Malignant neoplasm of testis | 1 | BeFree |
| umls:C0699791 | Stomach Carcinoma | 1 | BeFree |
| umls:C2239176 | Liver carcinoma | 1 | BeFree |
|
Copyright 2016-Present - The University of Texas Health Science Center at Houston (UTHealth) Web File Viewing | How to Report, Fraud, Waste and Abuse | State of Texas | Statewide Search | Texas Homeland Security | Site Policies |