 |
| |
| |
| |
| |
| |
| |
|

| TissGeneSummary for SLC5A12 |
 Gene summary Gene summary |
| Basic gene information | Gene symbol | SLC5A12 |
| Gene name | solute carrier family 5 (sodium/monocarboxylate cotransporter), member 12 | |
| Synonyms | SMCT2 | |
| Cytomap | UCSC genome browser: 11p14.2 | |
| Type of gene | protein-coding | |
| RefGenes | NM_178498.3, | |
| Description | electroneutral sodium monocarboxylate cotransporterlow-affinity sodium-lactate cotransportersodium-coupled monocarboxylate transporter 2sodium-iodide related cotransportersolute carrier family 5 (sodium/glucose cotransporter), member 12solute carrier | |
| Modification date | 20141207 | |
| dbXrefs | MIM : 612455 | |
| HGNC : HGNC | ||
| Ensembl : ENSG00000148942 | ||
| HPRD : 15395 | ||
| Vega : OTTHUMG00000150706 | ||
| Protein | UniProt: go to UniProt's Cross Reference DB Table | |
| Expression | CleanEX: HS_SLC5A12 | |
| BioGPS: 159963 | ||
| Pathway | NCI Pathway Interaction Database: SLC5A12 | |
| KEGG: SLC5A12 | ||
| REACTOME: SLC5A12 | ||
| Pathway Commons: SLC5A12 | ||
| Context | iHOP: SLC5A12 | |
| ligand binding site mutation search in PubMed: SLC5A12 | ||
| UCL Cancer Institute: SLC5A12 | ||
| Assigned class in TissGDB* | C | |
| Included tissue-specific gene expression resources | TiGER,GTEx | |
| Specific-tissues in normal samples (assigned by TissGDB using HPA, TiGER, and GTEx) | Kidney | |
| Cancer types related to the specific-tissues in cancer samples (assigned by TissGDB using TCGA) | KIRC,KIRP,KICH | |
| Reference showing the relevant tissue of SLC5A12 | ||
| Description by TissGene annotations | ||
| * Class A consists of genes with literature evidence and is part of the cTissGenes. Class B consists of only cTissGenes without additional evidence. The remaining genes belong to Class C. |
| Gene ontology having evidence of Inferred from Direct Assay (IDA) from Entrez |
| GO ID | GO term | PubMed ID |
| Top |
| TissGeneExp for SLC5A12 |
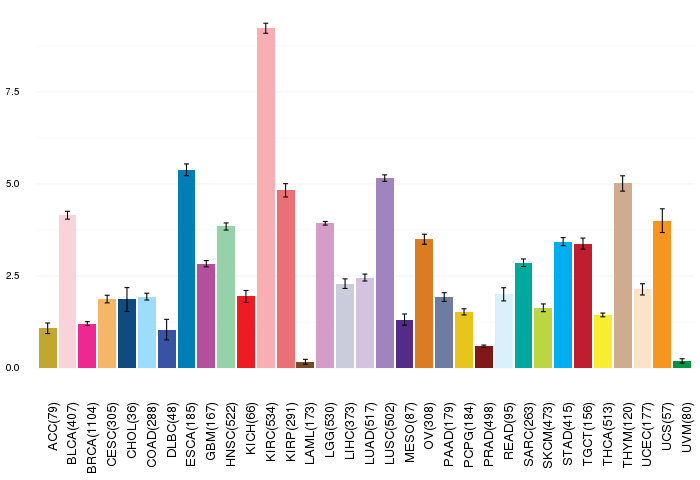
| Gene expressions across 28 cancer types (X-axis: cancer type and Y-axis: log2(norm_counts+1)) (TCGA IlluminaHiSeq_RNASeqV2, pan-cancer normalized log2(norm_counts+1) data, version 2016-08-16) |
 |
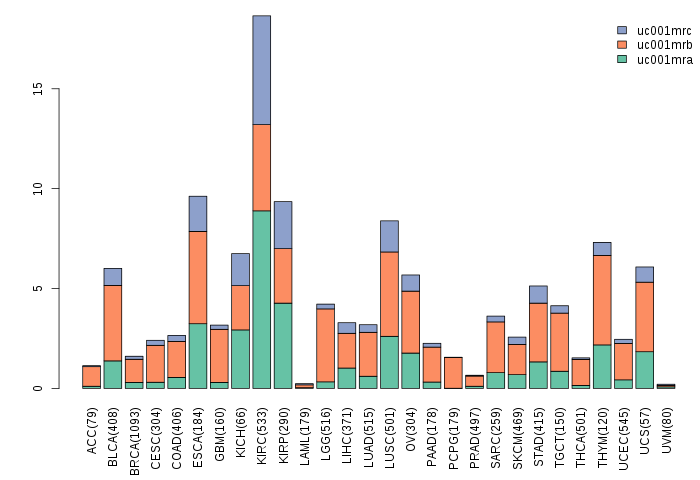
| Gene isoform expressions across 28 cancer types (X-axis: cancer type and Y-axis: log2(norm_counts+1)) (TCGA pan-cancer tcga_rsem_isoform_tpm, version 2016-09-01) |
 |
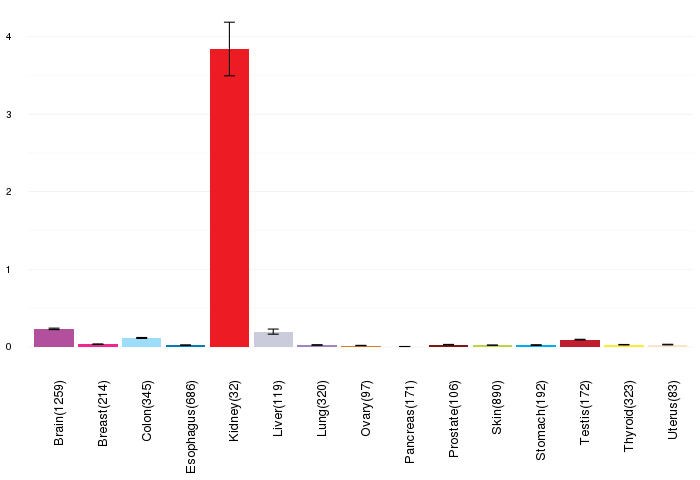
| Gene expressions across normal tissues of GTEx data (GTEx GTEx_Analysis_v6_RNA-seq_RNA-SeQCv1.1.8_gene_rpkm.gct) - Here, we shows the matched tissue types only among our 28 cancer types. |
 |
| Different expressions across 14 cancer types with more than 10 samples between matched tumors and normals (X-axis: cancer type and Y-axis: log2(norm_counts+1)) (TCGA IlluminaHiSeq_RNASeqV2, pan-cancer normalized log2(norm_counts+1) data, version 2016-08-16) |
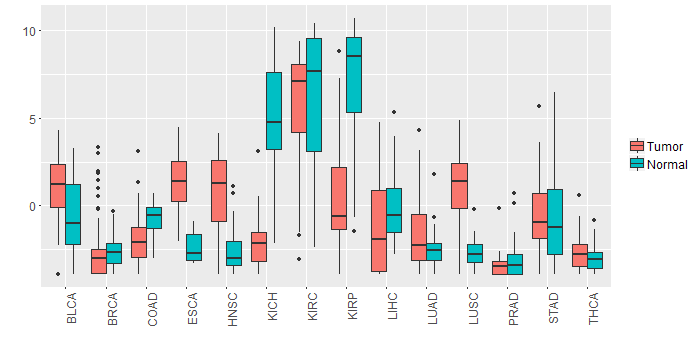 |
| - Significantly differentially expressed cancer types and information. (|Fold change|>1 and FDR<0.05) |
| Cancer type | Mean(exp) in tumor | Mean(exp) in matched normal | Log2FC | P-val. | FDR |
| KICH | -2.068840868 | 4.835415132 | -6.904256 | 9.89E-11 | 7.65E-10 |
| LUSC | 0.938628701 | -2.704492868 | 3.643121569 | 9.21E-17 | 7.20E-16 |
| KIRP | 0.571075882 | 7.092997757 | -6.521921875 | 5.18E-11 | 6.35E-10 |
| HNSC | 0.826942016 | -2.674734728 | 3.501676744 | 9.29E-15 | 6.15E-13 |
| LIHC | -1.259698868 | -0.120106868 | -1.139592 | 0.0141 | 0.02878318 |
| COAD | -1.819535175 | -0.744496714 | -1.075038462 | 0.00676 | 0.015607123 |
| ESCA | 1.334807132 | -2.373065595 | 3.707872727 | 0.000108 | 0.00341431 |
| LUAD | -1.532491144 | -2.583999764 | 1.051508621 | 0.00122 | 0.002633744 |
| Top |
| TissGene-miRNA for SLC5A12 |
| Significantly anti-correlated miRNAs of TissGene across 28 cancer types (Gene-miRNA relations from TargetScanHuman Relsease 7.1, Conserved_Site_Context_Scores.txt.zip, 06.01.2016) (TCGA IlluminaHiSeq_miRNASeq, log2(RPM+1) data, version 2016-11-21) (TCGA IlluminaHiSeq_RNASeqV2, log2(normalized_count+1) data, version 2016-08-16) (Spearman’s Rank Correlation (p-value<0.05 and coefficient<-0.25)) |
| Cancer type | miRNA id | miRNA accession | P-val. | Coeff. | # samples |
| Top |
| TissGeneMut for SLC5A12 |
| TissGeneSNV for SLC5A12 |
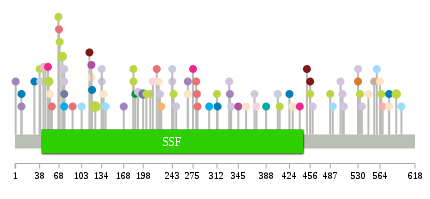
| nsSNV counts per each loci. Different colors of circles represent different cancer types. Circle size denotes number of samples. (TCGA somatic mutation (SNPs and small INDELs) data, version 2016-04-25) * Click on the image to enlarge it in a new window. |
 |
 |
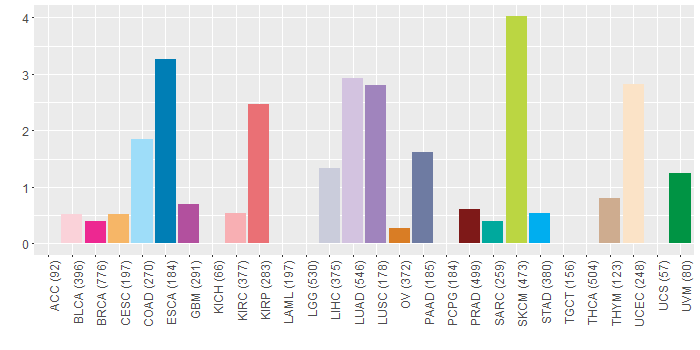
| Somatic nucleotide variants of TissGene across 28 cancer types (X-axis: cancer type and Y-axis: % of mutated samples) The numbers in parentheses are numbers of samples with mutation (nsSNVs). (TCGA somatic mutation (SNPs and small INDELs) data, version 2016-04-25) |
 |
| - nsSNVs sorted by frequency. |
| AAchange | Cancer type | # samples |
| p.R124C | SKCM | 4 |
| p.P52L | SKCM | 2 |
| p.G589E | SKCM | 2 |
| p.E73K | SKCM | 2 |
| p.T198M | PAAD | 2 |
| p.R118* | GBM | 1 |
| p.H300Y | STAD | 1 |
| p.W249L | LUAD | 1 |
| p.G140R | COAD | 1 |
| p.R39X | LIHC | 1 |
| p.E568V | KIRC | 1 |
| p.W451L | PRAD | 1 |
| p.Q47X | KIRC | 1 |
| p.T345I | GBM | 1 |
| p.L115F | PRAD | 1 |
| p.K179T | READ | 1 |
| p.V406A | LIHC | 1 |
| p.V67F | SKCM | 1 |
| p.D497N | HNSC | 1 |
| p.C559R | COAD | 1 |
| p.P331T | LUAD | 1 |
| p.P232T | CHOL | 1 |
| p.R76L | LUAD | 1 |
| p.G332E | HNSC | 1 |
| p.Q134L | LUAD | 1 |
| p.T135S | HNSC | 1 |
| p.Y506N | LUAD | 1 |
| p.G332* | LUSC | 1 |
| p.D533A | HNSC | 1 |
| p.H597Y | COAD | 1 |
| p.V243E | LUAD | 1 |
| p.V429M | UCEC | 1 |
| p.A186V | UVM | 1 |
| p.L281P | KIRP | 1 |
| p.S373F | BLCA | 1 |
| p.G209R | SKCM | 1 |
| p.A456T | PRAD | 1 |
| p.L137I | UCEC | 1 |
| p.G195V | HNSC | 1 |
| p.R118* | HNSC | 1 |
| p.A456V | SKCM | 1 |
| p.S503C | LUAD | 1 |
| p.D564G | UCEC | 1 |
| p.S38F | SKCM | 1 |
| p.K267E | UCEC | 1 |
| p.H224Q | LUAD | 1 |
| p.V243E | LIHC | 1 |
| p.S388N | SARC | 1 |
| p.G282C | KIRP | 1 |
| p.R530K | OV | 1 |
| p.W183X | SKCM | 1 |
| p.G51C | BRCA | 1 |
| p.T58A | DLBC | 1 |
| p.R222* | UCEC | 1 |
| p.S409F | SKCM | 1 |
| p.I312T | SKCM | 1 |
| p.R578Q | UCEC | 1 |
| p.R118L | UCEC | 1 |
| p.G54S | UCEC | 1 |
| p.G440V | BRCA | 1 |
| p.F546V | UCEC | 1 |
| p.D10N | LUSC | 1 |
| p.P536Q | LUAD | 1 |
| p.L89Q | KIRP | 1 |
| p.N219K | KIRP | 1 |
| p.V168A | LUSC | 1 |
| p.F77C | READ | 1 |
| p.S226* | CESC | 1 |
| p.G245E | SKCM | 1 |
| p.A275T | BRCA | 1 |
| p.F424V | ESCA | 1 |
| p.S313L | ESCA | 1 |
| p.R76G | LUAD | 1 |
| p.P370S | LIHC | 1 |
| p.V213L | BLCA | 1 |
| p.V190F | LUAD | 1 |
| p.R578P | ESCA | 1 |
| p.R76H | PAAD | 1 |
| p.L280S | KIRP | 1 |
| p.T555K | THYM | 1 |
| p.Q134R | LIHC | 1 |
| p.R76H | STAD | 1 |
| p.F27L | READ | 1 |
| p.G69E | SKCM | 1 |
| p.R124L | HNSC | 1 |
| p.K267I | LUSC | 1 |
| p.A357T | UCEC | 1 |
| p.M1I | LUSC | 1 |
| p.L68P | KIRP | 1 |
| p.G44W | LUAD | 1 |
| p.P460H | LUAD | 1 |
| p.W183* | SKCM | 1 |
| p.P487L | SKCM | 1 |
| p.F103L | COAD | 1 |
| p.S491N | COAD | 1 |
| p.D533N | SKCM | 1 |
| p.L57V | KIRP | 1 |
| p.I30N | ESCA | 1 |
| p.G203R | SKCM | 1 |
| p.R530G | LUAD | 1 |
| p.S501L | DLBC | 1 |
| p.G566E | SKCM | 1 |
| p.P334T | LUAD | 1 |
| p.S508I | LUAD | 1 |
| p.F119L | ESCA | 1 |
| p.D10Y | ESCA | 1 |
| Top |
| TissGeneCNV for SLC5A12 |
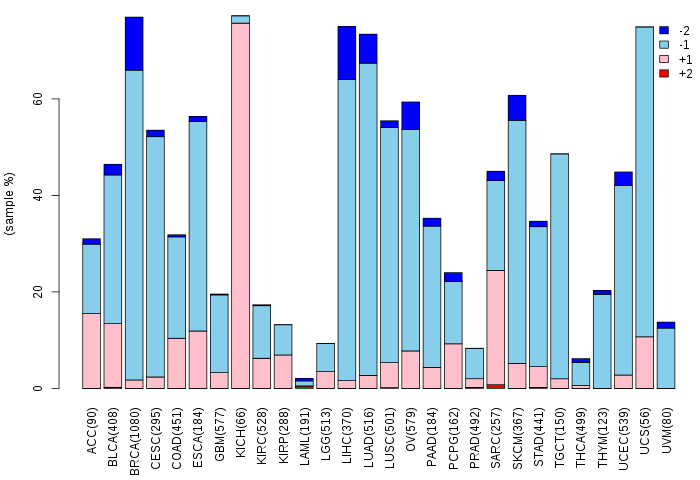
| Copy number variations of TissGene across 28 cancer types (X-axis: cancer type and Y-axis: % of CNV samples) (TCGA Gistic2_CopyNumber_Gistic2_all_data_by_genes, Gistic2 copy number data, version 2016-08-16) |
 |
| Top |
| TissGeneFusions for SLC5A12 |
| Fusion genes including TissGene (ChimerDB 3.0, 2016-12-01 and TCGA fusion Portal 2015-12-01) |
| Database | Src | Cancer type | Sample | Fusion gene | ORF | 5'-gene BP | 3'-gene BP |
| Top |
| TissGeneNet for SLC5A12 |
| Co-expressed gene networks based on protein-protein interaction data (CePIN) (TCGA IlluminaHiSeq_RNASeqV2, pan-cancer normalized log2(norm_counts+1) data, version 2016-08-16) (PINA2 ppi data) |
| Top |
| TissGeneProg for SLC5A12 |
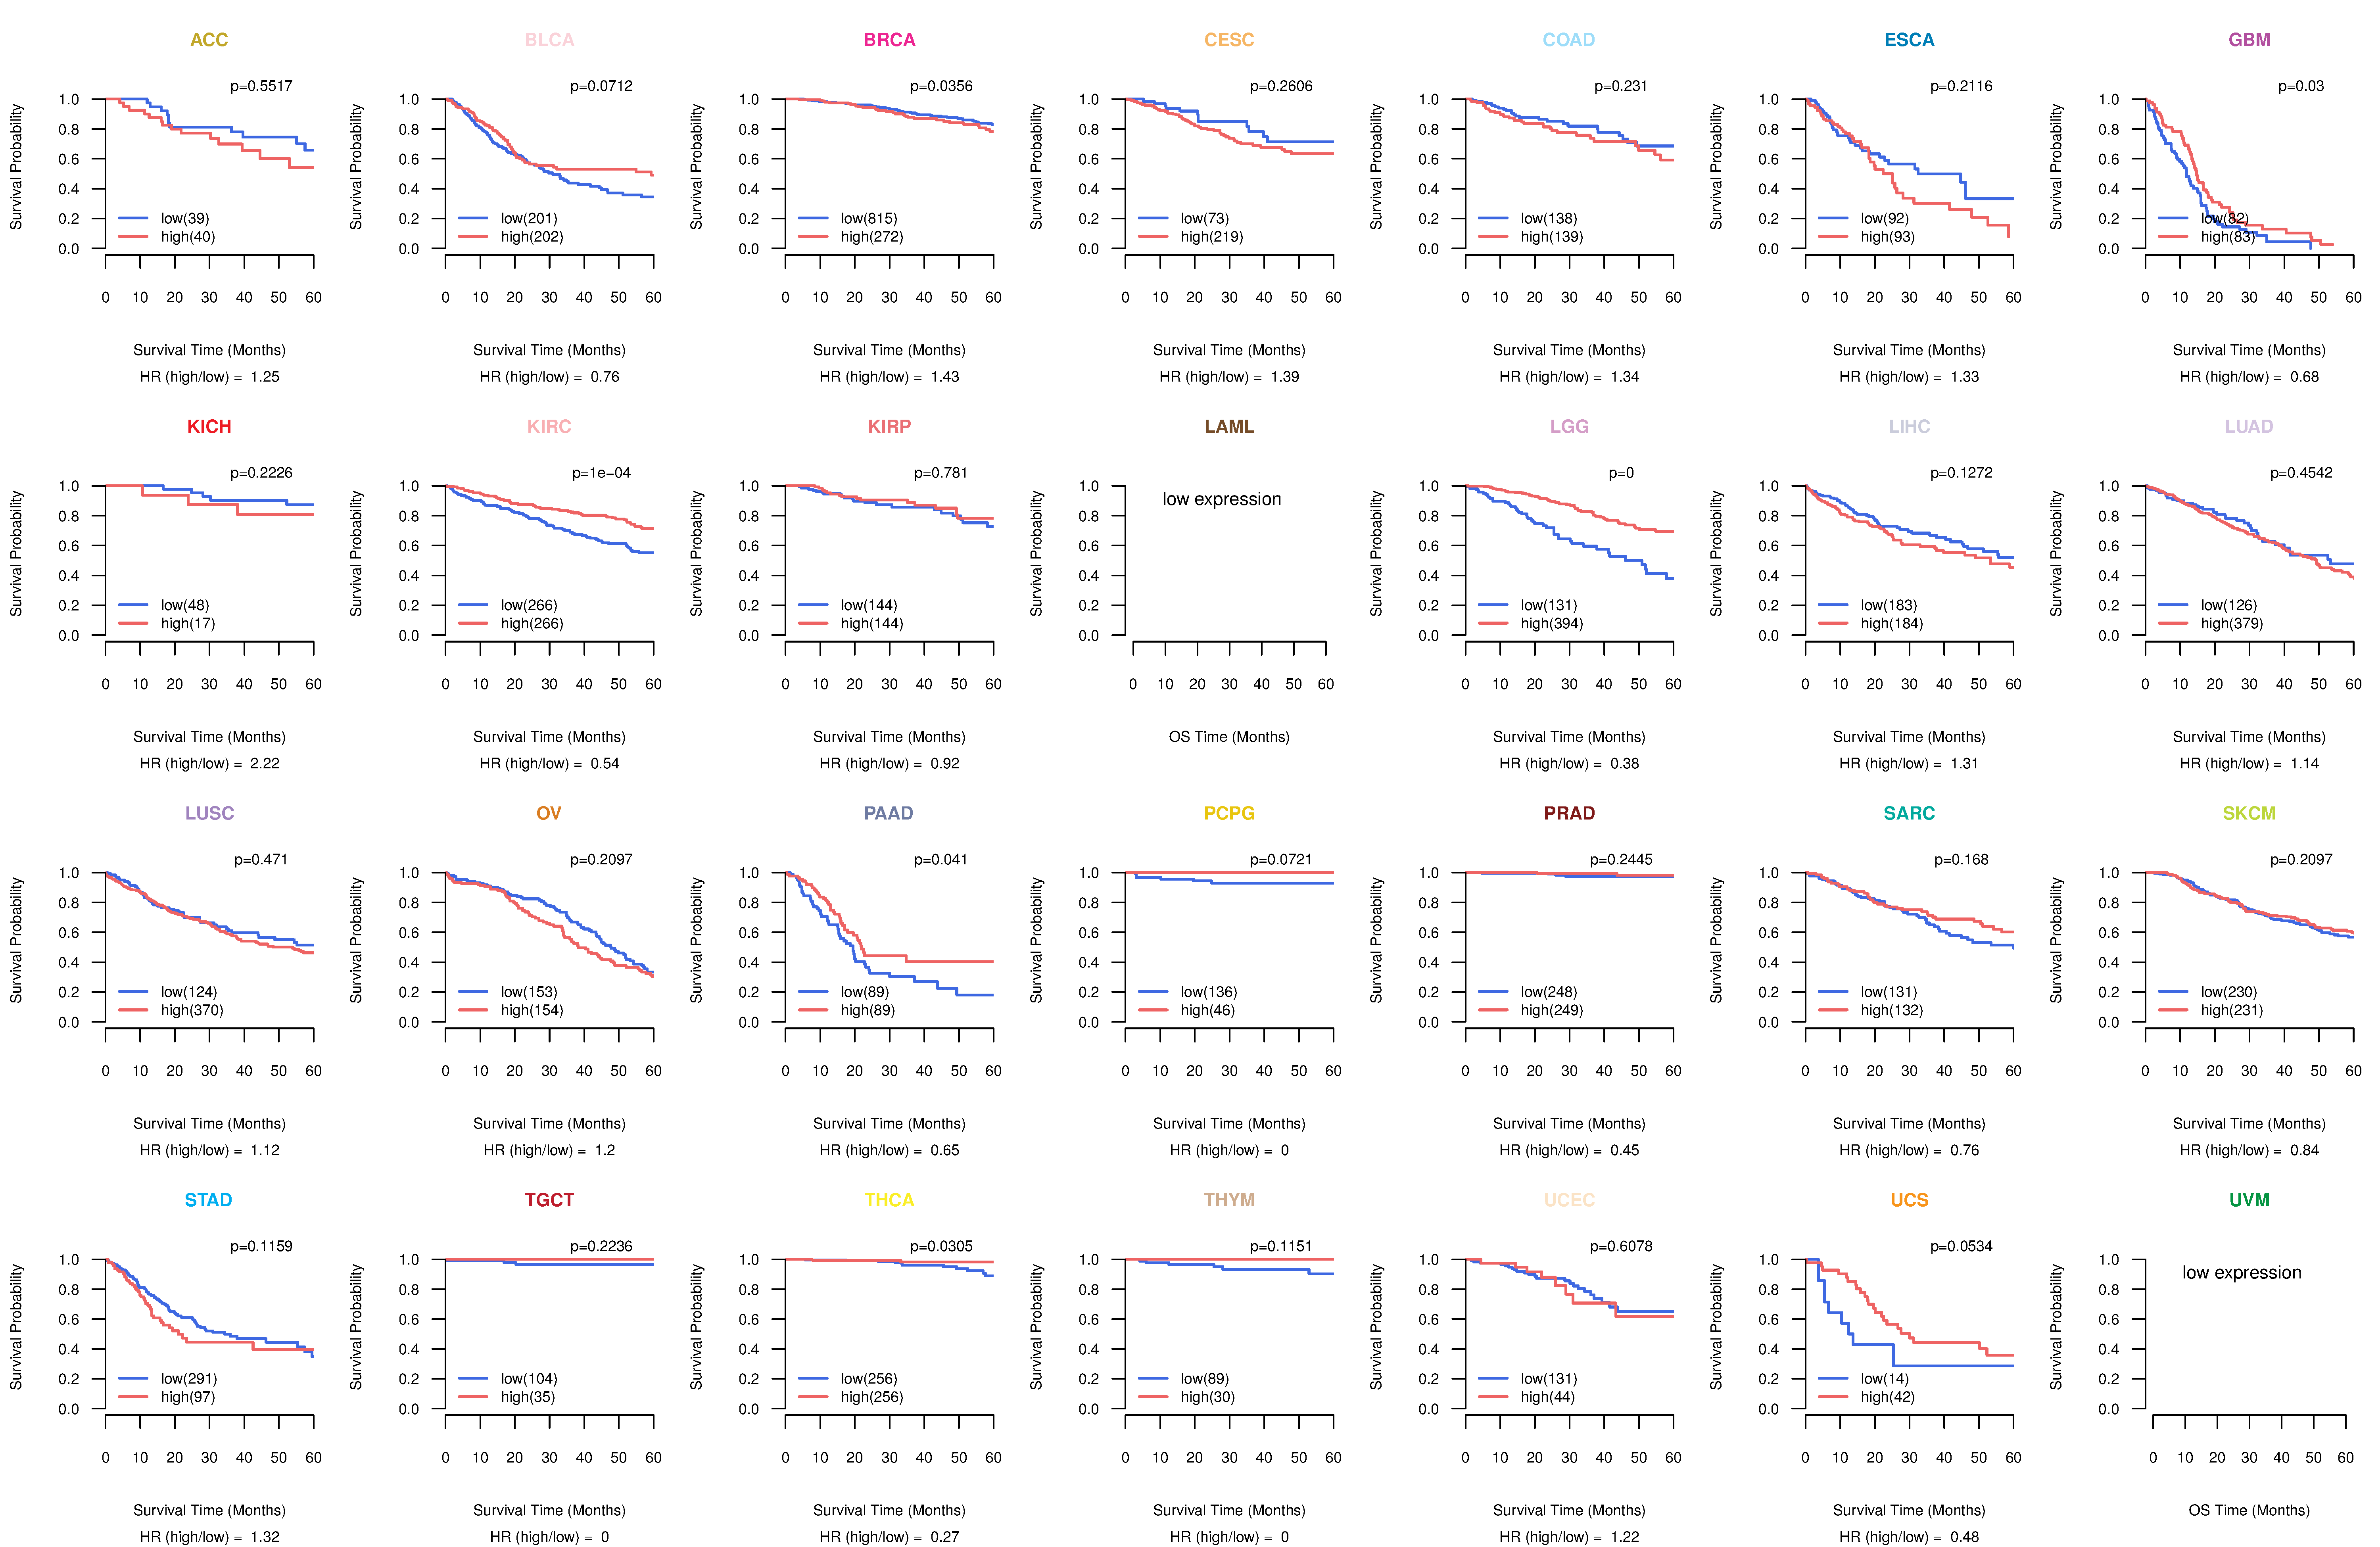
| Kaplan-Meier plots with logrank tests of overall survival (OS) using 28 cancer types (TCGA IlluminaHiSeq_RNASeqV2, pan-cancer normalized log2(norm_counts+1) data, version 2016-08-16) (TCGA clinicalMatrix, phenotype data, version 2016-04-27) * Click on the image to enlarge it in a new window. |
 |
| Kaplan-Meier plots with logrank test of relapse free survival (RFS) using 28 cancer types (TCGA IlluminaHiSeq_RNASeqV2, pan-cancer normalized log2(norm_counts+1) data, version 2016-08-16) (TCGA clinicalMatrix, phenotype data, version 2016-04-27) * Click on the image enlarge it in a new window. |
 |
| Forest plot of Cox proportional hazard ratio (HR) and 95% CI of overall survival (OS) using 28 cancer types (TCGA IlluminaHiSeq_RNASeqV2, pan-cancer normalized log2(norm_counts+1) data, version 2016-08-16) (TCGA clinicalMatrix, phenotype data, version 2016-04-27) * Click on the image enlarge it in a new window. |
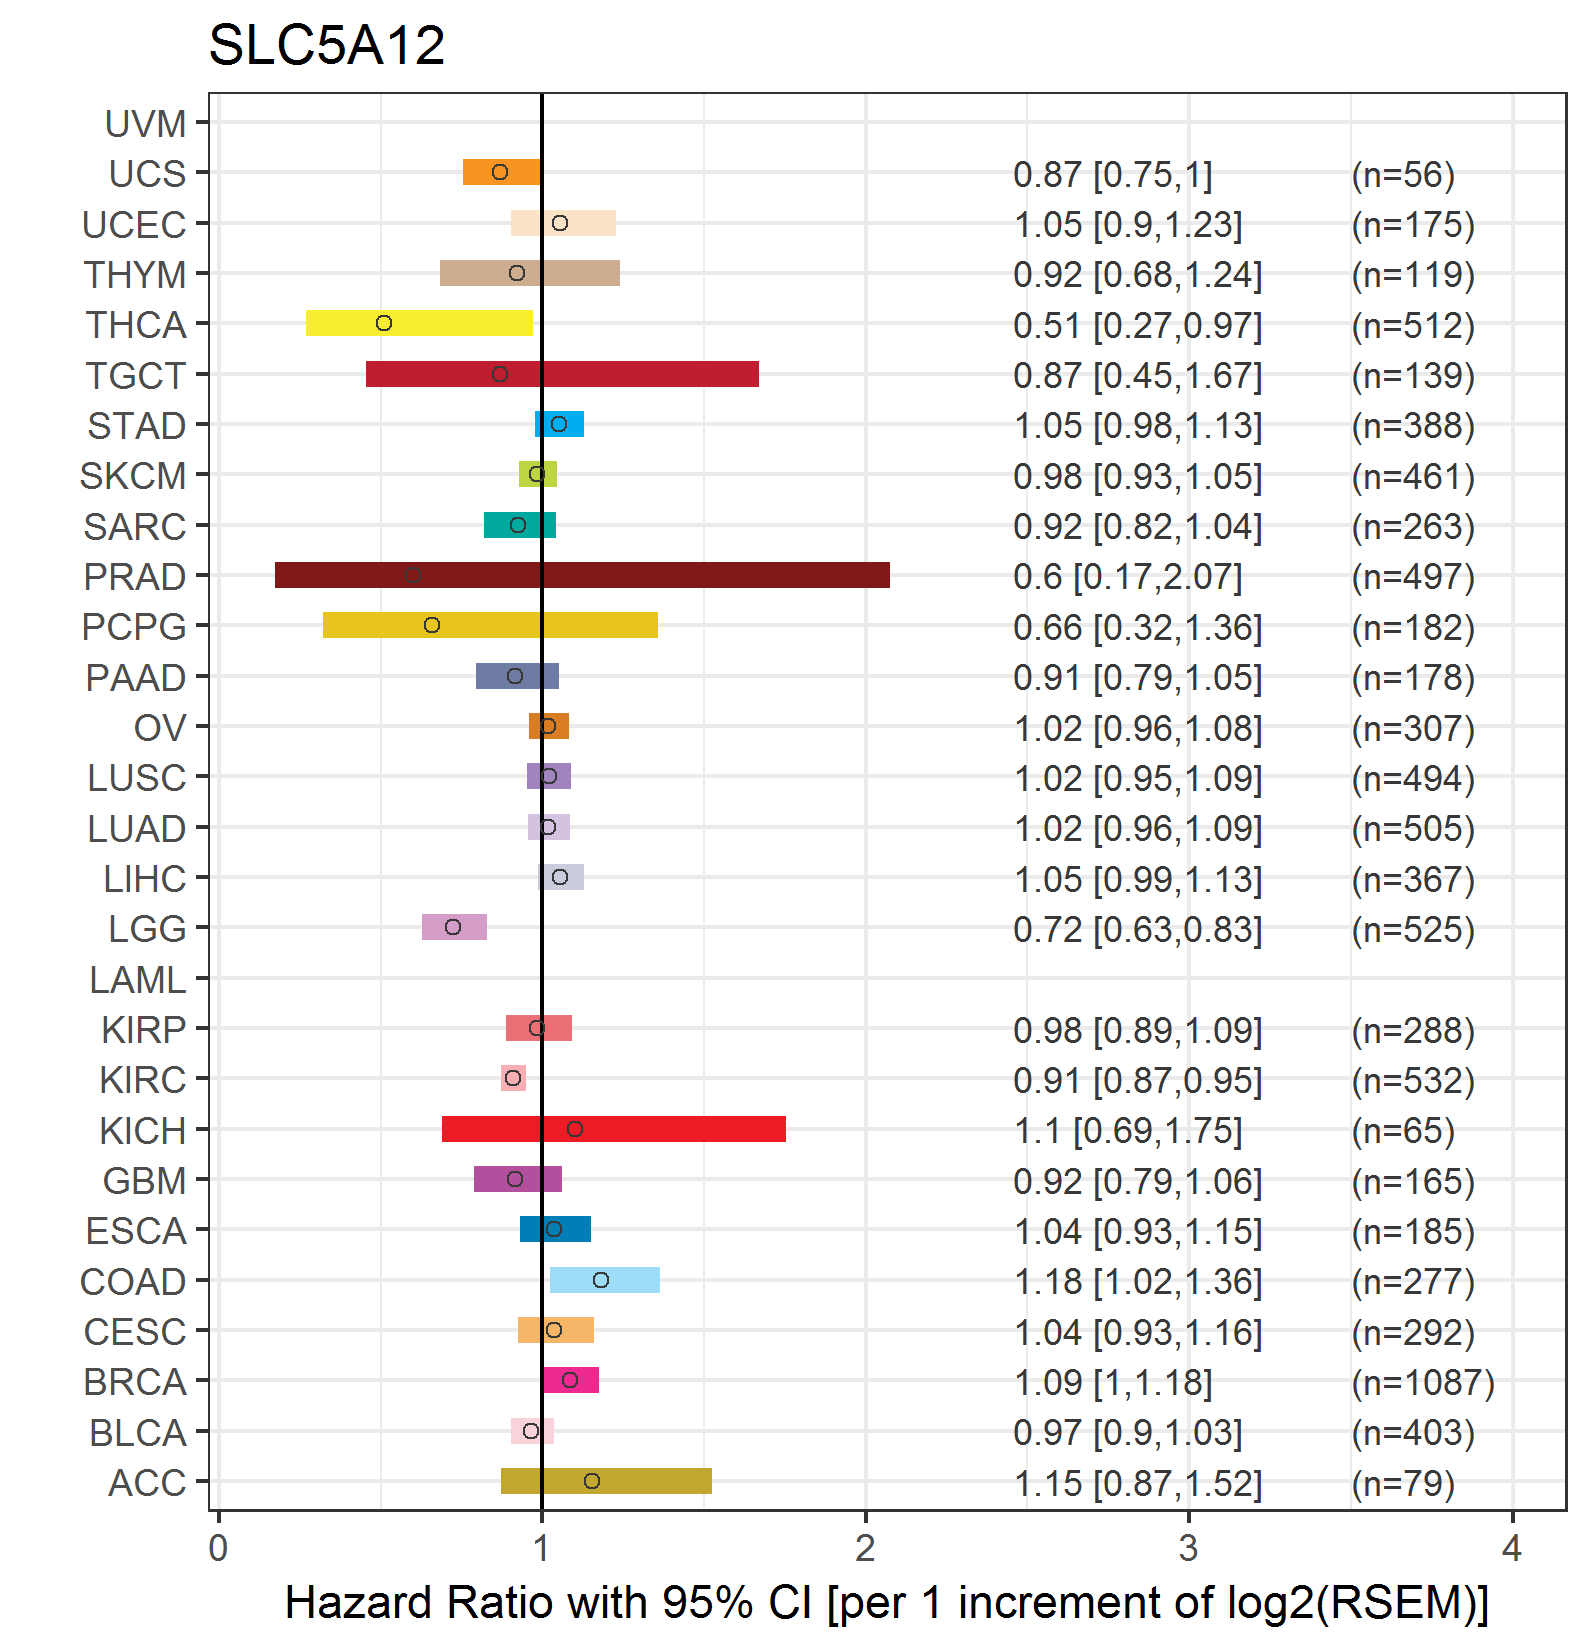 |
| Forest plot of Cox proportional hazard ratio (HR) and 95% CI of relapse free survival (RFS) using 28 cancer types (TCGA IlluminaHiSeq_RNASeqV2, pan-cancer normalized log2(norm_counts+1) data, version 2016-08-16) (TCGA clinicalMatrix, phenotype data, version 2016-04-27) * Click on the image enlarge it in a new window. |
 |
| Top |
| TissGeneClin for SLC5A12 |
| TissGeneDrug for SLC5A12 |
| Drug information targeting TissGene (DrugBank Version 5.0.6, 2017-04-01) |
| DrugBank ID | Drug name | Drug activity | Drug type | Drug status |
| Top |
| TissGeneDisease for SLC5A12 |
| Disease information associated with TissGene (DisGeNet, 2016-06-01) |
| Disease ID | Disease name | # pubmeds | Source |
| umls:C0004096 | Asthma | 1 | GAD |
| umls:C0021655 | Insulin Resistance | 1 | GAD |
|
Copyright 2016-Present - The University of Texas Health Science Center at Houston (UTHealth) Web File Viewing | How to Report, Fraud, Waste and Abuse | State of Texas | Statewide Search | Texas Homeland Security | Site Policies |