 |
| |
| |
| |
| |
| |
| |
|

| TissGeneSummary for ADAD2 |
 Gene summary Gene summary |
| Basic gene information | Gene symbol | ADAD2 |
| Gene name | adenosine deaminase domain containing 2 | |
| Synonyms | TENRL | |
| Cytomap | UCSC genome browser: 16q24.1 | |
| Type of gene | protein-coding | |
| RefGenes | NM_001145400.1, NM_139174.3, | |
| Description | adenosine deaminase domain-containing protein 2 | |
| Modification date | 20141207 | |
| dbXrefs | HGNC : HGNC | |
| Ensembl : ENSG00000140955 | ||
| HPRD : 14107 | ||
| Vega : OTTHUMG00000137637 | ||
| Protein | UniProt: go to UniProt's Cross Reference DB Table | |
| Expression | CleanEX: HS_ADAD2 | |
| BioGPS: 161931 | ||
| Pathway | NCI Pathway Interaction Database: ADAD2 | |
| KEGG: ADAD2 | ||
| REACTOME: ADAD2 | ||
| Pathway Commons: ADAD2 | ||
| Context | iHOP: ADAD2 | |
| ligand binding site mutation search in PubMed: ADAD2 | ||
| UCL Cancer Institute: ADAD2 | ||
| Assigned class in TissGDB* | C | |
| Included tissue-specific gene expression resources | HPA,GTEx | |
| Specific-tissues in normal samples (assigned by TissGDB using HPA, TiGER, and GTEx) | Testis | |
| Cancer types related to the specific-tissues in cancer samples (assigned by TissGDB using TCGA) | TGCT | |
| Reference showing the relevant tissue of ADAD2 | ||
| Description by TissGene annotations | ||
| * Class A consists of genes with literature evidence and is part of the cTissGenes. Class B consists of only cTissGenes without additional evidence. The remaining genes belong to Class C. |
| Gene ontology having evidence of Inferred from Direct Assay (IDA) from Entrez |
| GO ID | GO term | PubMed ID |
| Top |
| TissGeneExp for ADAD2 |
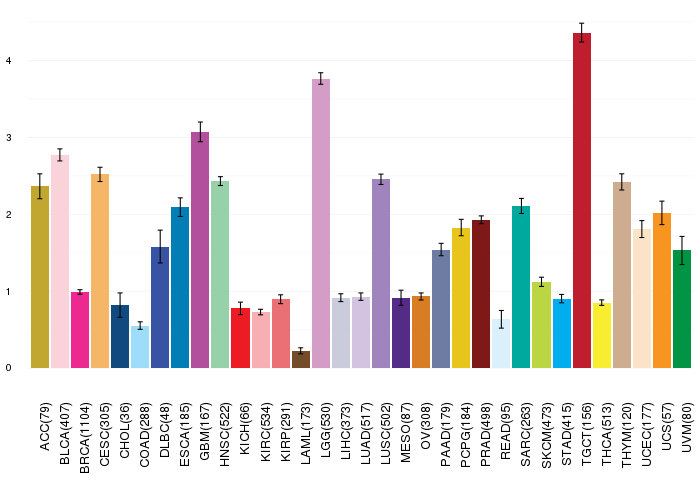
| Gene expressions across 28 cancer types (X-axis: cancer type and Y-axis: log2(norm_counts+1)) (TCGA IlluminaHiSeq_RNASeqV2, pan-cancer normalized log2(norm_counts+1) data, version 2016-08-16) |
 |
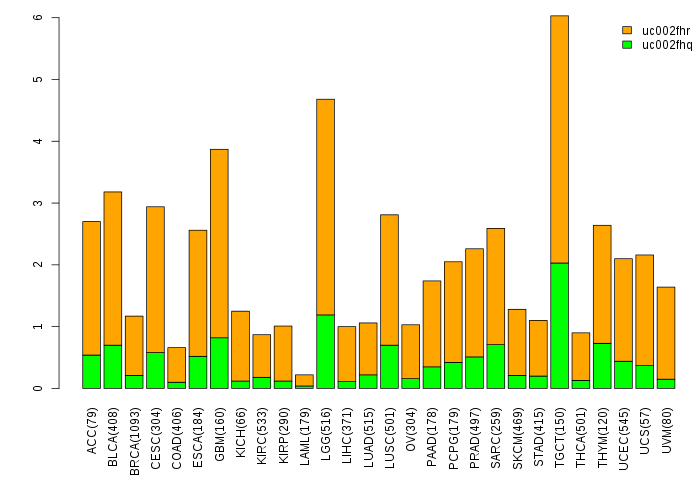
| Gene isoform expressions across 28 cancer types (X-axis: cancer type and Y-axis: log2(norm_counts+1)) (TCGA pan-cancer tcga_rsem_isoform_tpm, version 2016-09-01) |
 |
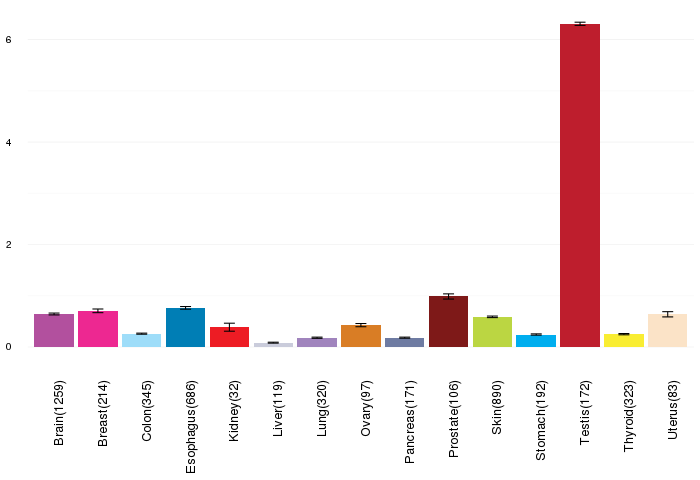
| Gene expressions across normal tissues of GTEx data (GTEx GTEx_Analysis_v6_RNA-seq_RNA-SeQCv1.1.8_gene_rpkm.gct) - Here, we shows the matched tissue types only among our 28 cancer types. |
 |
| Different expressions across 14 cancer types with more than 10 samples between matched tumors and normals (X-axis: cancer type and Y-axis: log2(norm_counts+1)) (TCGA IlluminaHiSeq_RNASeqV2, pan-cancer normalized log2(norm_counts+1) data, version 2016-08-16) |
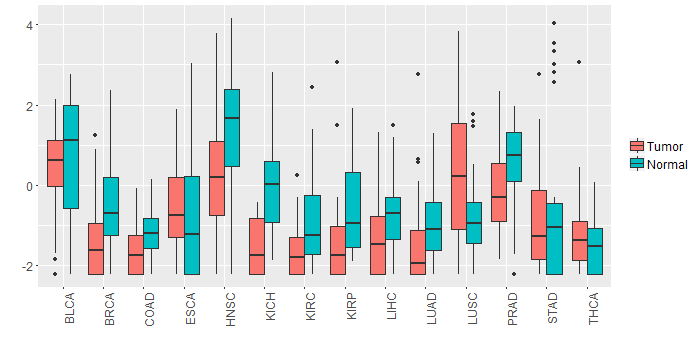 |
| - Significantly differentially expressed cancer types and information. (|Fold change|>1 and FDR<0.05) |
| Cancer type | Mean(exp) in tumor | Mean(exp) in matched normal | Log2FC | P-val. | FDR |
| KICH | -1.53929674 | -0.15706474 | -1.382232 | 4.49E-06 | 1.51E-05 |
| HNSC | 0.292644749 | 1.406009865 | -1.113365116 | 0.000401 | 0.001537053 |
| LUSC | 0.261989299 | -0.835830308 | 1.097819608 | 5.42E-05 | 0.000115367 |
| Top |
| TissGene-miRNA for ADAD2 |
| Significantly anti-correlated miRNAs of TissGene across 28 cancer types (Gene-miRNA relations from TargetScanHuman Relsease 7.1, Conserved_Site_Context_Scores.txt.zip, 06.01.2016) (TCGA IlluminaHiSeq_miRNASeq, log2(RPM+1) data, version 2016-11-21) (TCGA IlluminaHiSeq_RNASeqV2, log2(normalized_count+1) data, version 2016-08-16) (Spearman’s Rank Correlation (p-value<0.05 and coefficient<-0.25)) |
| Cancer type | miRNA id | miRNA accession | P-val. | Coeff. | # samples |
| Top |
| TissGeneMut for ADAD2 |
| TissGeneSNV for ADAD2 |
| nsSNV counts per each loci. Different colors of circles represent different cancer types. Circle size denotes number of samples. (TCGA somatic mutation (SNPs and small INDELs) data, version 2016-04-25) * Click on the image to enlarge it in a new window. |
 |
 |
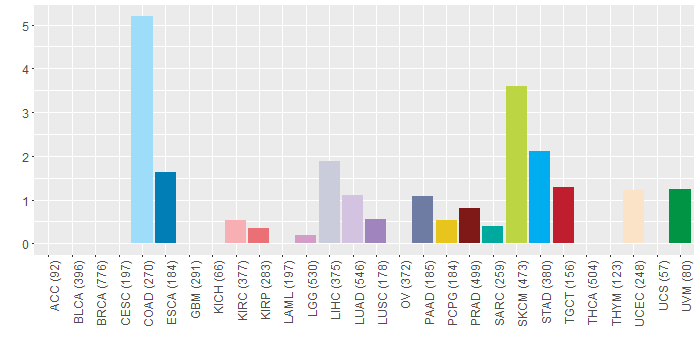
| Somatic nucleotide variants of TissGene across 28 cancer types (X-axis: cancer type and Y-axis: % of mutated samples) The numbers in parentheses are numbers of samples with mutation (nsSNVs). (TCGA somatic mutation (SNPs and small INDELs) data, version 2016-04-25) |
 |
| - nsSNVs sorted by frequency. |
| AAchange | Cancer type | # samples |
| p.G44E | COAD | 11 |
| p.G44E | READ | 5 |
| p.A545T | PRAD | 2 |
| p.P443L | STAD | 1 |
| p.R517H | COAD | 1 |
| p.P29L | SKCM | 1 |
| p.E327K | SKCM | 1 |
| p.S438L | SKCM | 1 |
| p.A54V | STAD | 1 |
| p.G513R | SKCM | 1 |
| p.A233V | PAAD | 1 |
| p.E558K | UVM | 1 |
| p.G484D | SKCM | 1 |
| p.A20T | SKCM | 1 |
| p.P361L | STAD | 1 |
| p.L622R | LUAD | 1 |
| p.V382L | HNSC | 1 |
| p.R174C | COAD | 1 |
| p.C351Y | LIHC | 1 |
| p.F609L | LIHC | 1 |
| p.T478P | LUAD | 1 |
| p.V616A | KIRC | 1 |
| p.G235R | COAD | 1 |
| p.G406R | PRAD | 1 |
| p.L341Q | KIRP | 1 |
| p.R614M | ESCA | 1 |
| p.A48V | SKCM | 1 |
| p.V415F | KIRC | 1 |
| p.G617R | SKCM | 1 |
| p.E152K | SKCM | 1 |
| p.S512L | SKCM | 1 |
| p.S422G | LIHC | 1 |
| p.A161V | PAAD | 1 |
| p.V542I | STAD | 1 |
| p.S218L | DLBC | 1 |
| p.P216S | SKCM | 1 |
| p.R170K | SKCM | 1 |
| p.P45T | LUSC | 1 |
| p.W485* | SKCM | 1 |
| p.R204C | READ | 1 |
| p.V464M | PAAD | 1 |
| p.G566D | SKCM | 1 |
| p.G595R | SKCM | 1 |
| p.R599H | SARC | 1 |
| p.R430H | UCEC | 1 |
| p.S504N | LUAD | 1 |
| p.E256D | UCEC | 1 |
| p.R283H | ESCA | 1 |
| p.A522V | STAD | 1 |
| p.V588E | LIHC | 1 |
| p.P391S | LIHC | 1 |
| p.L507F | SKCM | 1 |
| p.V580I | SKCM | 1 |
| p.G307E | SKCM | 1 |
| p.V616A | LIHC | 1 |
| p.V498I | SKCM | 1 |
| p.V382M | PAAD | 1 |
| p.R505H | COAD | 1 |
| p.A400V | STAD | 1 |
| p.A270P | UCEC | 1 |
| p.P323T | LUAD | 1 |
| p.A230V | TGCT | 1 |
| p.K16R | PCPG | 1 |
| p.G219S | READ | 1 |
| p.D180Y | LUAD | 1 |
| p.L248F | SKCM | 1 |
| p.K16R | LUAD | 1 |
| p.P597L | SKCM | 1 |
| p.T232I | UCEC | 1 |
| p.A207T | TGCT | 1 |
| p.L540R | LUAD | 1 |
| p.S422N | LUAD | 1 |
| p.G150R | LIHC | 1 |
| p.A310V | ESCA | 1 |
| p.G347S | LGG | 1 |
| p.V460I | STAD | 1 |
| p.D565G | READ | 1 |
| p.E558K | STAD | 1 |
| p.W43* | SKCM | 1 |
| p.R607Q | PRAD | 1 |
| p.V464L | HNSC | 1 |
| p.R33Q | STAD | 1 |
| p.P34L | STAD | 1 |
| p.T560P | LUAD | 1 |
| Top |
| TissGeneCNV for ADAD2 |
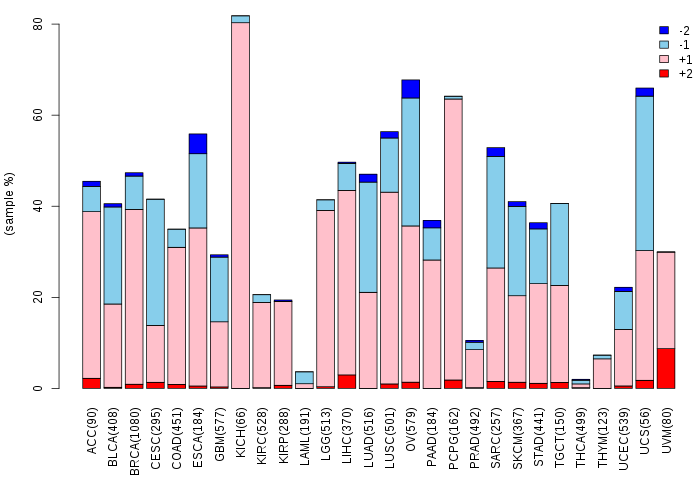
| Copy number variations of TissGene across 28 cancer types (X-axis: cancer type and Y-axis: % of CNV samples) (TCGA Gistic2_CopyNumber_Gistic2_all_data_by_genes, Gistic2 copy number data, version 2016-08-16) |
 |
| Top |
| TissGeneFusions for ADAD2 |
| Fusion genes including TissGene (ChimerDB 3.0, 2016-12-01 and TCGA fusion Portal 2015-12-01) |
| Database | Src | Cancer type | Sample | Fusion gene | ORF | 5'-gene BP | 3'-gene BP |
| Top |
| TissGeneNet for ADAD2 |
| Co-expressed gene networks based on protein-protein interaction data (CePIN) (TCGA IlluminaHiSeq_RNASeqV2, pan-cancer normalized log2(norm_counts+1) data, version 2016-08-16) (PINA2 ppi data) |
| Top |
| TissGeneProg for ADAD2 |
| Kaplan-Meier plots with logrank tests of overall survival (OS) using 28 cancer types (TCGA IlluminaHiSeq_RNASeqV2, pan-cancer normalized log2(norm_counts+1) data, version 2016-08-16) (TCGA clinicalMatrix, phenotype data, version 2016-04-27) * Click on the image to enlarge it in a new window. |
 |
| Kaplan-Meier plots with logrank test of relapse free survival (RFS) using 28 cancer types (TCGA IlluminaHiSeq_RNASeqV2, pan-cancer normalized log2(norm_counts+1) data, version 2016-08-16) (TCGA clinicalMatrix, phenotype data, version 2016-04-27) * Click on the image enlarge it in a new window. |
 |
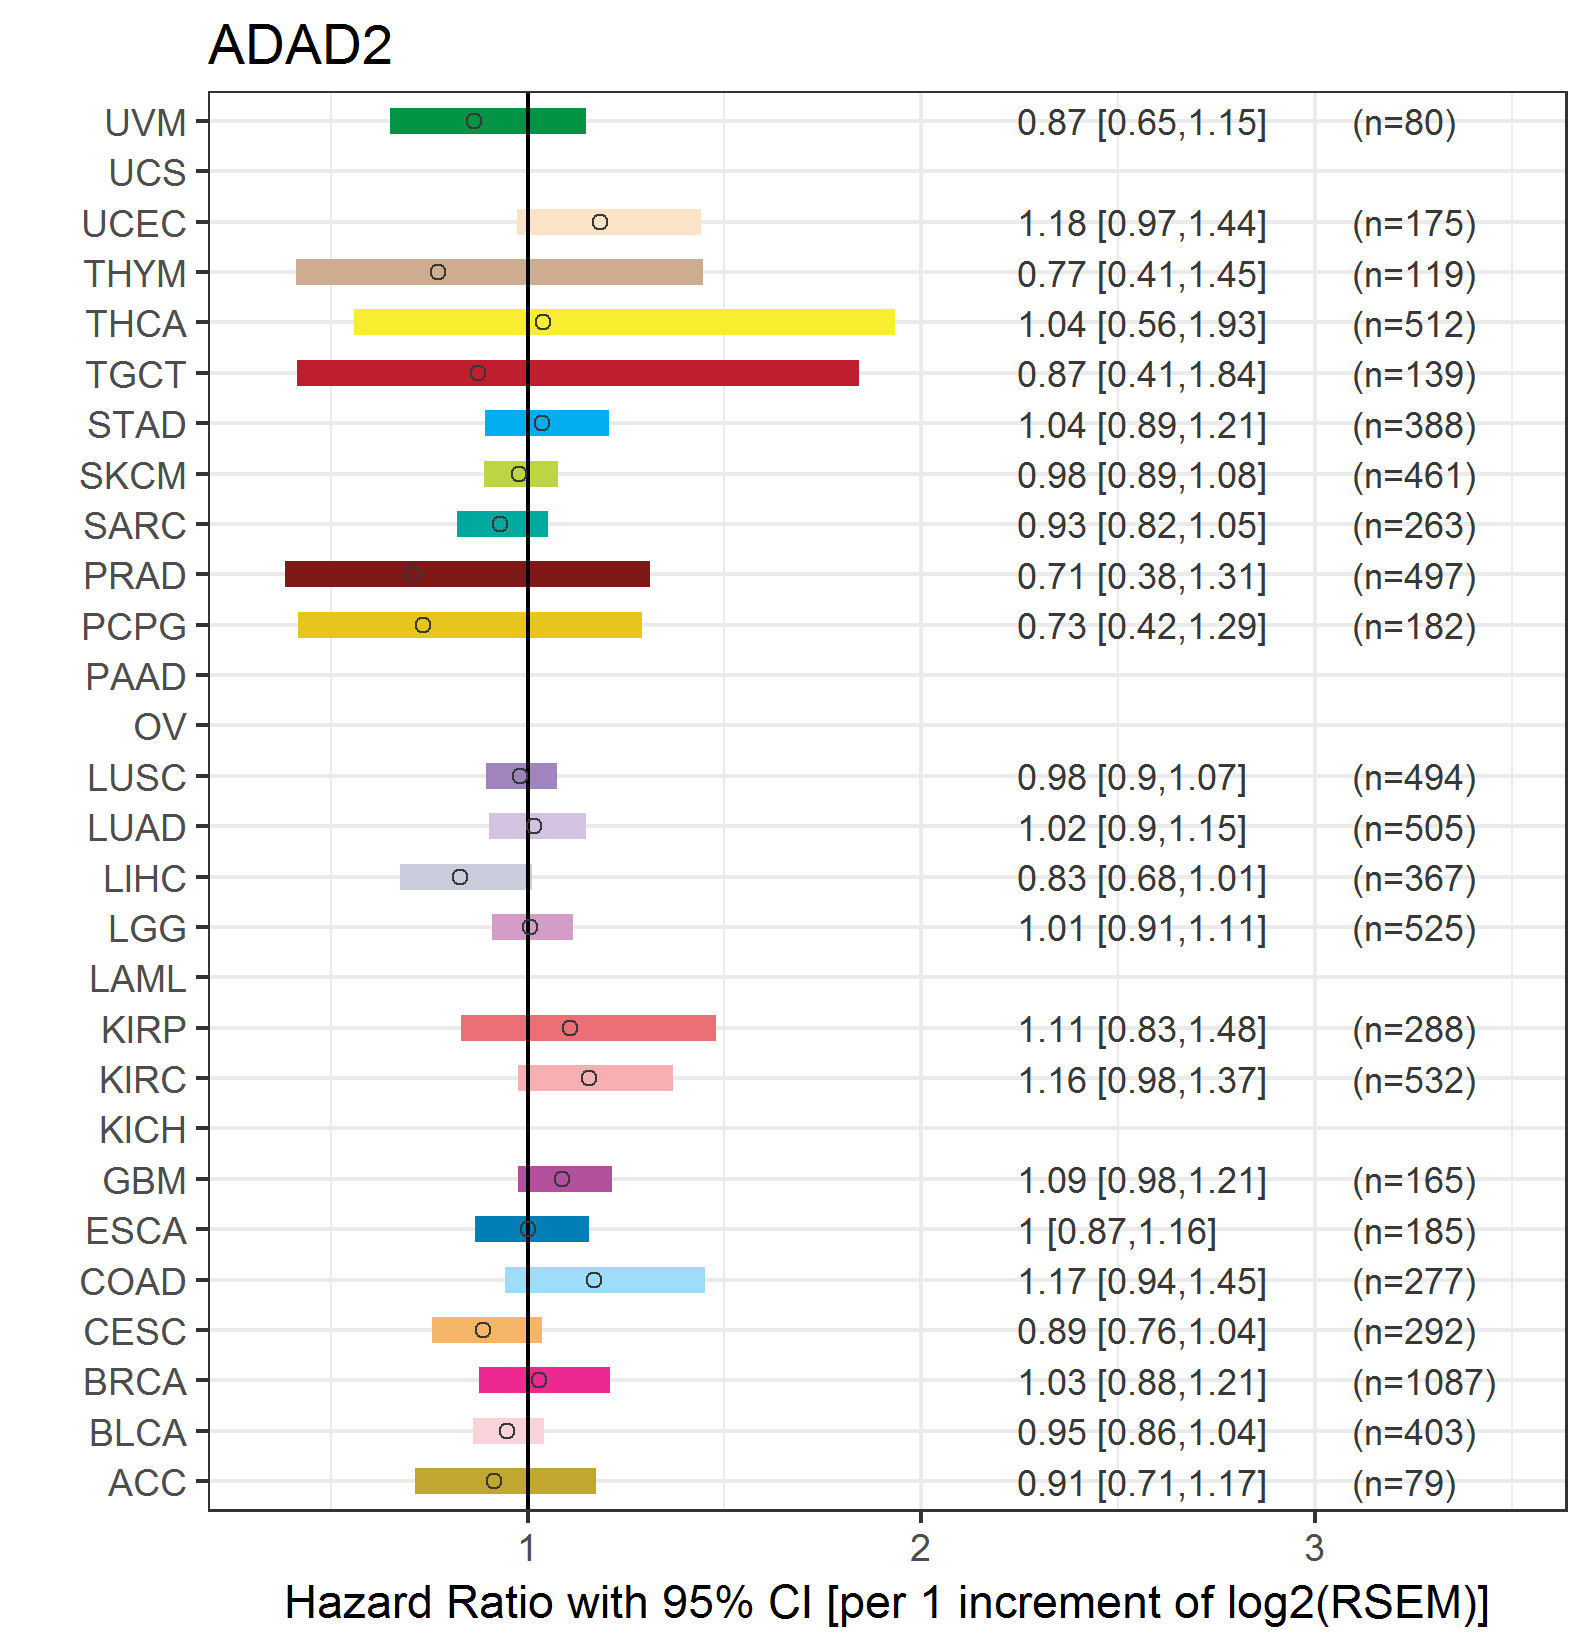
| Forest plot of Cox proportional hazard ratio (HR) and 95% CI of overall survival (OS) using 28 cancer types (TCGA IlluminaHiSeq_RNASeqV2, pan-cancer normalized log2(norm_counts+1) data, version 2016-08-16) (TCGA clinicalMatrix, phenotype data, version 2016-04-27) * Click on the image enlarge it in a new window. |
 |
| Forest plot of Cox proportional hazard ratio (HR) and 95% CI of relapse free survival (RFS) using 28 cancer types (TCGA IlluminaHiSeq_RNASeqV2, pan-cancer normalized log2(norm_counts+1) data, version 2016-08-16) (TCGA clinicalMatrix, phenotype data, version 2016-04-27) * Click on the image enlarge it in a new window. |
 |
| Top |
| TissGeneClin for ADAD2 |
| TissGeneDrug for ADAD2 |
| Drug information targeting TissGene (DrugBank Version 5.0.6, 2017-04-01) |
| DrugBank ID | Drug name | Drug activity | Drug type | Drug status |
| Top |
| TissGeneDisease for ADAD2 |
| Disease information associated with TissGene (DisGeNet, 2016-06-01) |
| Disease ID | Disease name | # pubmeds | Source |
|
Copyright 2016-Present - The University of Texas Health Science Center at Houston (UTHealth) Web File Viewing | How to Report, Fraud, Waste and Abuse | State of Texas | Statewide Search | Texas Homeland Security | Site Policies |