 |
| |
| |
| |
| |
| |
| |
|

| TissGeneSummary for MARCH10 |
 Gene summary Gene summary |
| Basic gene information | Gene symbol | MARCH10 |
| Gene name | membrane-associated ring finger (C3HC4) 10, E3 ubiquitin protein ligase | |
| Synonyms | MARCH-X|RNF190 | |
| Cytomap | UCSC genome browser: 17q23.2 | |
| Type of gene | protein-coding | |
| RefGenes | NM_001100875.2, NM_001288779.1,NM_001288780.1,NM_152598.3, | |
| Description | membrane-associated RING finger protein 10membrane-associated RING-CH protein Xprobable E3 ubiquitin-protein ligase MARCH10ring finger protein 190 | |
| Modification date | 20141207 | |
| dbXrefs | MIM : 613337 | |
| HGNC : HGNC | ||
| Ensembl : ENSG00000173838 | ||
| HPRD : 08762 | ||
| Vega : OTTHUMG00000179192 | ||
| Protein | UniProt: go to UniProt's Cross Reference DB Table | |
| Expression | CleanEX: HS_MARCH10 | |
| BioGPS: 162333 | ||
| Pathway | NCI Pathway Interaction Database: MARCH10 | |
| KEGG: MARCH10 | ||
| REACTOME: MARCH10 | ||
| Pathway Commons: MARCH10 | ||
| Context | iHOP: MARCH10 | |
| ligand binding site mutation search in PubMed: MARCH10 | ||
| UCL Cancer Institute: MARCH10 | ||
| Assigned class in TissGDB* | B | |
| Included tissue-specific gene expression resources | ||
| Specific-tissues in normal samples (assigned by TissGDB using HPA, TiGER, and GTEx) | Testis | |
| Cancer types related to the specific-tissues in cancer samples (assigned by TissGDB using TCGA) | TGCT | |
| Reference showing the relevant tissue of MARCH10 | ||
| Description by TissGene annotations | ||
| * Class A consists of genes with literature evidence and is part of the cTissGenes. Class B consists of only cTissGenes without additional evidence. The remaining genes belong to Class C. |
| Gene ontology having evidence of Inferred from Direct Assay (IDA) from Entrez |
| GO ID | GO term | PubMed ID |
| Top |
| TissGeneExp for MARCH10 |
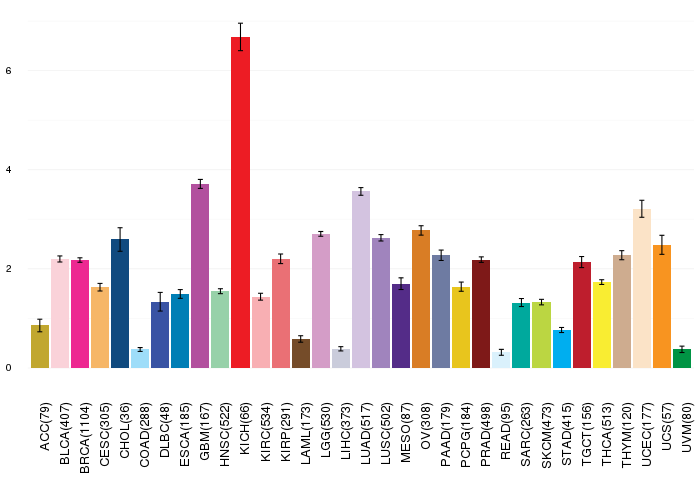
| Gene expressions across 28 cancer types (X-axis: cancer type and Y-axis: log2(norm_counts+1)) (TCGA IlluminaHiSeq_RNASeqV2, pan-cancer normalized log2(norm_counts+1) data, version 2016-08-16) |
 |
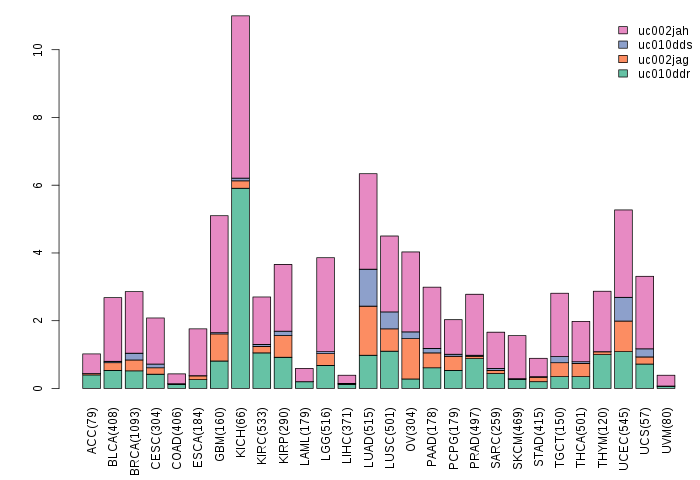
| Gene isoform expressions across 28 cancer types (X-axis: cancer type and Y-axis: log2(norm_counts+1)) (TCGA pan-cancer tcga_rsem_isoform_tpm, version 2016-09-01) |
 |
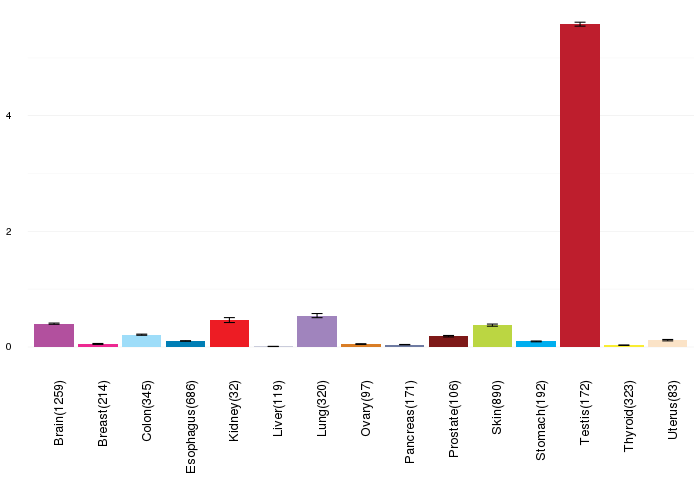
| Gene expressions across normal tissues of GTEx data (GTEx GTEx_Analysis_v6_RNA-seq_RNA-SeQCv1.1.8_gene_rpkm.gct) - Here, we shows the matched tissue types only among our 28 cancer types. |
 |
| Different expressions across 14 cancer types with more than 10 samples between matched tumors and normals (X-axis: cancer type and Y-axis: log2(norm_counts+1)) (TCGA IlluminaHiSeq_RNASeqV2, pan-cancer normalized log2(norm_counts+1) data, version 2016-08-16) |
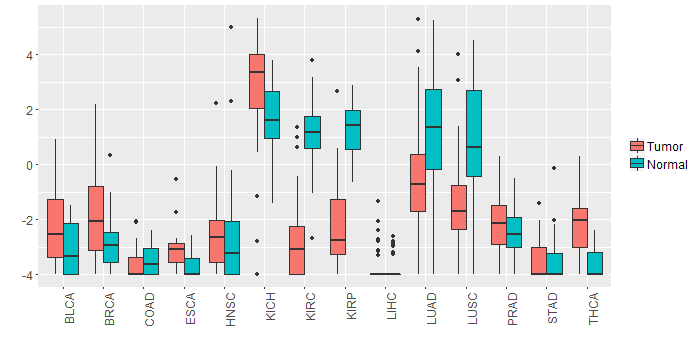 |
| - Significantly differentially expressed cancer types and information. (|Fold change|>1 and FDR<0.05) |
| Cancer type | Mean(exp) in tumor | Mean(exp) in matched normal | Log2FC | P-val. | FDR |
| LUSC | -1.449338987 | 0.845317876 | -2.294656863 | 8.76E-08 | 2.48E-07 |
| KIRP | -2.163178631 | 1.305521369 | -3.4687 | 9.26E-15 | 2.36E-13 |
| THCA | -2.190525294 | -3.584755803 | 1.394230508 | 2.31E-13 | 2.29E-12 |
| BRCA | -1.890042392 | -2.941663445 | 1.051621053 | 6.24E-10 | 2.26E-09 |
| KIRC | -2.798618562 | 1.17259116 | -3.971209722 | 2.12E-44 | 1.25E-42 |
| LUAD | -0.679184558 | 1.011663718 | -1.690848276 | 5.19E-05 | 0.000136313 |
| Top |
| TissGene-miRNA for MARCH10 |
| Significantly anti-correlated miRNAs of TissGene across 28 cancer types (Gene-miRNA relations from TargetScanHuman Relsease 7.1, Conserved_Site_Context_Scores.txt.zip, 06.01.2016) (TCGA IlluminaHiSeq_miRNASeq, log2(RPM+1) data, version 2016-11-21) (TCGA IlluminaHiSeq_RNASeqV2, log2(normalized_count+1) data, version 2016-08-16) (Spearman’s Rank Correlation (p-value<0.05 and coefficient<-0.25)) |
| Cancer type | miRNA id | miRNA accession | P-val. | Coeff. | # samples |
| Top |
| TissGeneMut for MARCH10 |
| TissGeneSNV for MARCH10 |
| nsSNV counts per each loci. Different colors of circles represent different cancer types. Circle size denotes number of samples. (TCGA somatic mutation (SNPs and small INDELs) data, version 2016-04-25) * Click on the image to enlarge it in a new window. |
 |
| Somatic nucleotide variants of TissGene across 28 cancer types (X-axis: cancer type and Y-axis: % of mutated samples) The numbers in parentheses are numbers of samples with mutation (nsSNVs). (TCGA somatic mutation (SNPs and small INDELs) data, version 2016-04-25) |
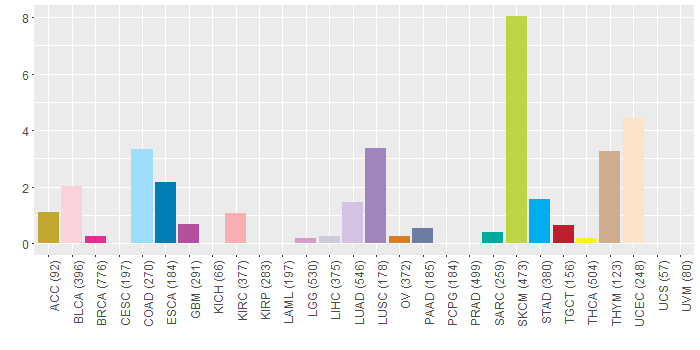 |
| - nsSNVs sorted by frequency. |
| AAchange | Cancer type | # samples |
| p.G240E | SKCM | 3 |
| p.E653K | SKCM | 2 |
| p.G241E | SKCM | 2 |
| p.S401L | SKCM | 2 |
| p.P485L | SKCM | 1 |
| p.S700L | BLCA | 1 |
| p.D380N | BLCA | 1 |
| p.G414A | SKCM | 1 |
| p.P42Q | LUAD | 1 |
| p.G794E | SKCM | 1 |
| p.S342C | BLCA | 1 |
| p.E286K | SKCM | 1 |
| p.V579F | UCEC | 1 |
| p.S152X | THYM | 1 |
| p.A178T | UCEC | 1 |
| p.R8S | GBM | 1 |
| p.D48N | READ | 1 |
| p.E538K | KIRC | 1 |
| p.S580* | ESCA | 1 |
| p.A77T | THYM | 1 |
| p.H607N | STAD | 1 |
| p.D488Y | BLCA | 1 |
| p.E336G | LUAD | 1 |
| p.P361T | LUAD | 1 |
| p.A131E | DLBC | 1 |
| p.L640F | STAD | 1 |
| p.H342Y | SKCM | 1 |
| p.S206L | UCEC | 1 |
| p.F319S | COAD | 1 |
| p.S311F | SKCM | 1 |
| p.E654K | SKCM | 1 |
| p.R316K | SKCM | 1 |
| p.G838R | SARC | 1 |
| p.E74K | BLCA | 1 |
| p.S227F | READ | 1 |
| p.P257T | TGCT | 1 |
| p.R19W | ESCA | 1 |
| p.Y29C | COAD | 1 |
| p.S570P | LUAD | 1 |
| p.L562F | SKCM | 1 |
| p.M583I | SKCM | 1 |
| p.P175S | SKCM | 1 |
| p.M476I | SKCM | 1 |
| p.E627K | SKCM | 1 |
| p.S278C | HNSC | 1 |
| p.E526K | STAD | 1 |
| p.P486L | SKCM | 1 |
| p.E626K | SKCM | 1 |
| p.R195M | PAAD | 1 |
| p.S252L | COAD | 1 |
| p.S402L | SKCM | 1 |
| p.G413A | SKCM | 1 |
| p.H590Y | UCEC | 1 |
| p.E538K | UCEC | 1 |
| p.S450Y | COAD | 1 |
| p.V172L | HNSC | 1 |
| p.E831K | SKCM | 1 |
| p.E199* | UCEC | 1 |
| p.P127S | SKCM | 1 |
| p.E393K | SKCM | 1 |
| p.E287K | SKCM | 1 |
| p.C658S | LUAD | 1 |
| p.P174S | SKCM | 1 |
| p.E54D | LGG | 1 |
| p.R760K | SKCM | 1 |
| p.E537K | SKCM | 1 |
| p.L33M | UCEC | 1 |
| p.K628X | KIRC | 1 |
| p.A170E | OV | 1 |
| p.H566R | LUSC | 1 |
| p.V487I | SKCM | 1 |
| p.L562I | UCEC | 1 |
| p.R47C | GBM | 1 |
| p.R315K | SKCM | 1 |
| p.G502R | LUAD | 1 |
| p.R617K | SKCM | 1 |
| p.S306L | SKCM | 1 |
| p.S353L | SKCM | 1 |
| p.Q758H | BLCA | 1 |
| p.S450Y | UCEC | 1 |
| p.V808I | ACC | 1 |
| p.S367Y | LUAD | 1 |
| p.S352L | SKCM | 1 |
| p.G240R | SKCM | 1 |
| p.S110I | KIRC | 1 |
| p.Q551E | BLCA | 1 |
| p.M582I | SKCM | 1 |
| p.G320W | STAD | 1 |
| p.R773K | SKCM | 1 |
| p.R40K | BRCA | 1 |
| p.E772Q | THYM | 1 |
| p.S277C | HNSC | 1 |
| p.Q22* | LGG | 1 |
| p.H341Y | SKCM | 1 |
| p.S73R | THCA | 1 |
| p.G716D | SKCM | 1 |
| p.G263A | KIRC | 1 |
| p.L639F | STAD | 1 |
| p.R372M | COAD | 1 |
| p.S402L | COAD | 1 |
| p.N789H | UCEC | 1 |
| p.R272Q | COAD | 1 |
| p.P636S | SKCM | 1 |
| p.A157T | SKCM | 1 |
| p.V846I | ACC | 1 |
| p.C377Y | UCEC | 1 |
| p.E526K | COAD | 1 |
| p.P636L | SKCM | 1 |
| p.M803I | LUSC | 1 |
| p.E44V | UCEC | 1 |
| p.G176E | SKCM | 1 |
| p.A156T | SKCM | 1 |
| p.Q227H | HNSC | 1 |
| p.D487Y | BLCA | 1 |
| p.E74K | LUSC | 1 |
| p.G241R | SKCM | 1 |
| p.P668Q | LUAD | 1 |
| p.L561F | SKCM | 1 |
| p.M112V | LUSC | 1 |
| p.F730L | UCEC | 1 |
| p.G502E | SKCM | 1 |
| p.R194M | PAAD | 1 |
| p.Q662E | HNSC | 1 |
| p.P97S | SKCM | 1 |
| p.S461Y | COAD | 1 |
| p.Q737* | SKCM | 1 |
| p.K406I | LIHC | 1 |
| p.G666V | SKCM | 1 |
| p.R35X | ESCA | 1 |
| p.G666E | SKCM | 1 |
| p.S322L | BLCA | 1 |
| p.R35* | ESCA | 1 |
| p.E757* | SKCM | 1 |
| p.D613N | SKCM | 1 |
| p.D41Y | COAD | 1 |
| p.S350R | LUAD | 1 |
| p.H428P | SKCM | 1 |
| p.V486I | SKCM | 1 |
| p.S349R | LUAD | 1 |
| p.F251L | READ | 1 |
| p.S64R | ESCA | 1 |
| p.F603L | UCEC | 1 |
| p.S368Y | LUAD | 1 |
| p.Q411K | STAD | 1 |
| p.S326R | LUSC | 1 |
| p.E674K | SKCM | 1 |
| p.V210L | LUSC | 1 |
| p.S235F | SKCM | 1 |
| p.R306H | THYM | 1 |
| p.P461A | BLCA | 1 |
| p.A369V | COAD | 1 |
| p.V171L | HNSC | 1 |
| p.G503E | SKCM | 1 |
| p.K171N | UCEC | 1 |
| p.E793K | SKCM | 1 |
| p.R759K | SKCM | 1 |
| p.G665E | SKCM | 1 |
| p.S343C | BLCA | 1 |
| p.M112T | STAD | 1 |
| p.E655K | BRCA | 1 |
| Top |
| TissGeneCNV for MARCH10 |
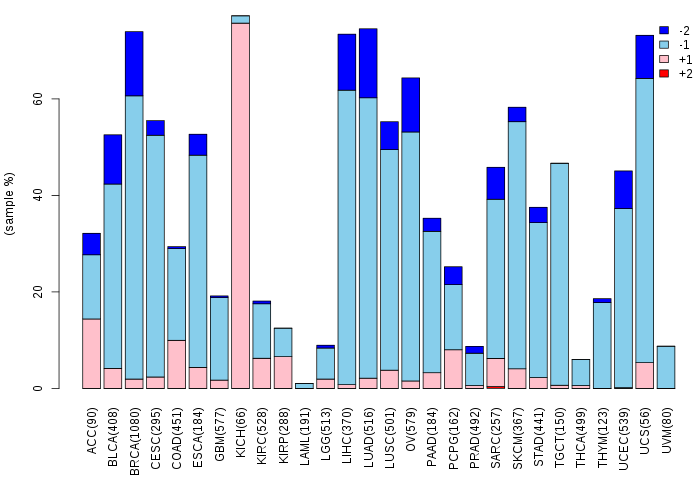
| Copy number variations of TissGene across 28 cancer types (X-axis: cancer type and Y-axis: % of CNV samples) (TCGA Gistic2_CopyNumber_Gistic2_all_data_by_genes, Gistic2 copy number data, version 2016-08-16) |
 |
| Top |
| TissGeneFusions for MARCH10 |
| Fusion genes including TissGene (ChimerDB 3.0, 2016-12-01 and TCGA fusion Portal 2015-12-01) |
| Database | Src | Cancer type | Sample | Fusion gene | ORF | 5'-gene BP | 3'-gene BP |
| Chimerdb3.0 | FusionScan | LUSC | TCGA-63-7023-01A | BCAS3-MARCH10 | In-Frame | chr17:59024713 | chr17:60837367 |
| Chimerdb3.0 | FusionScan | BRCA | TCGA-A8-A0AD-01A | MAPT-MARCH10 | Out-of-Frame | chr17:44039836 | chr17:60865960 |
| Chimerdb3.0 | FusionScan | BRCA | TCGA-AO-A0J5-01A | VMP1-MARCH10 | Out-of-Frame | chr17:57895134 | chr17:60788705 |
| TCGAfusionPortal | PRADA | BRCA | TCGA-A2-A0T7-01A | CUX1-MARCH10 | In-frame | Chr7:101459373 | Chr17:60837367 |
| TCGAfusionPortal | PRADA | BRCA | TCGA-A8-A0AD-01A | MAPT-MARCH10 | Out-of-frame | Chr17:44039836 | Chr17:60865960 |
| TCGAfusionPortal | PRADA | BRCA | TCGA-AO-A0J5-01A | VMP1-MARCH10 | Out-of-frame | Chr17:57895134 | Chr17:60788705 |
| TCGAfusionPortal | PRADA | BRCA | TCGA-C8-A1HI-01A | PITPNC1-MARCH10 | Out-of-frame | Chr17:65529066 | Chr17:60821889 |
| TCGAfusionPortal | PRADA | KIRC | TCGA-BP-4983-01A | DLG4-MARCH10 | CDS-5UTR | Chr17:7120437 | Chr17:60879113 |
| TCGAfusionPortal | PRADA | LUSC | TCGA-63-7023-01A | BCAS3-MARCH10 | In-frame | Chr17:59024713 | Chr17:60837367 |
| Top |
| TissGeneNet for MARCH10 |
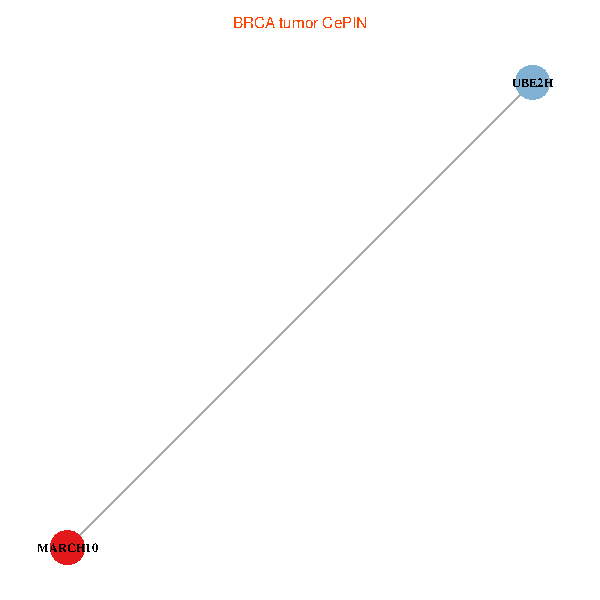
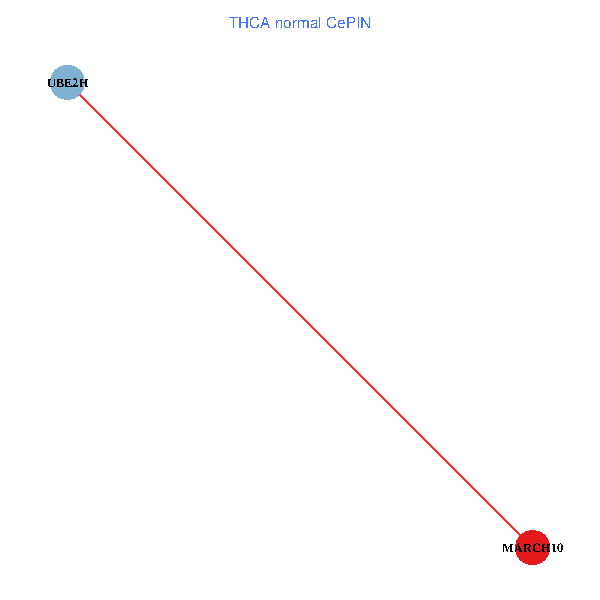
| Co-expressed gene networks based on protein-protein interaction data (CePIN) (TCGA IlluminaHiSeq_RNASeqV2, pan-cancer normalized log2(norm_counts+1) data, version 2016-08-16) (PINA2 ppi data) |
| BRCA (tumor) | BRCA (normal) |
| MARCH10, UBE2H (tumor) | MARCH10, UBE2H (normal) |
 |  |
| COAD (tumor) | COAD (normal) |
| MARCH10, UBE2H (tumor) | MARCH10, UBE2H (normal) |
 |  |
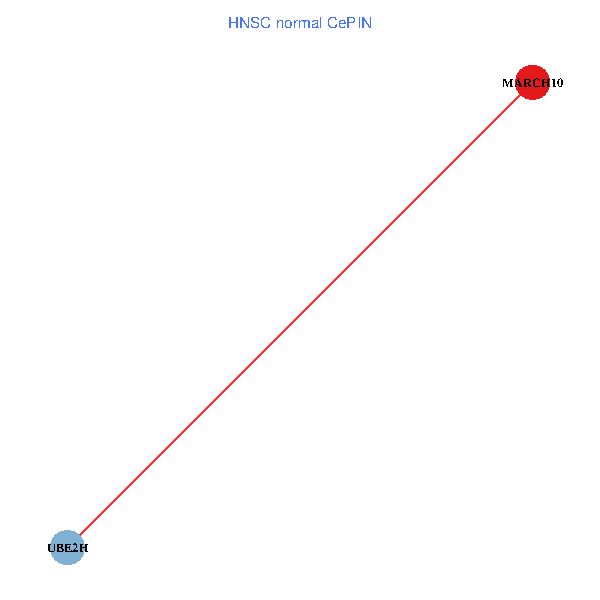
| HNSC (tumor) | HNSC (normal) |
| MARCH10, UBE2H (tumor) | MARCH10, UBE2H (normal) |
 |  |
| KICH (tumor) | KICH (normal) |
| MARCH10, UBE2H (tumor) | MARCH10, UBE2H (normal) |
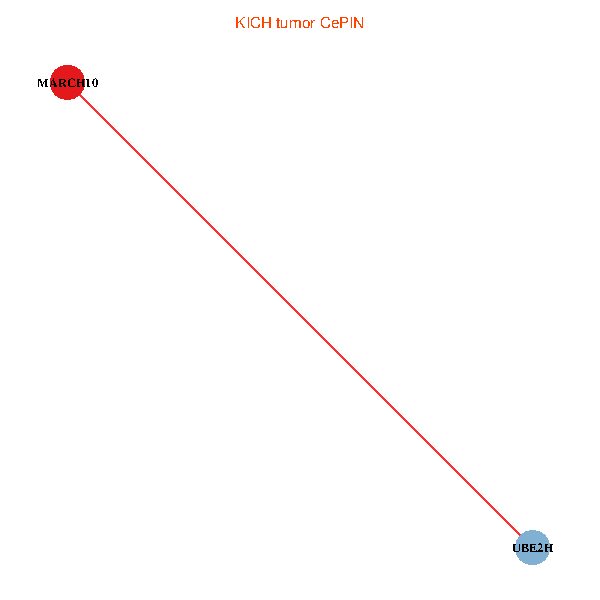 |  |
| KIRC (tumor) | KIRC (normal) |
| MARCH10, UBE2H (tumor) | MARCH10, UBE2H (normal) |
 |  |
| KIRP (tumor) | KIRP (normal) |
| MARCH10, UBE2H (tumor) | MARCH10, UBE2H (normal) |
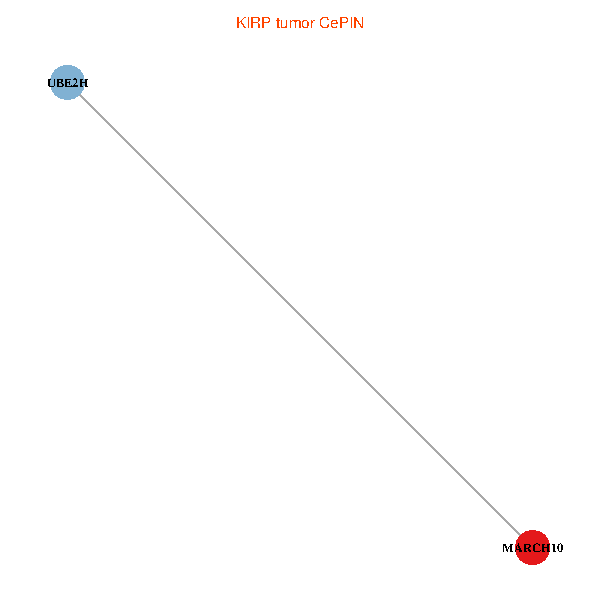 |  |
| LIHC (tumor) | LIHC (normal) |
| MARCH10, UBE2H (tumor) | MARCH10, UBE2H (normal) |
 |  |
| LUAD (tumor) | LUAD (normal) |
| MARCH10, UBE2H (tumor) | MARCH10, UBE2H (normal) |
 | 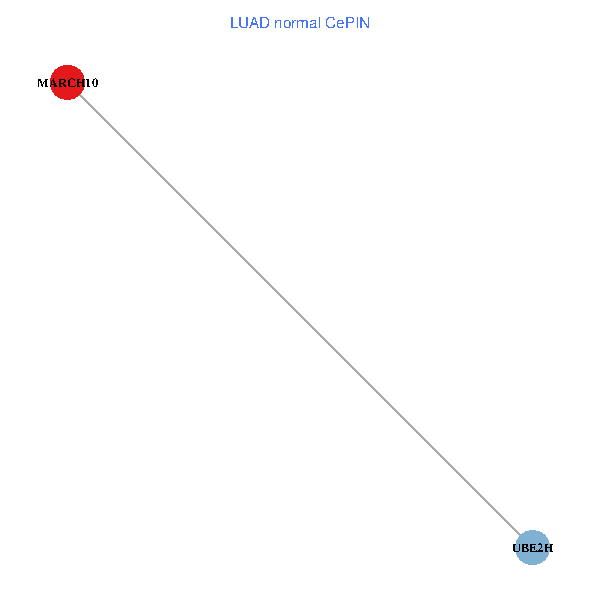 |
| LUSC (tumor) | LUSC (normal) |
| MARCH10, UBE2H (tumor) | MARCH10, UBE2H (normal) |
 |  |
| PRAD (tumor) | PRAD (normal) |
| MARCH10, UBE2H (tumor) | MARCH10, UBE2H (normal) |
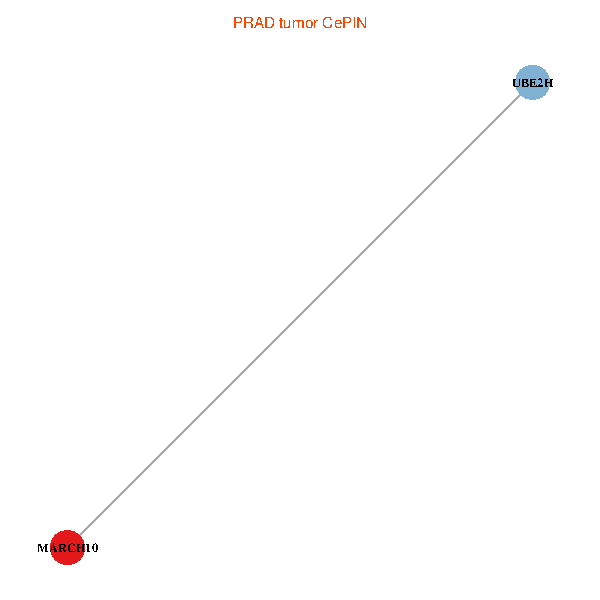 |  |
| STAD (tumor) | STAD (normal) |
| MARCH10, UBE2H (tumor) | MARCH10, UBE2H (normal) |
 |  |
| THCA (tumor) | THCA (normal) |
| MARCH10, UBE2H (tumor) | MARCH10, UBE2H (normal) |
 |  |
| Top |
| TissGeneProg for MARCH10 |
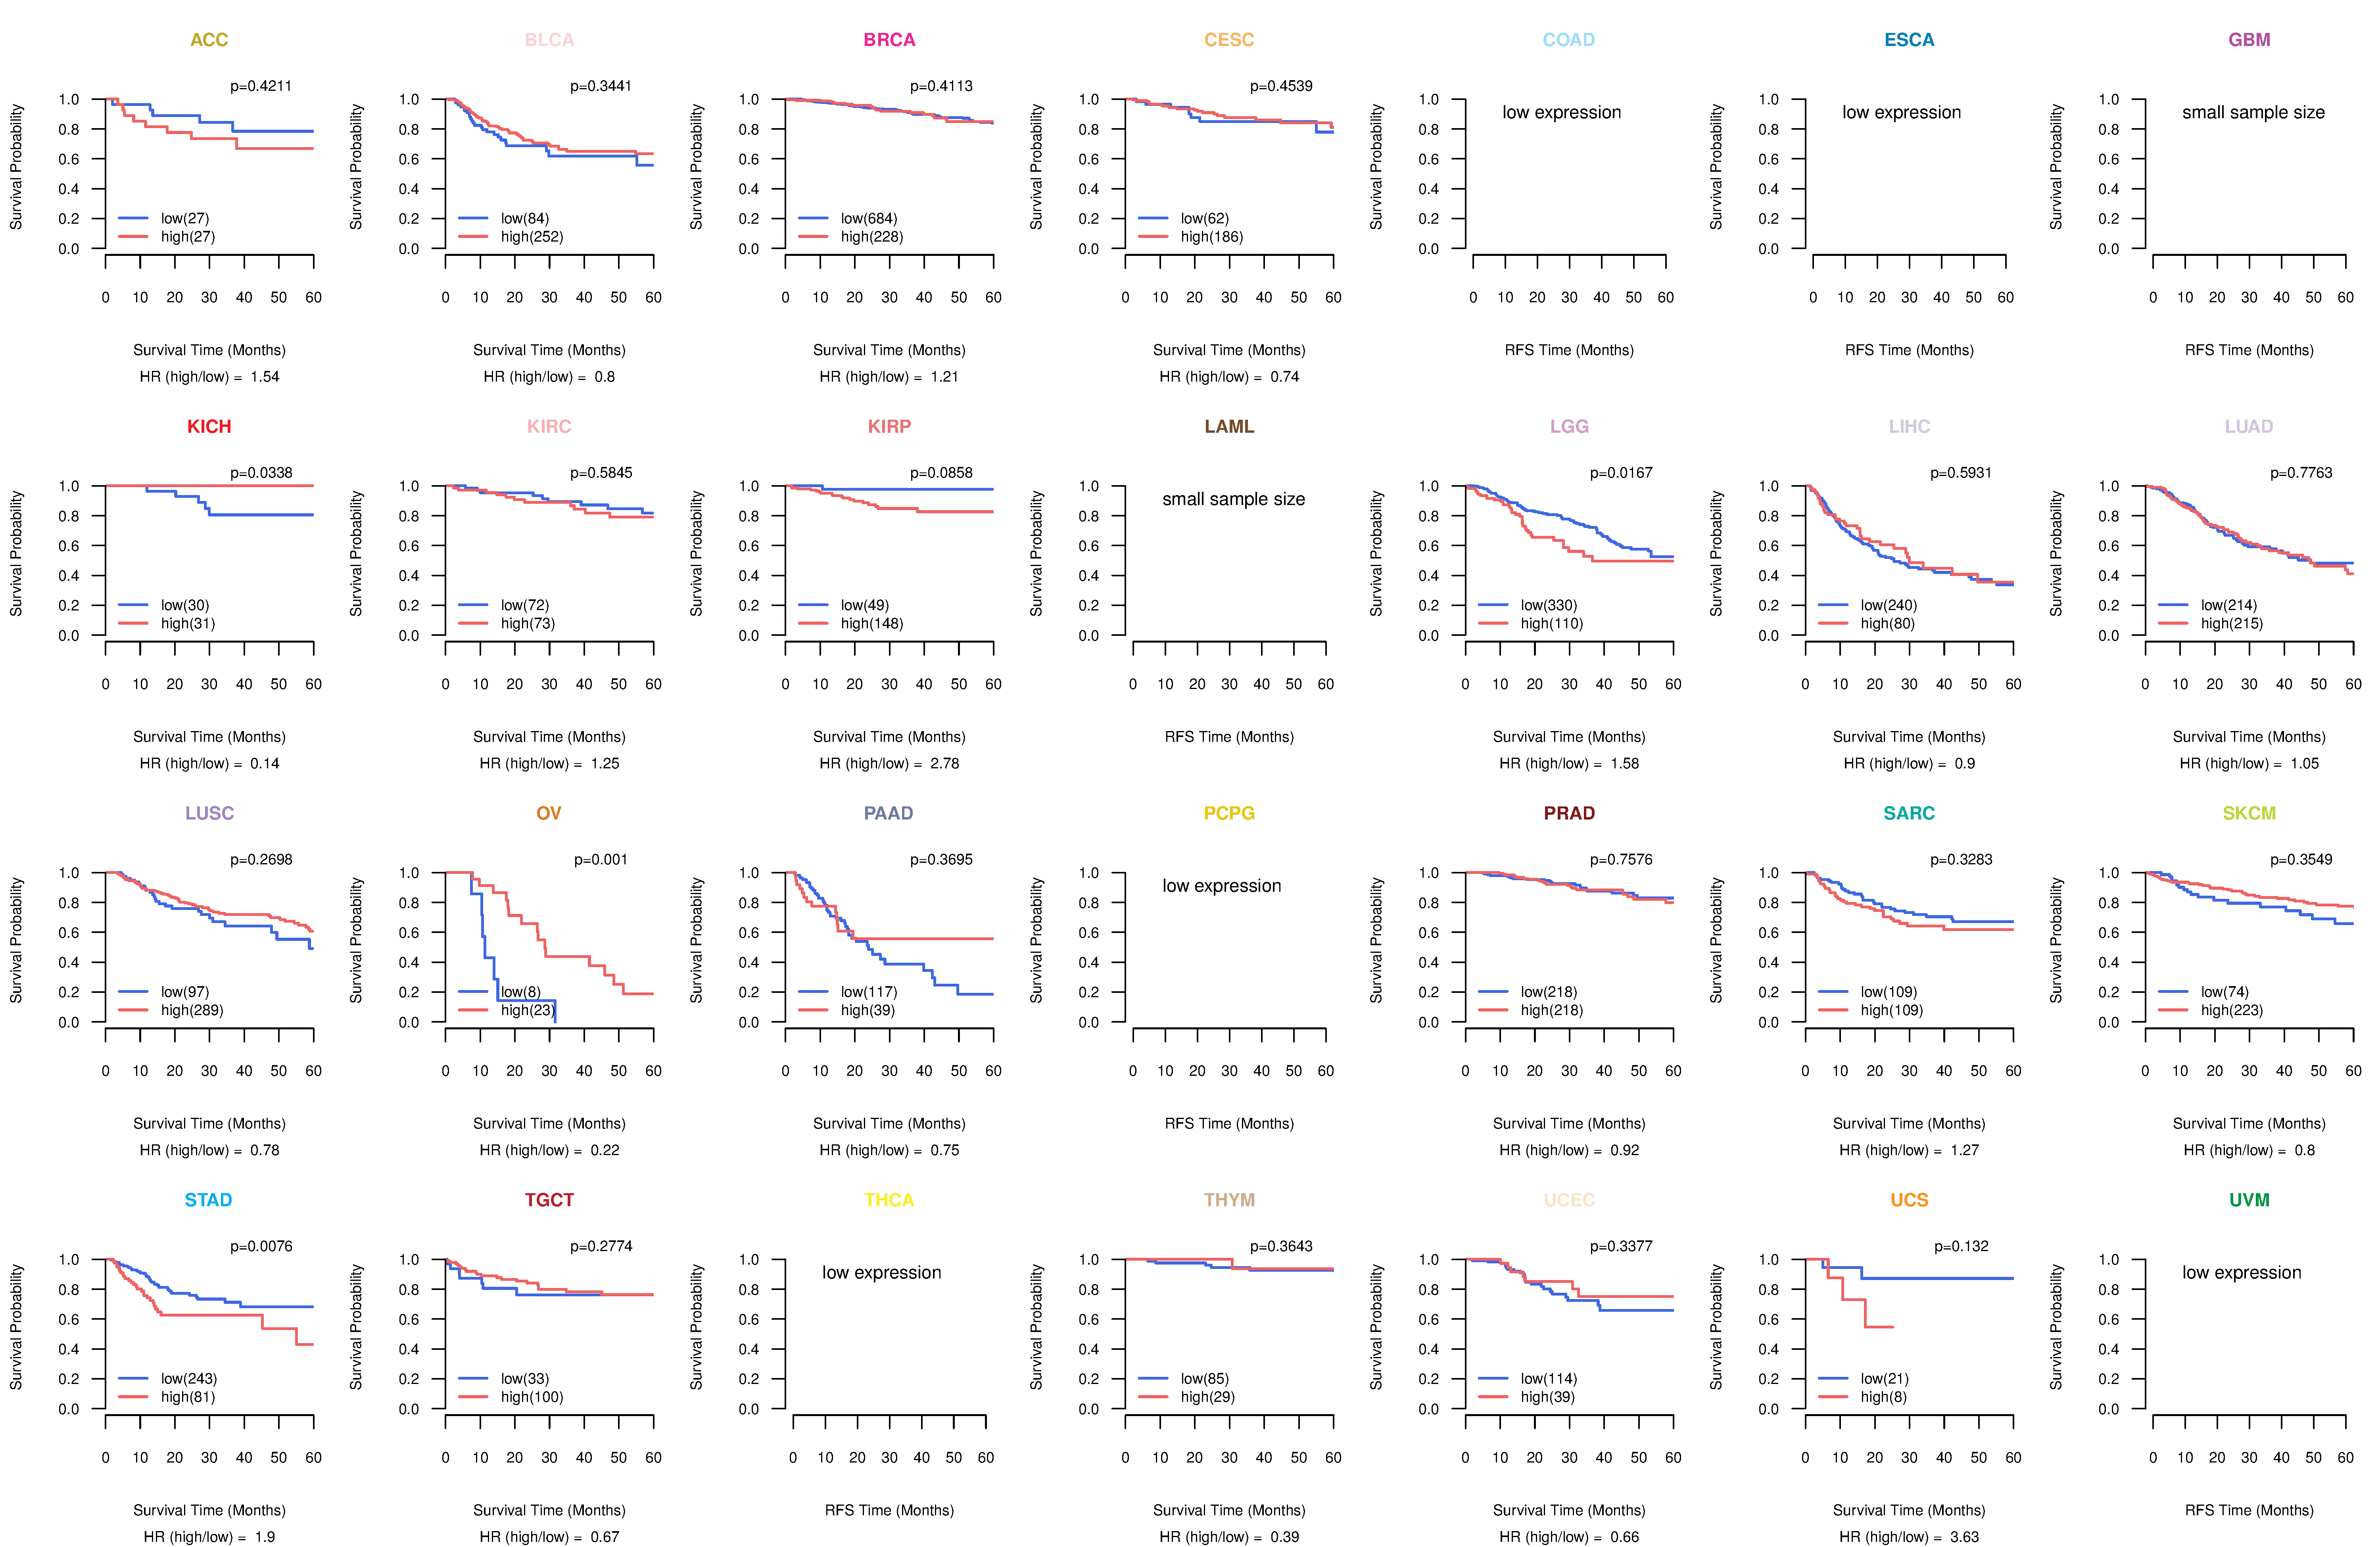
| Kaplan-Meier plots with logrank tests of overall survival (OS) using 28 cancer types (TCGA IlluminaHiSeq_RNASeqV2, pan-cancer normalized log2(norm_counts+1) data, version 2016-08-16) (TCGA clinicalMatrix, phenotype data, version 2016-04-27) * Click on the image to enlarge it in a new window. |
 |
| Kaplan-Meier plots with logrank test of relapse free survival (RFS) using 28 cancer types (TCGA IlluminaHiSeq_RNASeqV2, pan-cancer normalized log2(norm_counts+1) data, version 2016-08-16) (TCGA clinicalMatrix, phenotype data, version 2016-04-27) * Click on the image enlarge it in a new window. |
 |
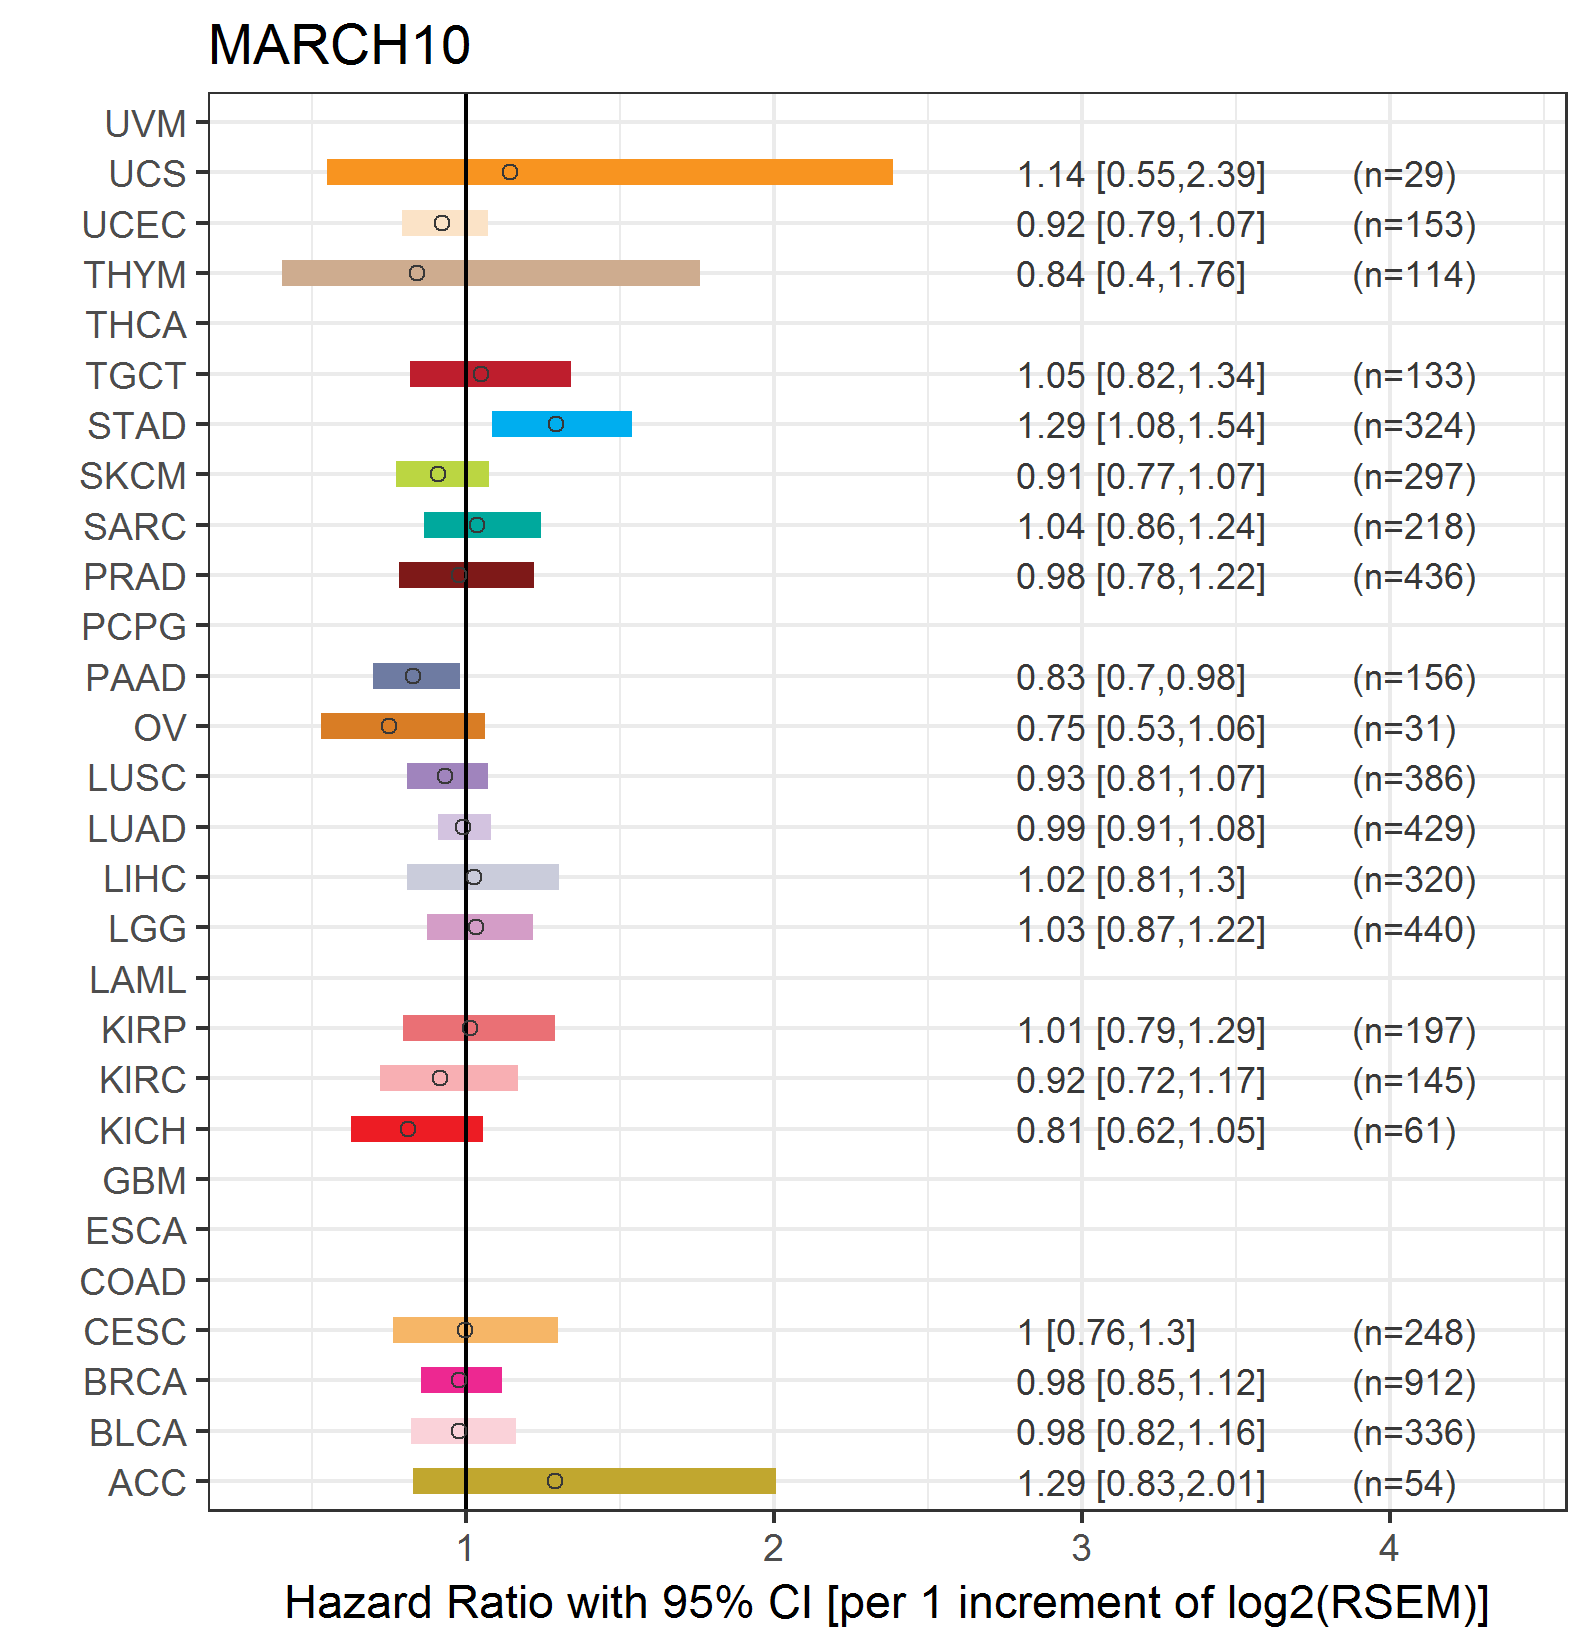
| Forest plot of Cox proportional hazard ratio (HR) and 95% CI of overall survival (OS) using 28 cancer types (TCGA IlluminaHiSeq_RNASeqV2, pan-cancer normalized log2(norm_counts+1) data, version 2016-08-16) (TCGA clinicalMatrix, phenotype data, version 2016-04-27) * Click on the image enlarge it in a new window. |
 |
| Forest plot of Cox proportional hazard ratio (HR) and 95% CI of relapse free survival (RFS) using 28 cancer types (TCGA IlluminaHiSeq_RNASeqV2, pan-cancer normalized log2(norm_counts+1) data, version 2016-08-16) (TCGA clinicalMatrix, phenotype data, version 2016-04-27) * Click on the image enlarge it in a new window. |
 |
| Top |
| TissGeneClin for MARCH10 |
| TissGeneDrug for MARCH10 |
| Drug information targeting TissGene (DrugBank Version 5.0.6, 2017-04-01) |
| DrugBank ID | Drug name | Drug activity | Drug type | Drug status |
| Top |
| TissGeneDisease for MARCH10 |
| Disease information associated with TissGene (DisGeNet, 2016-06-01) |
| Disease ID | Disease name | # pubmeds | Source |
| umls:C0085298 | Sudden Cardiac Death | 1 | GAD |
| umls:C1720824 | Sudden Cardiac Arrest | 1 | GWASCAT |
|
Copyright 2016-Present - The University of Texas Health Science Center at Houston (UTHealth) Web File Viewing | How to Report, Fraud, Waste and Abuse | State of Texas | Statewide Search | Texas Homeland Security | Site Policies |