 |
| |
| |
| |
| |
| |
| |
|

| TissGeneSummary for TTC21A |
 Gene summary Gene summary |
| Basic gene information | Gene symbol | TTC21A |
| Gene name | tetratricopeptide repeat domain 21A | |
| Synonyms | STI2 | |
| Cytomap | UCSC genome browser: 3p22.2 | |
| Type of gene | protein-coding | |
| RefGenes | NM_001105513.2, NM_145755.2, | |
| Description | TPR domain containing STI2TPR repeat protein 21Astress-inducible protein 2tetratricopeptide repeat protein 21A | |
| Modification date | 20141207 | |
| dbXrefs | MIM : 611430 | |
| HGNC : HGNC | ||
| Ensembl : ENSG00000168026 | ||
| HPRD : 10254 | ||
| Vega : OTTHUMG00000155973 | ||
| Protein | UniProt: go to UniProt's Cross Reference DB Table | |
| Expression | CleanEX: HS_TTC21A | |
| BioGPS: 199223 | ||
| Pathway | NCI Pathway Interaction Database: TTC21A | |
| KEGG: TTC21A | ||
| REACTOME: TTC21A | ||
| Pathway Commons: TTC21A | ||
| Context | iHOP: TTC21A | |
| ligand binding site mutation search in PubMed: TTC21A | ||
| UCL Cancer Institute: TTC21A | ||
| Assigned class in TissGDB* | B | |
| Included tissue-specific gene expression resources | HPA,TiGER,GTEx | |
| Specific-tissues in normal samples (assigned by TissGDB using HPA, TiGER, and GTEx) | Testis | |
| Cancer types related to the specific-tissues in cancer samples (assigned by TissGDB using TCGA) | TGCT | |
| Reference showing the relevant tissue of TTC21A | ||
| Description by TissGene annotations | TissgsLTS Fused withTSGene | |
| * Class A consists of genes with literature evidence and is part of the cTissGenes. Class B consists of only cTissGenes without additional evidence. The remaining genes belong to Class C. |
| Gene ontology having evidence of Inferred from Direct Assay (IDA) from Entrez |
| GO ID | GO term | PubMed ID |
| Top |
| TissGeneExp for TTC21A |
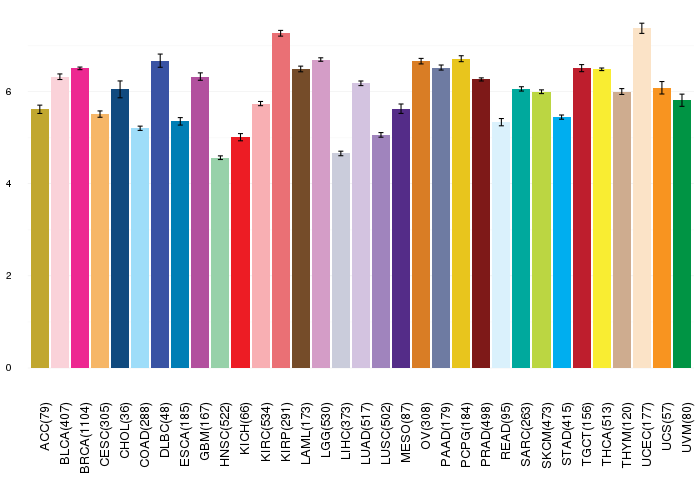
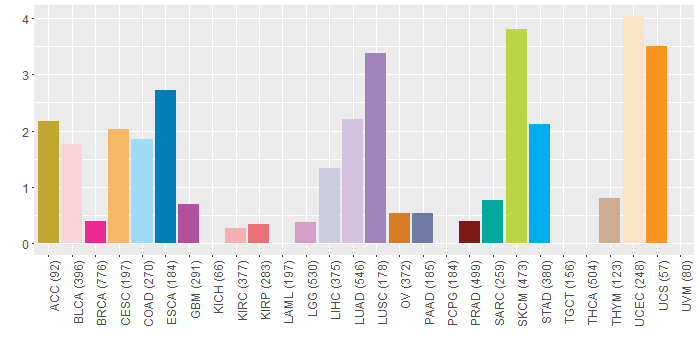
| Gene expressions across 28 cancer types (X-axis: cancer type and Y-axis: log2(norm_counts+1)) (TCGA IlluminaHiSeq_RNASeqV2, pan-cancer normalized log2(norm_counts+1) data, version 2016-08-16) |
 |
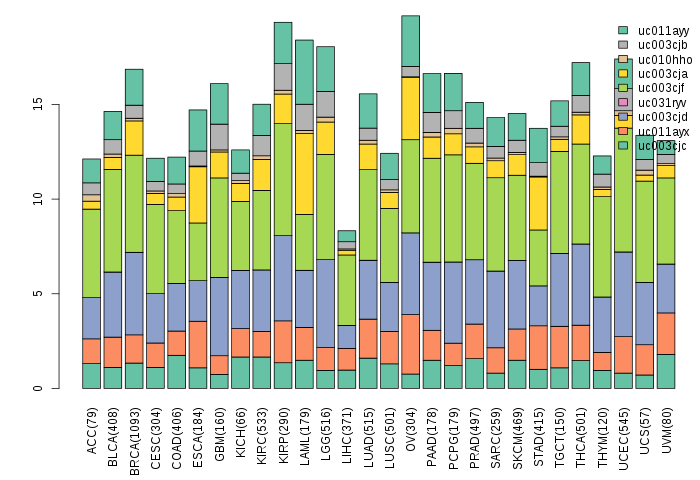
| Gene isoform expressions across 28 cancer types (X-axis: cancer type and Y-axis: log2(norm_counts+1)) (TCGA pan-cancer tcga_rsem_isoform_tpm, version 2016-09-01) |
 |
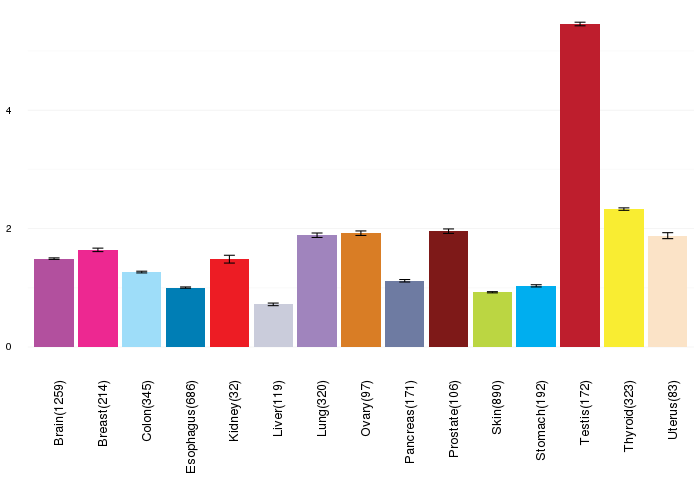
| Gene expressions across normal tissues of GTEx data (GTEx GTEx_Analysis_v6_RNA-seq_RNA-SeQCv1.1.8_gene_rpkm.gct) - Here, we shows the matched tissue types only among our 28 cancer types. |
 |
| Different expressions across 14 cancer types with more than 10 samples between matched tumors and normals (X-axis: cancer type and Y-axis: log2(norm_counts+1)) (TCGA IlluminaHiSeq_RNASeqV2, pan-cancer normalized log2(norm_counts+1) data, version 2016-08-16) |
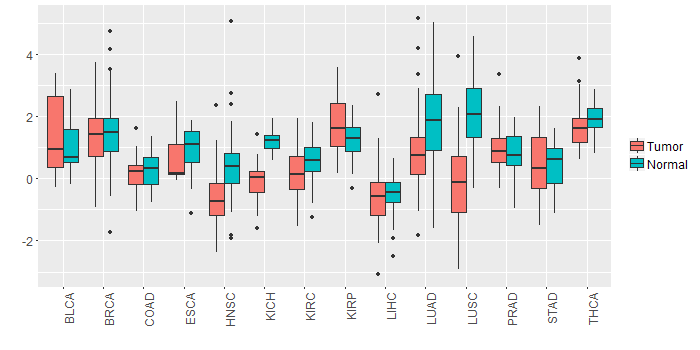 |
| - Significantly differentially expressed cancer types and information. (|Fold change|>1 and FDR<0.05) |
| Cancer type | Mean(exp) in tumor | Mean(exp) in matched normal | Log2FC | P-val. | FDR |
| LUAD | 0.825168224 | 1.899233741 | -1.074065517 | 1.93E-05 | 5.44E-05 |
| KICH | -0.132726466 | 1.219377534 | -1.352104 | 3.36E-11 | 2.88E-10 |
| LUSC | -0.16466325 | 2.070483809 | -2.235147059 | 3.01E-15 | 1.93E-14 |
| HNSC | -0.717693164 | 0.458018464 | -1.175711628 | 2.17E-06 | 1.50E-05 |
| Top |
| TissGene-miRNA for TTC21A |
| Significantly anti-correlated miRNAs of TissGene across 28 cancer types (Gene-miRNA relations from TargetScanHuman Relsease 7.1, Conserved_Site_Context_Scores.txt.zip, 06.01.2016) (TCGA IlluminaHiSeq_miRNASeq, log2(RPM+1) data, version 2016-11-21) (TCGA IlluminaHiSeq_RNASeqV2, log2(normalized_count+1) data, version 2016-08-16) (Spearman’s Rank Correlation (p-value<0.05 and coefficient<-0.25)) |
| Cancer type | miRNA id | miRNA accession | P-val. | Coeff. | # samples |
| Top |
| TissGeneMut for TTC21A |
| TissGeneSNV for TTC21A |
| nsSNV counts per each loci. Different colors of circles represent different cancer types. Circle size denotes number of samples. (TCGA somatic mutation (SNPs and small INDELs) data, version 2016-04-25) * Click on the image to enlarge it in a new window. |
 |
 |
| Somatic nucleotide variants of TissGene across 28 cancer types (X-axis: cancer type and Y-axis: % of mutated samples) The numbers in parentheses are numbers of samples with mutation (nsSNVs). (TCGA somatic mutation (SNPs and small INDELs) data, version 2016-04-25) |
 |
| - nsSNVs sorted by frequency. |
| AAchange | Cancer type | # samples |
| p.S332L | SKCM | 2 |
| p.R91Q | COAD | 2 |
| p.E745X | LIHC | 2 |
| p.G373V | CESC | 1 |
| p.R757K | SKCM | 1 |
| p.V1194A | UCEC | 1 |
| p.S1120* | BLCA | 1 |
| p.A666V | UCEC | 1 |
| p.I978M | BLCA | 1 |
| p.R1315Q | PRAD | 1 |
| p.A1181V | ESCA | 1 |
| p.E103K | SKCM | 1 |
| p.E448Q | LUAD | 1 |
| p.S246N | LUAD | 1 |
| p.D1303N | ACC | 1 |
| p.S692F | UCEC | 1 |
| p.G341A | BRCA | 1 |
| p.R1056C | HNSC | 1 |
| p.R1128L | UCEC | 1 |
| p.Q706H | ESCA | 1 |
| p.C1213S | LGG | 1 |
| p.D588Y | LUAD | 1 |
| p.R709K | HNSC | 1 |
| p.P1305S | SKCM | 1 |
| p.E775K | SKCM | 1 |
| p.I303S | CESC | 1 |
| p.E242Q | HNSC | 1 |
| p.R1055C | STAD | 1 |
| p.L507F | LUAD | 1 |
| p.E78K | BRCA | 1 |
| p.E52X | UCS | 1 |
| p.R1181C | STAD | 1 |
| p.E754K | CESC | 1 |
| p.M440I | LIHC | 1 |
| p.D158V | LUSC | 1 |
| p.E290K | SKCM | 1 |
| p.R241K | COAD | 1 |
| p.E1291K | DLBC | 1 |
| p.R258X | COAD | 1 |
| p.V218F | HNSC | 1 |
| p.E954K | BLCA | 1 |
| p.A1255V | LUAD | 1 |
| p.E288* | LUAD | 1 |
| p.P921A | STAD | 1 |
| p.E339K | SKCM | 1 |
| p.E464K | BLCA | 1 |
| p.E746* | LIHC | 1 |
| p.E705D | COAD | 1 |
| p.L122F | UCEC | 1 |
| p.V406A | UCEC | 1 |
| p.D907N | STAD | 1 |
| p.S764F | SKCM | 1 |
| p.G142S | SKCM | 1 |
| p.R869L | LUAD | 1 |
| p.L343V | STAD | 1 |
| p.D1302N | ACC | 1 |
| p.I1153V | LUSC | 1 |
| p.S1121Y | ESCA | 1 |
| p.R970T | BLCA | 1 |
| p.D587Y | LUAD | 1 |
| p.A947V | STAD | 1 |
| p.R1316Q | PRAD | 1 |
| p.R1127L | LUAD | 1 |
| p.S270Y | CESC | 1 |
| p.R635G | SKCM | 1 |
| p.H557Y | SKCM | 1 |
| p.N204S | STAD | 1 |
| p.A329V | UCEC | 1 |
| p.M368K | LUAD | 1 |
| p.A427V | DLBC | 1 |
| p.M881I | BRCA | 1 |
| p.E824K | SKCM | 1 |
| p.C469R | LUAD | 1 |
| p.M368I | LUAD | 1 |
| p.P988T | LUSC | 1 |
| p.E52* | UCS | 1 |
| p.D906N | STAD | 1 |
| p.G211R | GBM | 1 |
| p.P883L | SKCM | 1 |
| p.P920A | STAD | 1 |
| p.A855V | STAD | 1 |
| p.T228N | READ | 1 |
| p.R1128L | LUAD | 1 |
| p.S169L | SKCM | 1 |
| p.I665T | LGG | 1 |
| p.I616T | LGG | 1 |
| p.V208M | HNSC | 1 |
| p.A1017T | PAAD | 1 |
| p.P603A | OV | 1 |
| p.A412S | BLCA | 1 |
| p.R1134W | STAD | 1 |
| p.K848M | ESCA | 1 |
| p.A976V | UCEC | 1 |
| p.V203M | DLBC | 1 |
| p.A854V | STAD | 1 |
| p.D70Y | ACC | 1 |
| p.S283W | SKCM | 1 |
| p.S332W | SKCM | 1 |
| p.K924N | STAD | 1 |
| p.M191I | HNSC | 1 |
| p.R708K | SKCM | 1 |
| p.S270Y | UCS | 1 |
| p.R1181L | KIRC | 1 |
| p.S1150I | SARC | 1 |
| p.E632K | SKCM | 1 |
| p.R586G | SKCM | 1 |
| p.R141T | LIHC | 1 |
| p.P883S | SKCM | 1 |
| p.A947S | KIRP | 1 |
| p.R1127L | UCEC | 1 |
| p.D1254N | ACC | 1 |
| p.R325H | THYM | 1 |
| p.I248T | PRAD | 1 |
| p.S332L | BLCA | 1 |
| p.D229G | LIHC | 1 |
| p.L241P | LUSC | 1 |
| p.S210L | SKCM | 1 |
| p.G211W | LUAD | 1 |
| p.Q1177H | LUAD | 1 |
| p.R1308W | HNSC | 1 |
| p.H538Y | LUSC | 1 |
| p.G1043R | UCEC | 1 |
| p.P988Q | LUSC | 1 |
| p.G794R | UCEC | 1 |
| p.K644N | UCEC | 1 |
| p.R125C | GBM | 1 |
| p.E262K | ESCA | 1 |
| p.G1042R | UCEC | 1 |
| p.K496R | HNSC | 1 |
| p.D503H | LUSC | 1 |
| p.L708R | HNSC | 1 |
| p.D1254N | COAD | 1 |
| p.R1055C | HNSC | 1 |
| p.E1047K | SKCM | 1 |
| p.C800Y | SARC | 1 |
| p.E171K | SKCM | 1 |
| p.D179H | CESC | 1 |
| p.L355M | UCEC | 1 |
| p.G609S | OV | 1 |
| p.R868L | LUAD | 1 |
| p.Q349K | UCEC | 1 |
| p.R710K | HNSC | 1 |
| Top |
| TissGeneCNV for TTC21A |
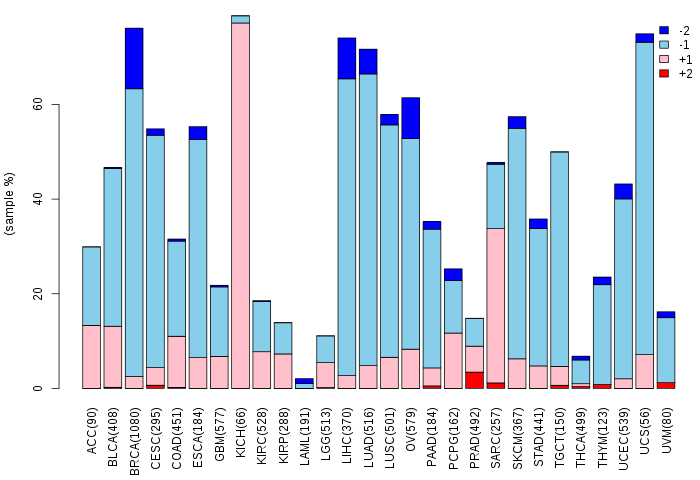
| Copy number variations of TissGene across 28 cancer types (X-axis: cancer type and Y-axis: % of CNV samples) (TCGA Gistic2_CopyNumber_Gistic2_all_data_by_genes, Gistic2 copy number data, version 2016-08-16) |
 |
| Top |
| TissGeneFusions for TTC21A |
| Fusion genes including TissGene (ChimerDB 3.0, 2016-12-01 and TCGA fusion Portal 2015-12-01) |
| Database | Src | Cancer type | Sample | Fusion gene | ORF | 5'-gene BP | 3'-gene BP |
| Chimerdb3.0 | ChiTaRs | NA | AW450316 | TTC21A-SALL2 | chr3:39180391 | chr14:21993571 |
| Top |
| TissGeneNet for TTC21A |
| Co-expressed gene networks based on protein-protein interaction data (CePIN) (TCGA IlluminaHiSeq_RNASeqV2, pan-cancer normalized log2(norm_counts+1) data, version 2016-08-16) (PINA2 ppi data) |
| Top |
| TissGeneProg for TTC21A |
| Kaplan-Meier plots with logrank tests of overall survival (OS) using 28 cancer types (TCGA IlluminaHiSeq_RNASeqV2, pan-cancer normalized log2(norm_counts+1) data, version 2016-08-16) (TCGA clinicalMatrix, phenotype data, version 2016-04-27) * Click on the image to enlarge it in a new window. |
 |
| Kaplan-Meier plots with logrank test of relapse free survival (RFS) using 28 cancer types (TCGA IlluminaHiSeq_RNASeqV2, pan-cancer normalized log2(norm_counts+1) data, version 2016-08-16) (TCGA clinicalMatrix, phenotype data, version 2016-04-27) * Click on the image enlarge it in a new window. |
 |
| Forest plot of Cox proportional hazard ratio (HR) and 95% CI of overall survival (OS) using 28 cancer types (TCGA IlluminaHiSeq_RNASeqV2, pan-cancer normalized log2(norm_counts+1) data, version 2016-08-16) (TCGA clinicalMatrix, phenotype data, version 2016-04-27) * Click on the image enlarge it in a new window. |
 |
| Forest plot of Cox proportional hazard ratio (HR) and 95% CI of relapse free survival (RFS) using 28 cancer types (TCGA IlluminaHiSeq_RNASeqV2, pan-cancer normalized log2(norm_counts+1) data, version 2016-08-16) (TCGA clinicalMatrix, phenotype data, version 2016-04-27) * Click on the image enlarge it in a new window. |
 |
| Top |
| TissGeneClin for TTC21A |
| TissGeneDrug for TTC21A |
| Drug information targeting TissGene (DrugBank Version 5.0.6, 2017-04-01) |
| DrugBank ID | Drug name | Drug activity | Drug type | Drug status |
| Top |
| TissGeneDisease for TTC21A |
| Disease information associated with TissGene (DisGeNet, 2016-06-01) |
| Disease ID | Disease name | # pubmeds | Source |
| umls:C0279702 | Conventional (Clear Cell) Renal Cell Carcinoma | 1 | BeFree |
|
Copyright 2016-Present - The University of Texas Health Science Center at Houston (UTHealth) Web File Viewing | How to Report, Fraud, Waste and Abuse | State of Texas | Statewide Search | Texas Homeland Security | Site Policies |