 |
| |
| |
| |
| |
| |
| |
|

| TissGeneSummary for SLC39A12 |
 Gene summary Gene summary |
| Basic gene information | Gene symbol | SLC39A12 |
| Gene name | solute carrier family 39 (zinc transporter), member 12 | |
| Synonyms | LZT-Hs8|ZIP-12|bA570F3.1 | |
| Cytomap | UCSC genome browser: 10p12.33 | |
| Type of gene | protein-coding | |
| RefGenes | NM_001145195.1, NM_001282733.1,NM_001282734.1,NM_152725.3, | |
| Description | LIV-1 subfamily of ZIP zinc transporter 8solute carrier family 39 (metal ion transporter), member 12solute carrier family 39 member 12zinc transporter ZIP12zrt- and Irt-like protein 12 | |
| Modification date | 20141207 | |
| dbXrefs | MIM : 608734 | |
| HGNC : HGNC | ||
| Ensembl : ENSG00000148482 | ||
| HPRD : 15384 | ||
| Vega : OTTHUMG00000017759 | ||
| Protein | UniProt: go to UniProt's Cross Reference DB Table | |
| Expression | CleanEX: HS_SLC39A12 | |
| BioGPS: 221074 | ||
| Pathway | NCI Pathway Interaction Database: SLC39A12 | |
| KEGG: SLC39A12 | ||
| REACTOME: SLC39A12 | ||
| Pathway Commons: SLC39A12 | ||
| Context | iHOP: SLC39A12 | |
| ligand binding site mutation search in PubMed: SLC39A12 | ||
| UCL Cancer Institute: SLC39A12 | ||
| Assigned class in TissGDB* | C | |
| Included tissue-specific gene expression resources | HPA,TiGER | |
| Specific-tissues in normal samples (assigned by TissGDB using HPA, TiGER, and GTEx) | Brain | |
| Cancer types related to the specific-tissues in cancer samples (assigned by TissGDB using TCGA) | GBM,LGG | |
| Reference showing the relevant tissue of SLC39A12 | ||
| Description by TissGene annotations | TissgsKTS CNV lost TissGeneKTS | |
| * Class A consists of genes with literature evidence and is part of the cTissGenes. Class B consists of only cTissGenes without additional evidence. The remaining genes belong to Class C. |
| Gene ontology having evidence of Inferred from Direct Assay (IDA) from Entrez |
| GO ID | GO term | PubMed ID |
| Top |
| TissGeneExp for SLC39A12 |
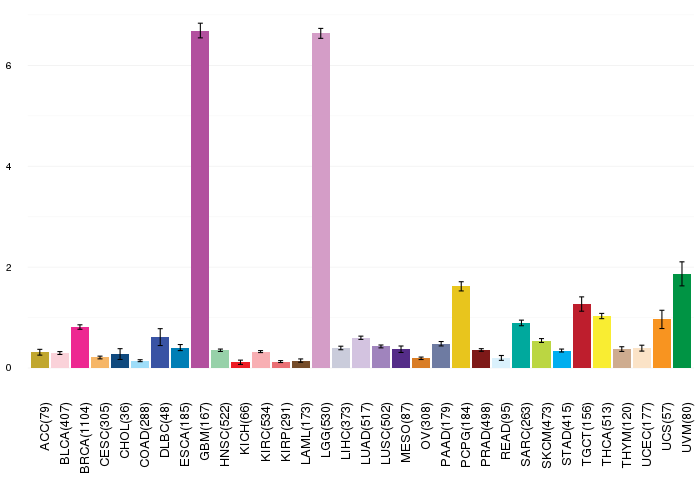
| Gene expressions across 28 cancer types (X-axis: cancer type and Y-axis: log2(norm_counts+1)) (TCGA IlluminaHiSeq_RNASeqV2, pan-cancer normalized log2(norm_counts+1) data, version 2016-08-16) |
 |
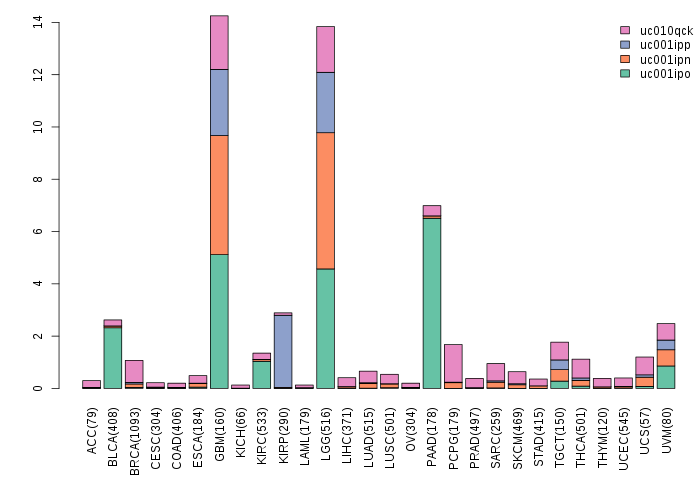
| Gene isoform expressions across 28 cancer types (X-axis: cancer type and Y-axis: log2(norm_counts+1)) (TCGA pan-cancer tcga_rsem_isoform_tpm, version 2016-09-01) |
 |
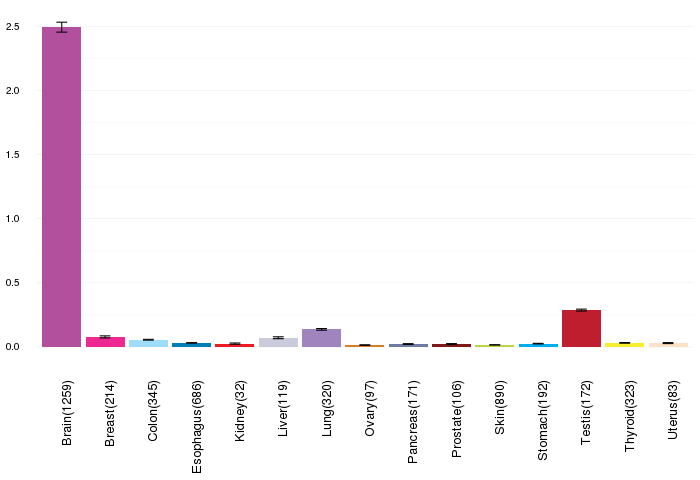
| Gene expressions across normal tissues of GTEx data (GTEx GTEx_Analysis_v6_RNA-seq_RNA-SeQCv1.1.8_gene_rpkm.gct) - Here, we shows the matched tissue types only among our 28 cancer types. |
 |
| Different expressions across 14 cancer types with more than 10 samples between matched tumors and normals (X-axis: cancer type and Y-axis: log2(norm_counts+1)) (TCGA IlluminaHiSeq_RNASeqV2, pan-cancer normalized log2(norm_counts+1) data, version 2016-08-16) |
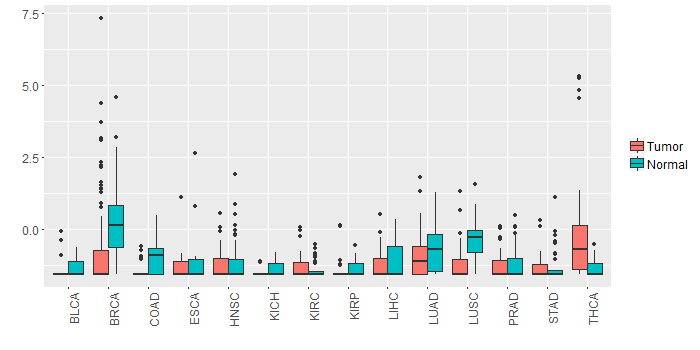 |
| - Significantly differentially expressed cancer types and information. (|Fold change|>1 and FDR<0.05) |
| Cancer type | Mean(exp) in tumor | Mean(exp) in matched normal | Log2FC | P-val. | FDR |
| THCA | -0.290501893 | -1.40495274 | 1.114450847 | 2.53E-06 | 9.08E-06 |
| Top |
| TissGene-miRNA for SLC39A12 |
| Significantly anti-correlated miRNAs of TissGene across 28 cancer types (Gene-miRNA relations from TargetScanHuman Relsease 7.1, Conserved_Site_Context_Scores.txt.zip, 06.01.2016) (TCGA IlluminaHiSeq_miRNASeq, log2(RPM+1) data, version 2016-11-21) (TCGA IlluminaHiSeq_RNASeqV2, log2(normalized_count+1) data, version 2016-08-16) (Spearman’s Rank Correlation (p-value<0.05 and coefficient<-0.25)) |
| Cancer type | miRNA id | miRNA accession | P-val. | Coeff. | # samples |
| Top |
| TissGeneMut for SLC39A12 |
| TissGeneSNV for SLC39A12 |
| nsSNV counts per each loci. Different colors of circles represent different cancer types. Circle size denotes number of samples. (TCGA somatic mutation (SNPs and small INDELs) data, version 2016-04-25) * Click on the image to enlarge it in a new window. |
 |
 |
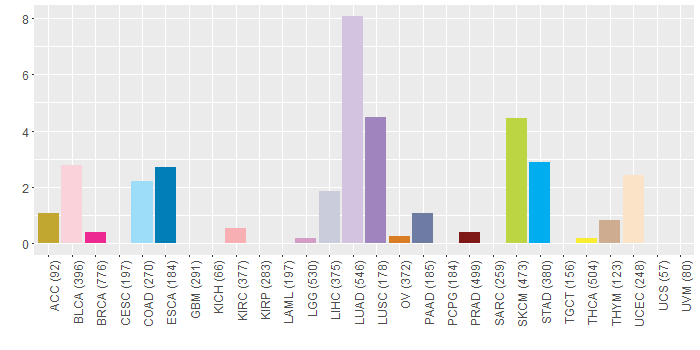
| Somatic nucleotide variants of TissGene across 28 cancer types (X-axis: cancer type and Y-axis: % of mutated samples) The numbers in parentheses are numbers of samples with mutation (nsSNVs). (TCGA somatic mutation (SNPs and small INDELs) data, version 2016-04-25) |
 |
| - nsSNVs sorted by frequency. |
| AAchange | Cancer type | # samples |
| p.E126K | SKCM | 2 |
| p.G453* | LUAD | 2 |
| p.G368S | SKCM | 2 |
| p.I194M | SKCM | 1 |
| p.V49I | LUAD | 1 |
| p.E495K | LIHC | 1 |
| p.L399F | COAD | 1 |
| p.L316V | LUSC | 1 |
| p.Y367F | HNSC | 1 |
| p.I577M | LUAD | 1 |
| p.E318D | UCEC | 1 |
| p.E70K | SKCM | 1 |
| p.Q286* | SKCM | 1 |
| p.A432D | LUSC | 1 |
| p.E395K | LUAD | 1 |
| p.R77K | LUAD | 1 |
| p.S192F | SKCM | 1 |
| p.R107G | LUAD | 1 |
| p.R62K | COAD | 1 |
| p.L377R | COAD | 1 |
| p.S10F | BLCA | 1 |
| p.L46M | LUAD | 1 |
| p.C85Y | BLCA | 1 |
| p.K323N | LUAD | 1 |
| p.A416T | COAD | 1 |
| p.L467V | HNSC | 1 |
| p.T635I | LUSC | 1 |
| p.L425F | THYM | 1 |
| p.C628Y | LIHC | 1 |
| p.E331D | LUAD | 1 |
| p.L451* | LUAD | 1 |
| p.L50I | COAD | 1 |
| p.P433T | LUAD | 1 |
| p.D473G | STAD | 1 |
| p.G596E | SKCM | 1 |
| p.E431* | LUAD | 1 |
| p.W632* | SKCM | 1 |
| p.K138E | LIHC | 1 |
| p.H428L | HNSC | 1 |
| p.E331* | LUAD | 1 |
| p.R660L | LUAD | 1 |
| p.G368C | HNSC | 1 |
| p.S8L | BLCA | 1 |
| p.E90D | HNSC | 1 |
| p.R352K | UCEC | 1 |
| p.Q125H | SKCM | 1 |
| p.A529S | COAD | 1 |
| p.Y369C | LUAD | 1 |
| p.G193* | ACC | 1 |
| p.D473N | SKCM | 1 |
| p.S645F | LUAD | 1 |
| p.W676C | HNSC | 1 |
| p.S160X | STAD | 1 |
| p.V220I | ESCA | 1 |
| p.D516N | PAAD | 1 |
| p.S526I | LUAD | 1 |
| p.L646F | LUAD | 1 |
| p.L96I | PRAD | 1 |
| p.L593F | LUAD | 1 |
| p.D285N | SKCM | 1 |
| p.T574R | SKCM | 1 |
| p.E581V | ESCA | 1 |
| p.G450E | SKCM | 1 |
| p.M522I | LUAD | 1 |
| p.E394D | PRAD | 1 |
| p.A98D | HNSC | 1 |
| p.G453V | LUAD | 1 |
| p.G193X | ACC | 1 |
| p.C221F | HNSC | 1 |
| p.S565* | LUAD | 1 |
| p.I559T | LUAD | 1 |
| p.G454V | LUAD | 1 |
| p.S565L | SKCM | 1 |
| p.Q322R | LUAD | 1 |
| p.K270N | UCEC | 1 |
| p.K132N | LUAD | 1 |
| p.P230L | LUAD | 1 |
| p.S8L | HNSC | 1 |
| p.V9L | LUAD | 1 |
| p.K330N | LUAD | 1 |
| p.S513I | LUSC | 1 |
| p.E109* | UCEC | 1 |
| p.Y369H | BLCA | 1 |
| p.S229F | BLCA | 1 |
| p.S156F | HNSC | 1 |
| p.L672F | BLCA | 1 |
| p.S178F | LUAD | 1 |
| p.K141T | UCEC | 1 |
| p.E154K | LIHC | 1 |
| p.R314S | STAD | 1 |
| p.E318K | SKCM | 1 |
| p.G450E | LUAD | 1 |
| p.R243H | STAD | 1 |
| p.L642S | ESCA | 1 |
| p.N290K | BLCA | 1 |
| p.H124Q | COAD | 1 |
| p.S8L | THCA | 1 |
| p.Y174F | ESCA | 1 |
| p.A93S | LUAD | 1 |
| p.G384E | HNSC | 1 |
| p.G223V | LUSC | 1 |
| p.P338T | LUAD | 1 |
| p.Q254K | LUAD | 1 |
| p.C310S | LIHC | 1 |
| p.T574M | STAD | 1 |
| p.T528R | KIRC | 1 |
| p.F291L | LUAD | 1 |
| p.Y618H | STAD | 1 |
| p.K6N | HNSC | 1 |
| p.L68S | LUAD | 1 |
| p.G199S | SKCM | 1 |
| p.G453L | LUAD | 1 |
| p.D104Y | LUSC | 1 |
| p.F670L | STAD | 1 |
| p.M615I | BRCA | 1 |
| p.L679I | LUAD | 1 |
| p.F3L | LUAD | 1 |
| p.S197I | LUAD | 1 |
| p.E331V | ESCA | 1 |
| p.V374I | STAD | 1 |
| p.E365D | HNSC | 1 |
| p.S149C | LUAD | 1 |
| p.Q112E | LUAD | 1 |
| p.R113S | ESCA | 1 |
| p.L345V | LUAD | 1 |
| p.T204M | UCEC | 1 |
| p.H391N | KIRC | 1 |
| p.L667M | HNSC | 1 |
| p.S566L | BLCA | 1 |
| p.G223E | SKCM | 1 |
| p.E235D | LIHC | 1 |
| p.E331K | SKCM | 1 |
| p.W632X | SKCM | 1 |
| p.I577V | BRCA | 1 |
| p.N226D | LUSC | 1 |
| p.D301Y | LUAD | 1 |
| p.E318* | LUAD | 1 |
| p.D166G | STAD | 1 |
| p.H124Y | SKCM | 1 |
| p.G80R | SKCM | 1 |
| p.S160* | STAD | 1 |
| p.D415E | BLCA | 1 |
| p.G436W | LUAD | 1 |
| p.T385A | LGG | 1 |
| p.E163K | SKCM | 1 |
| p.L401* | OV | 1 |
| p.S598C | LUAD | 1 |
| p.H284N | LUAD | 1 |
| p.I524K | SKCM | 1 |
| p.G457E | BLCA | 1 |
| p.M382I | STAD | 1 |
| p.W662* | SKCM | 1 |
| p.Q173H | LUAD | 1 |
| p.S23F | SKCM | 1 |
| p.P583T | LUSC | 1 |
| p.H439L | LUAD | 1 |
| p.R248H | UCEC | 1 |
| p.E154D | STAD | 1 |
| p.Q286X | SKCM | 1 |
| p.S178Y | LUSC | 1 |
| p.L399I | LUAD | 1 |
| p.330_331KE>N* | LUAD | 1 |
| p.W306* | SKCM | 1 |
| p.A31T | BRCA | 1 |
| p.H439Q | LUAD | 1 |
| p.N280S | BLCA | 1 |
| p.S337C | LIHC | 1 |
| p.V591M | PAAD | 1 |
| p.F614S | BLCA | 1 |
| p.D33V | SKCM | 1 |
| Top |
| TissGeneCNV for SLC39A12 |
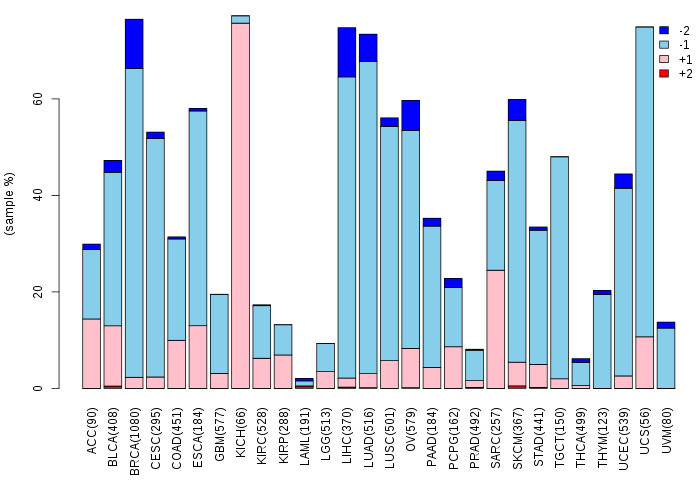
| Copy number variations of TissGene across 28 cancer types (X-axis: cancer type and Y-axis: % of CNV samples) (TCGA Gistic2_CopyNumber_Gistic2_all_data_by_genes, Gistic2 copy number data, version 2016-08-16) |
 |
| Top |
| TissGeneFusions for SLC39A12 |
| Fusion genes including TissGene (ChimerDB 3.0, 2016-12-01 and TCGA fusion Portal 2015-12-01) |
| Database | Src | Cancer type | Sample | Fusion gene | ORF | 5'-gene BP | 3'-gene BP |
| Top |
| TissGeneNet for SLC39A12 |
| Co-expressed gene networks based on protein-protein interaction data (CePIN) (TCGA IlluminaHiSeq_RNASeqV2, pan-cancer normalized log2(norm_counts+1) data, version 2016-08-16) (PINA2 ppi data) |
| Top |
| TissGeneProg for SLC39A12 |
| Kaplan-Meier plots with logrank tests of overall survival (OS) using 28 cancer types (TCGA IlluminaHiSeq_RNASeqV2, pan-cancer normalized log2(norm_counts+1) data, version 2016-08-16) (TCGA clinicalMatrix, phenotype data, version 2016-04-27) * Click on the image to enlarge it in a new window. |
 |
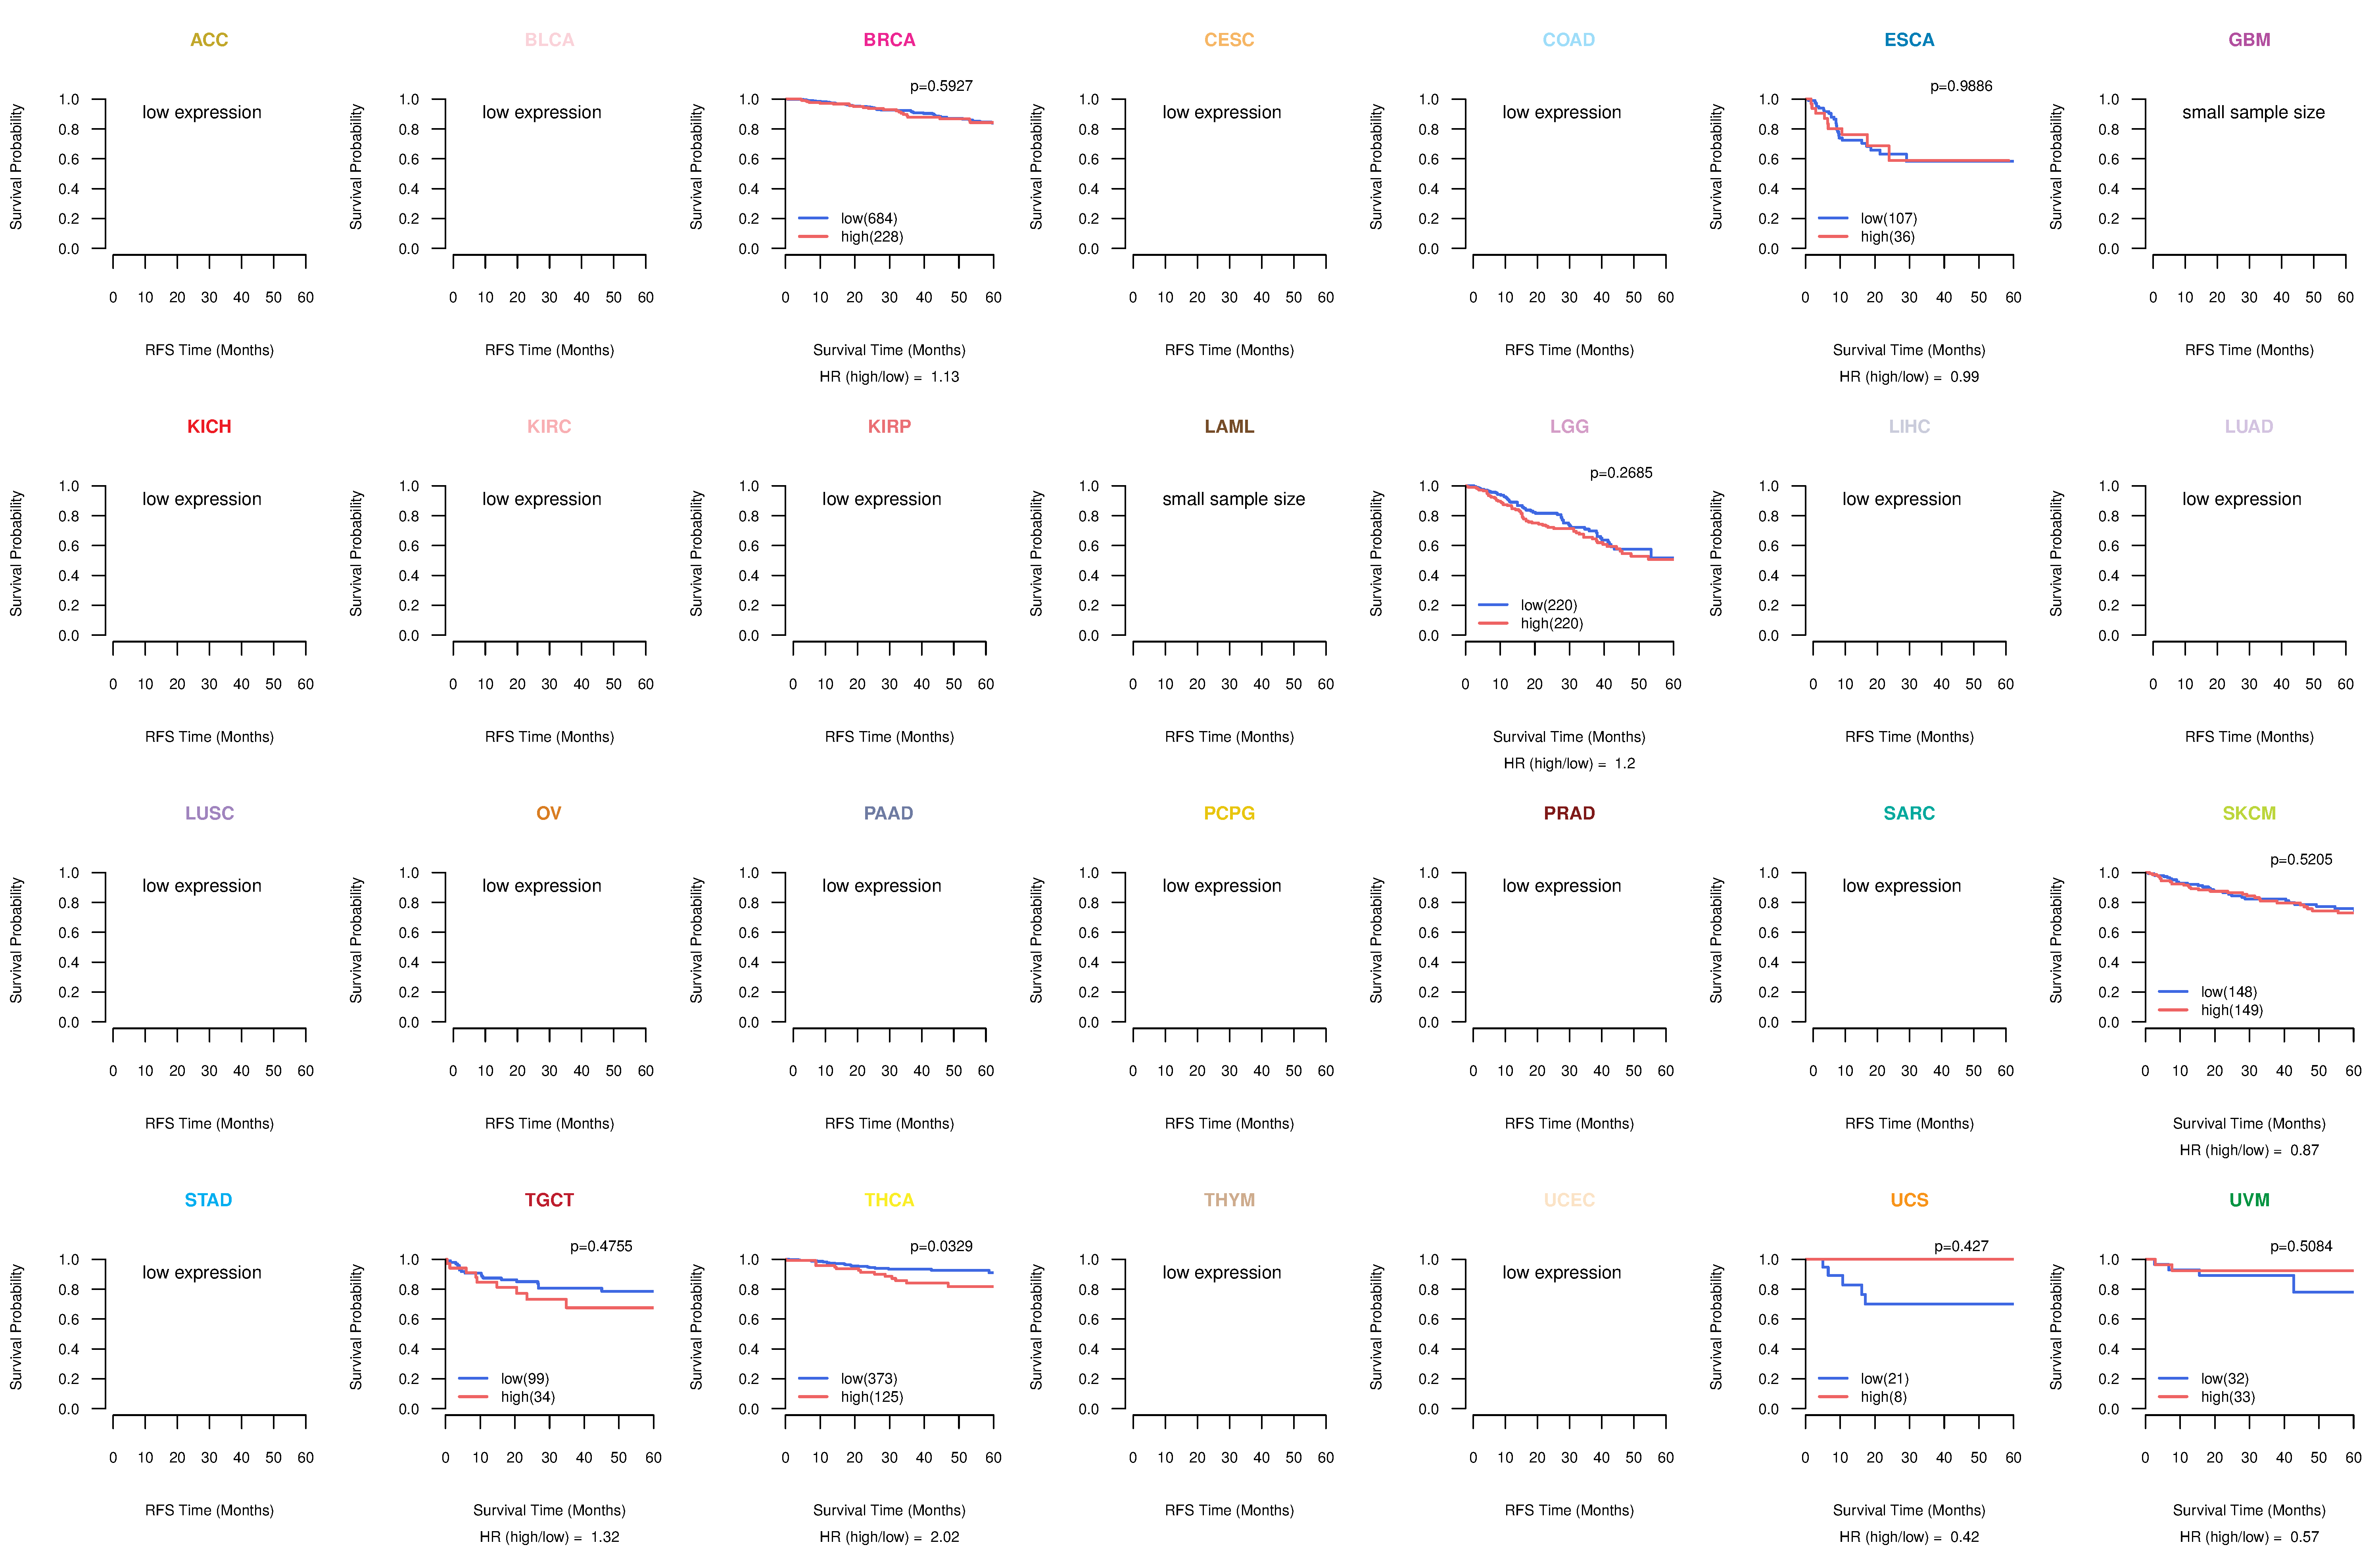
| Kaplan-Meier plots with logrank test of relapse free survival (RFS) using 28 cancer types (TCGA IlluminaHiSeq_RNASeqV2, pan-cancer normalized log2(norm_counts+1) data, version 2016-08-16) (TCGA clinicalMatrix, phenotype data, version 2016-04-27) * Click on the image enlarge it in a new window. |
 |
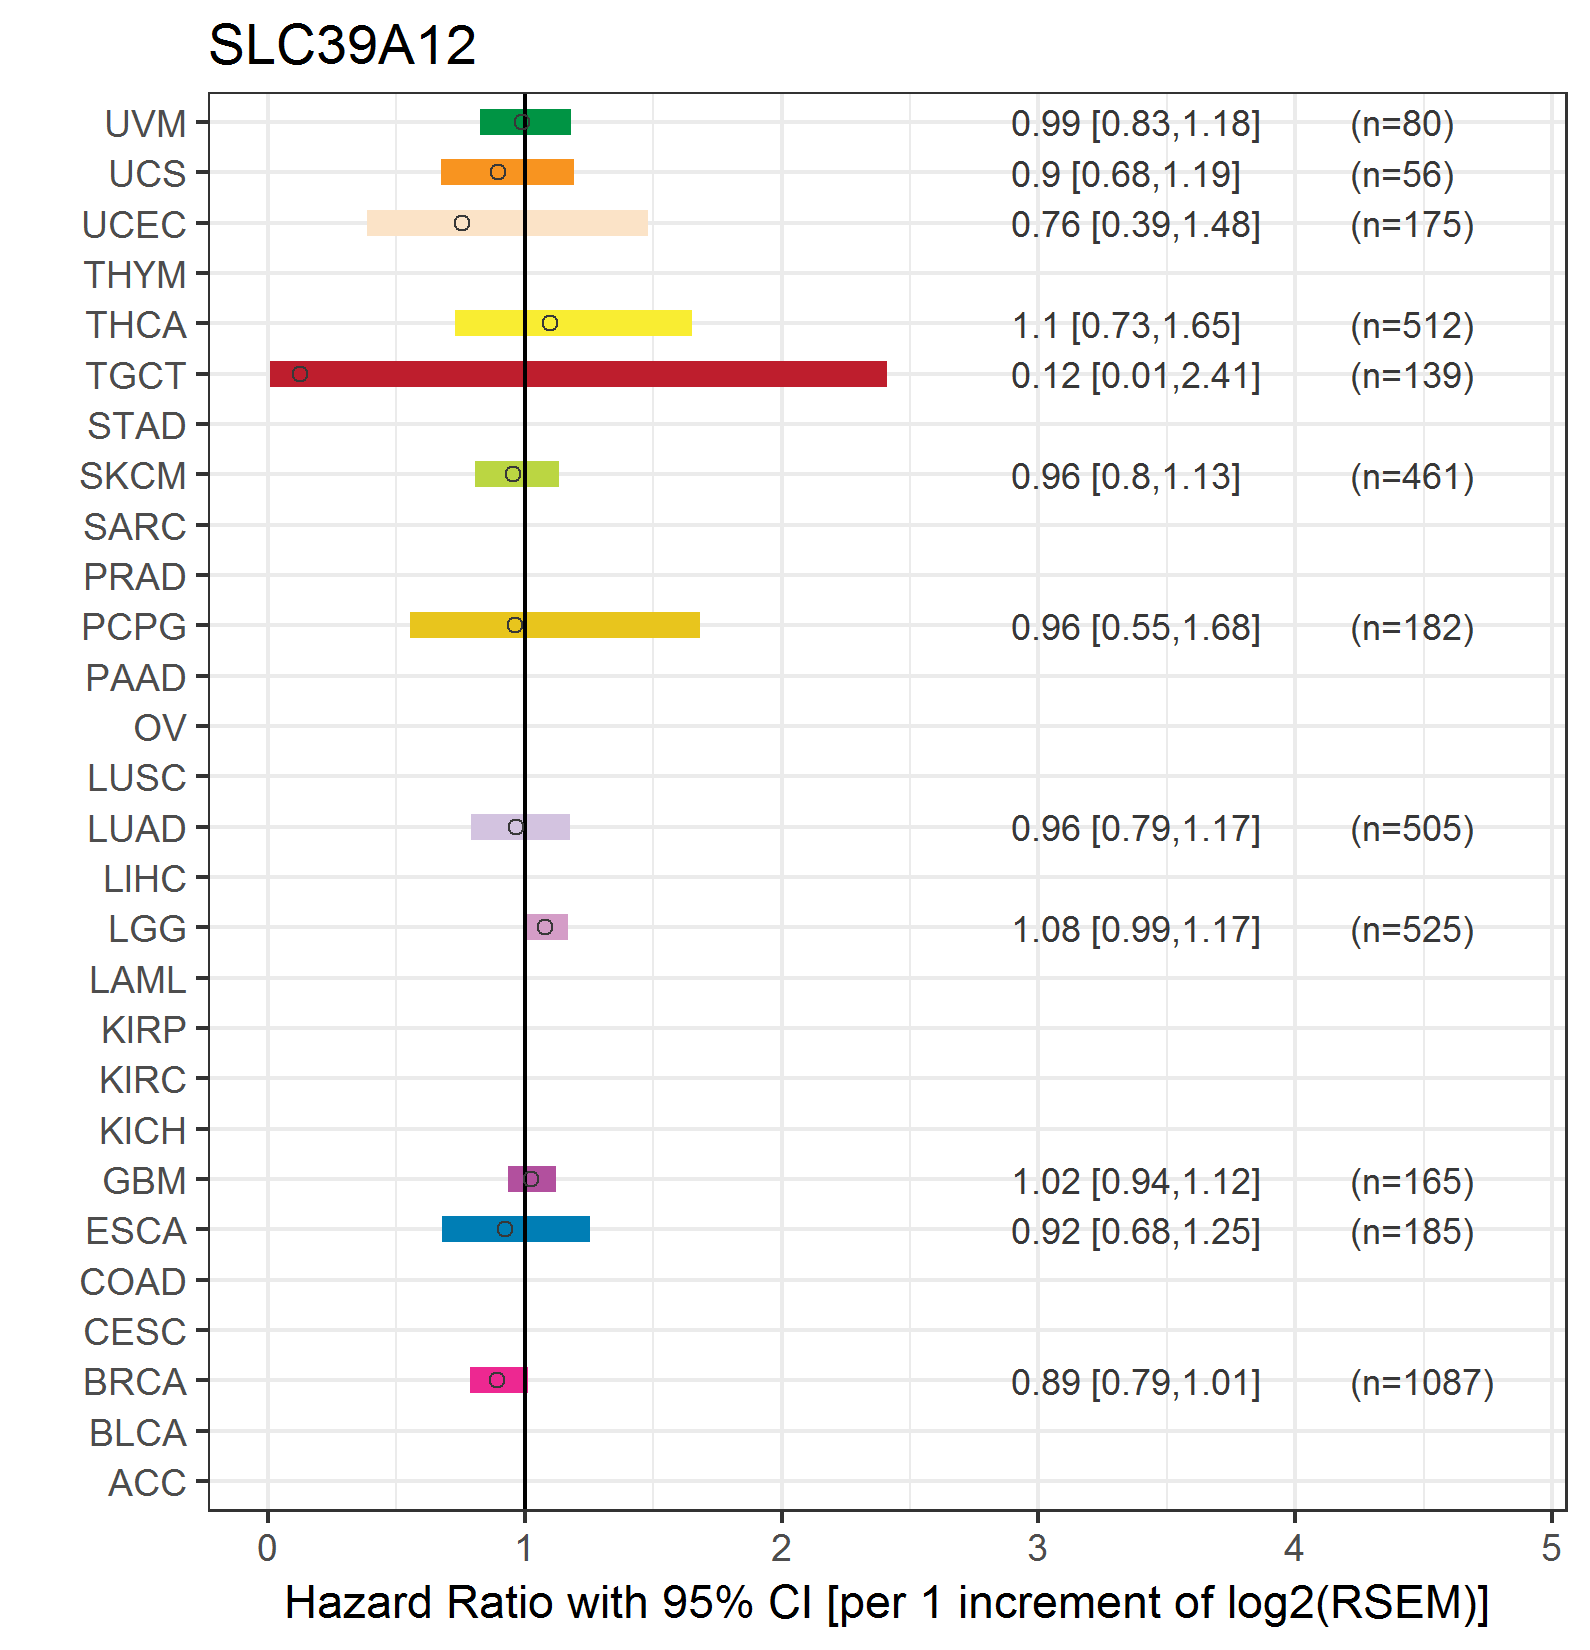
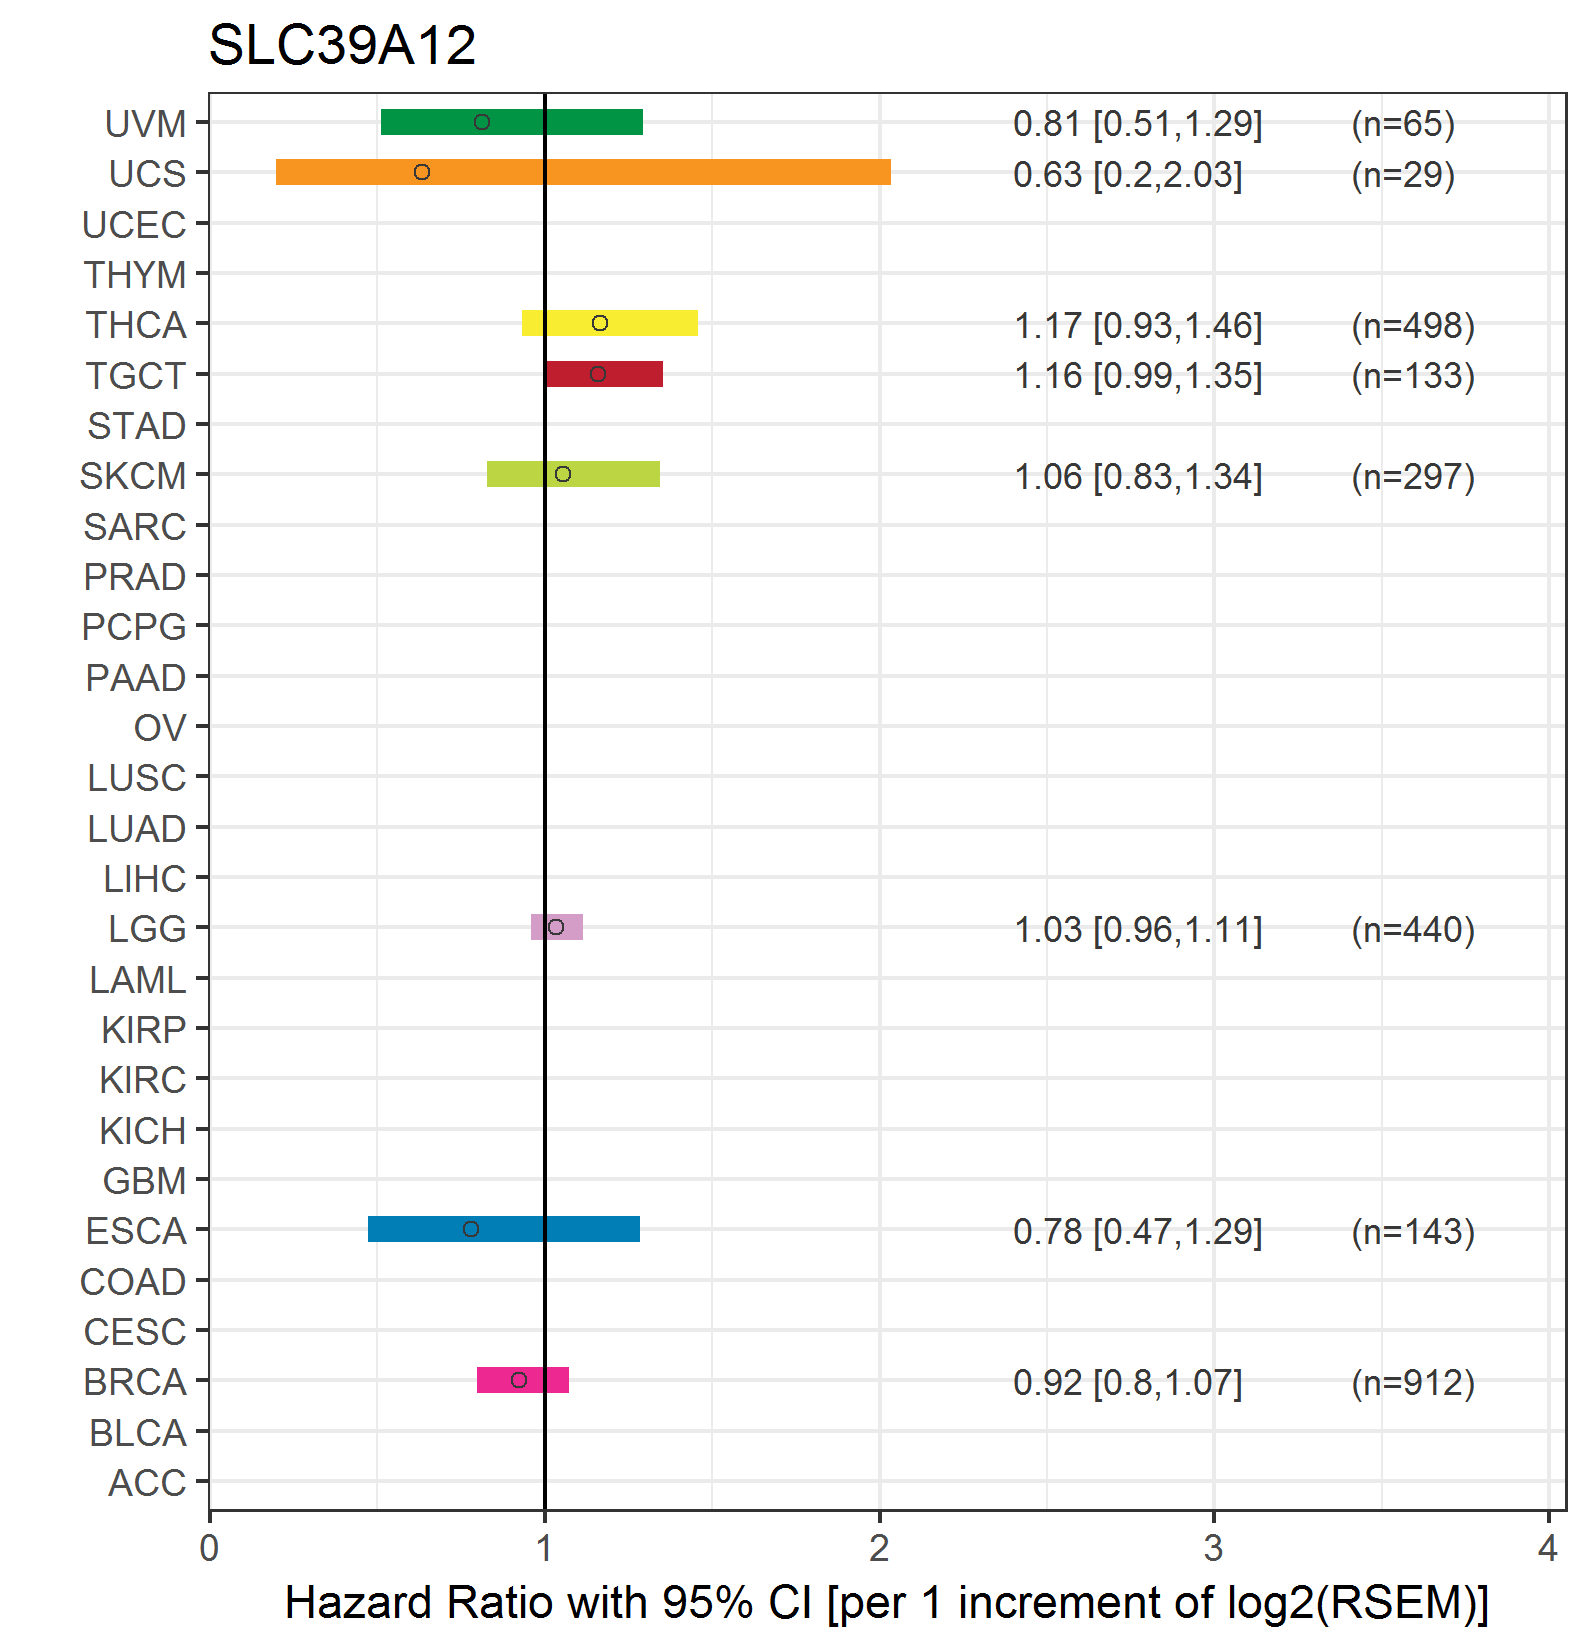
| Forest plot of Cox proportional hazard ratio (HR) and 95% CI of overall survival (OS) using 28 cancer types (TCGA IlluminaHiSeq_RNASeqV2, pan-cancer normalized log2(norm_counts+1) data, version 2016-08-16) (TCGA clinicalMatrix, phenotype data, version 2016-04-27) * Click on the image enlarge it in a new window. |
 |
| Forest plot of Cox proportional hazard ratio (HR) and 95% CI of relapse free survival (RFS) using 28 cancer types (TCGA IlluminaHiSeq_RNASeqV2, pan-cancer normalized log2(norm_counts+1) data, version 2016-08-16) (TCGA clinicalMatrix, phenotype data, version 2016-04-27) * Click on the image enlarge it in a new window. |
 |
| Top |
| TissGeneClin for SLC39A12 |
| TissGeneDrug for SLC39A12 |
| Drug information targeting TissGene (DrugBank Version 5.0.6, 2017-04-01) |
| DrugBank ID | Drug name | Drug activity | Drug type | Drug status |
| Top |
| TissGeneDisease for SLC39A12 |
| Disease information associated with TissGene (DisGeNet, 2016-06-01) |
| Disease ID | Disease name | # pubmeds | Source |
| umls:C0020538 | Hypertensive disease | 1 | GAD |
| umls:C0020542 | Pulmonary Hypertension | 1 | BeFree |
| umls:C0021390 | Inflammatory Bowel Diseases | 1 | GAD |
| umls:C0025202 | melanoma | 1 | CTD_human |
| umls:C0040336 | Tobacco Use Disorder | 1 | GAD |
| umls:C0376358 | Malignant neoplasm of prostate | 1 | GAD |
| umls:C1271104 | Blood pressure finding | 1 | GAD |
| umls:C1272641 | Systemic arterial pressure | 1 | GAD |
|
Copyright 2016-Present - The University of Texas Health Science Center at Houston (UTHealth) Web File Viewing | How to Report, Fraud, Waste and Abuse | State of Texas | Statewide Search | Texas Homeland Security | Site Policies |