 |
| |
| |
| |
| |
| |
| |
|

| TissGeneSummary for SEMA3D |
 Gene summary Gene summary |
| Basic gene information | Gene symbol | SEMA3D |
| Gene name | sema domain, immunoglobulin domain (Ig), short basic domain, secreted, (semaphorin) 3D | |
| Synonyms | Sema-Z2|coll-2 | |
| Cytomap | UCSC genome browser: 7q21.11 | |
| Type of gene | protein-coding | |
| RefGenes | NM_152754.2, | |
| Description | collapsin 2semaphorin-3D | |
| Modification date | 20141207 | |
| dbXrefs | MIM : 609907 | |
| HGNC : HGNC | ||
| Ensembl : ENSG00000153993 | ||
| HPRD : 15321 | ||
| Vega : OTTHUMG00000154569 | ||
| Protein | UniProt: go to UniProt's Cross Reference DB Table | |
| Expression | CleanEX: HS_SEMA3D | |
| BioGPS: 223117 | ||
| Pathway | NCI Pathway Interaction Database: SEMA3D | |
| KEGG: SEMA3D | ||
| REACTOME: SEMA3D | ||
| Pathway Commons: SEMA3D | ||
| Context | iHOP: SEMA3D | |
| ligand binding site mutation search in PubMed: SEMA3D | ||
| UCL Cancer Institute: SEMA3D | ||
| Assigned class in TissGDB* | C | |
| Included tissue-specific gene expression resources | TiGER,GTEx | |
| Specific-tissues in normal samples (assigned by TissGDB using HPA, TiGER, and GTEx) | OvaryThyroid gland | |
| Cancer types related to the specific-tissues in cancer samples (assigned by TissGDB using TCGA) | OVTHCA | |
| Reference showing the relevant tissue of SEMA3D | ||
| Description by TissGene annotations | Cancer gene Have significant anti-correlated miRNA Fused withTSGene | |
| * Class A consists of genes with literature evidence and is part of the cTissGenes. Class B consists of only cTissGenes without additional evidence. The remaining genes belong to Class C. |
| Gene ontology having evidence of Inferred from Direct Assay (IDA) from Entrez |
| GO ID | GO term | PubMed ID |
| Top |
| TissGeneExp for SEMA3D |
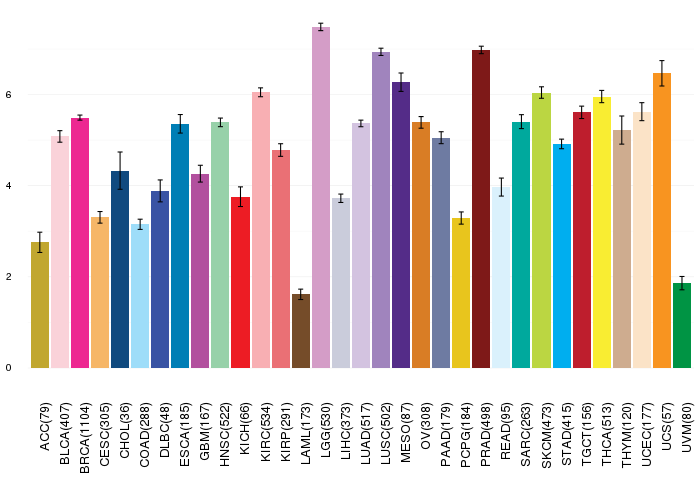
| Gene expressions across 28 cancer types (X-axis: cancer type and Y-axis: log2(norm_counts+1)) (TCGA IlluminaHiSeq_RNASeqV2, pan-cancer normalized log2(norm_counts+1) data, version 2016-08-16) |
 |
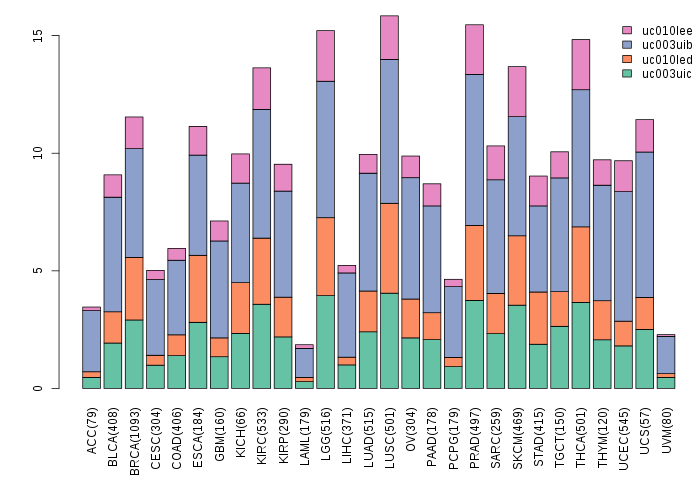
| Gene isoform expressions across 28 cancer types (X-axis: cancer type and Y-axis: log2(norm_counts+1)) (TCGA pan-cancer tcga_rsem_isoform_tpm, version 2016-09-01) |
 |
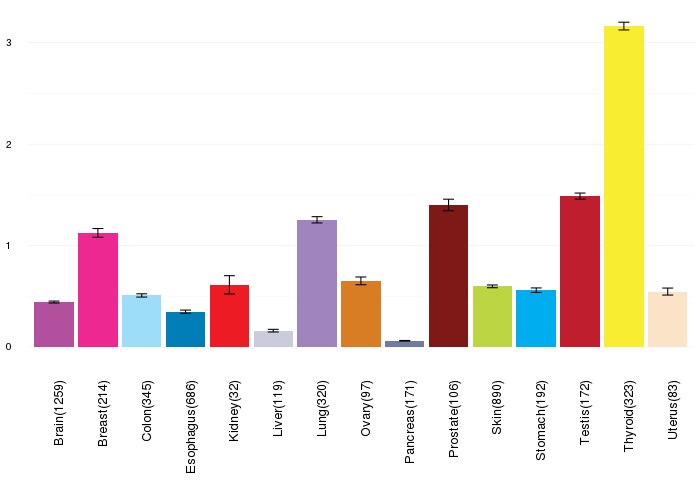
| Gene expressions across normal tissues of GTEx data (GTEx GTEx_Analysis_v6_RNA-seq_RNA-SeQCv1.1.8_gene_rpkm.gct) - Here, we shows the matched tissue types only among our 28 cancer types. |
 |
| Different expressions across 14 cancer types with more than 10 samples between matched tumors and normals (X-axis: cancer type and Y-axis: log2(norm_counts+1)) (TCGA IlluminaHiSeq_RNASeqV2, pan-cancer normalized log2(norm_counts+1) data, version 2016-08-16) |
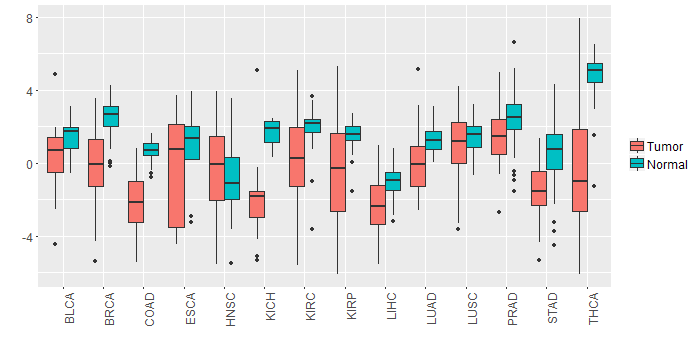 |
| - Significantly differentially expressed cancer types and information. (|Fold change|>1 and FDR<0.05) |
| Cancer type | Mean(exp) in tumor | Mean(exp) in matched normal | Log2FC | P-val. | FDR |
| THCA | -0.447822927 | 4.869353344 | -5.317176271 | 1.77E-19 | 5.94E-18 |
| BRCA | -0.087965657 | 2.494068554 | -2.582034211 | 2.87E-30 | 3.92E-29 |
| KIRC | 0.304621258 | 1.990424036 | -1.685802778 | 1.38E-07 | 3.81E-07 |
| LUAD | -0.029618924 | 1.277172455 | -1.306791379 | 7.37E-08 | 2.93E-07 |
| KICH | -2.084859131 | 1.696808869 | -3.781668 | 3.60E-10 | 2.53E-09 |
| LIHC | -2.364665131 | -1.110161131 | -1.254504 | 3.86E-06 | 1.83E-05 |
| COAD | -2.193601285 | 0.667144869 | -2.860746154 | 1.41E-09 | 1.51E-08 |
| KIRP | -0.371161381 | 1.516426119 | -1.8875875 | 0.000956 | 0.002649384 |
| STAD | -1.351836381 | 0.347076119 | -1.6989125 | 0.000266 | 0.001785773 |
| Top |
| TissGene-miRNA for SEMA3D |
| Significantly anti-correlated miRNAs of TissGene across 28 cancer types (Gene-miRNA relations from TargetScanHuman Relsease 7.1, Conserved_Site_Context_Scores.txt.zip, 06.01.2016) (TCGA IlluminaHiSeq_miRNASeq, log2(RPM+1) data, version 2016-11-21) (TCGA IlluminaHiSeq_RNASeqV2, log2(normalized_count+1) data, version 2016-08-16) (Spearman’s Rank Correlation (p-value<0.05 and coefficient<-0.25)) |
| Cancer type | miRNA id | miRNA accession | P-val. | Coeff. | # samples |
| ACC | hsa-miR-6838-5p | MIMAT0027578 | 0.014 | -0.29 | 78 |
| ACC | hsa-miR-6838-5p | MIMAT0027578 | 0.014 | -0.29 | 78 |
| ACC | hsa-miR-15b-5p | MIMAT0000417 | 0.0085 | -0.3 | 78 |
| ACC | hsa-miR-15b-5p | MIMAT0000417 | 0.0085 | -0.3 | 78 |
| Top |
| TissGeneMut for SEMA3D |
| TissGeneSNV for SEMA3D |
| nsSNV counts per each loci. Different colors of circles represent different cancer types. Circle size denotes number of samples. (TCGA somatic mutation (SNPs and small INDELs) data, version 2016-04-25) * Click on the image to enlarge it in a new window. |
 |
 |
| Somatic nucleotide variants of TissGene across 28 cancer types (X-axis: cancer type and Y-axis: % of mutated samples) The numbers in parentheses are numbers of samples with mutation (nsSNVs). (TCGA somatic mutation (SNPs and small INDELs) data, version 2016-04-25) |
 |
| - nsSNVs sorted by frequency. |
| AAchange | Cancer type | # samples |
| p.R760Q | SKCM | 5 |
| p.D704N | SKCM | 2 |
| p.T646M | UCEC | 2 |
| p.D186N | SKCM | 2 |
| p.P60L | SKCM | 2 |
| p.R762* | UCEC | 2 |
| p.S617F | SKCM | 1 |
| p.W554* | LUSC | 1 |
| p.R265S | ACC | 1 |
| p.D123H | UCEC | 1 |
| p.D327H | ESCA | 1 |
| p.Y537F | BLCA | 1 |
| p.S267A | BLCA | 1 |
| p.K478* | BRCA | 1 |
| p.A374S | LUSC | 1 |
| p.N744K | COAD | 1 |
| p.V493L | HNSC | 1 |
| p.I59N | ESCA | 1 |
| p.R572C | STAD | 1 |
| p.K758N | READ | 1 |
| p.M756T | UCEC | 1 |
| p.L304F | SKCM | 1 |
| p.E598X | COAD | 1 |
| p.R737K | LUAD | 1 |
| p.Q136* | BLCA | 1 |
| p.S608X | COAD | 1 |
| p.E588K | SKCM | 1 |
| p.I581V | PAAD | 1 |
| p.T471A | PAAD | 1 |
| p.R572H | STAD | 1 |
| p.R760Q | ESCA | 1 |
| p.K50* | LUAD | 1 |
| p.R710W | STAD | 1 |
| p.L727I | ACC | 1 |
| p.C534* | STAD | 1 |
| p.P395A | LUAD | 1 |
| p.P190L | SKCM | 1 |
| p.G179S | LUAD | 1 |
| p.D549Y | COAD | 1 |
| p.R760Q | COAD | 1 |
| p.R760Q | READ | 1 |
| p.L53M | CHOL | 1 |
| p.H502Q | ESCA | 1 |
| p.S272I | LUAD | 1 |
| p.K100T | READ | 1 |
| p.I581N | KIRC | 1 |
| p.K5E | ESCA | 1 |
| p.R628M | LUAD | 1 |
| p.K5E | LUAD | 1 |
| p.S726T | LUAD | 1 |
| p.R423W | ESCA | 1 |
| p.I90N | UCEC | 1 |
| p.Y428S | LUAD | 1 |
| p.I143R | LUAD | 1 |
| p.A776T | BLCA | 1 |
| p.G343E | SKCM | 1 |
| p.D549N | UCEC | 1 |
| p.R741I | PRAD | 1 |
| p.E77Q | LUAD | 1 |
| p.G747V | HNSC | 1 |
| p.G437V | LUAD | 1 |
| p.Y432D | BLCA | 1 |
| p.R423W | COAD | 1 |
| p.M689I | BLCA | 1 |
| p.A241T | COAD | 1 |
| p.N508T | STAD | 1 |
| p.R760Q | PRAD | 1 |
| p.R710W | PRAD | 1 |
| p.D543Y | ACC | 1 |
| p.S378N | LGG | 1 |
| p.P772S | LUAD | 1 |
| p.X778W | STAD | 1 |
| p.R572H | COAD | 1 |
| p.L95Q | STAD | 1 |
| p.D728N | LGG | 1 |
| p.I297M | BLCA | 1 |
| p.L53V | LUAD | 1 |
| p.R634* | UCEC | 1 |
| p.R229K | COAD | 1 |
| p.S206F | BLCA | 1 |
| p.P391S | SKCM | 1 |
| p.R653Q | SKCM | 1 |
| p.L705I | LUAD | 1 |
| p.P748S | LUAD | 1 |
| p.S566F | BLCA | 1 |
| p.V480I | STAD | 1 |
| p.K104M | LUAD | 1 |
| p.C534R | OV | 1 |
| p.R760Q | PAAD | 1 |
| p.N288K | STAD | 1 |
| p.P313L | SKCM | 1 |
| p.H152P | LUAD | 1 |
| p.K657R | DLBC | 1 |
| p.R217* | UCEC | 1 |
| p.P153A | LUAD | 1 |
| p.M1I | STAD | 1 |
| p.Q385* | UCEC | 1 |
| p.L171V | COAD | 1 |
| p.M23I | LUAD | 1 |
| p.F606C | STAD | 1 |
| p.C310W | PRAD | 1 |
| p.Y713C | LUAD | 1 |
| p.P372T | PAAD | 1 |
| p.S350F | STAD | 1 |
| p.E588K | BLCA | 1 |
| p.K751T | LIHC | 1 |
| p.H532N | LUAD | 1 |
| p.I587F | HNSC | 1 |
| p.I59F | LUAD | 1 |
| p.H235Y | SKCM | 1 |
| p.W750L | LIHC | 1 |
| p.H17Y | SKCM | 1 |
| p.L92P | LIHC | 1 |
| p.R762* | LUAD | 1 |
| p.T646M | COAD | 1 |
| p.E738* | BRCA | 1 |
| p.E288D | CESC | 1 |
| p.Q733* | UCEC | 1 |
| p.D446N | SARC | 1 |
| p.S274F | SKCM | 1 |
| p.D289N | SKCM | 1 |
| p.A558V | LIHC | 1 |
| p.S430F | SKCM | 1 |
| p.D380G | LIHC | 1 |
| p.R572H | UCEC | 1 |
| p.R411Q | SKCM | 1 |
| p.H633N | LUAD | 1 |
| p.N370S | ESCA | 1 |
| p.N2H | STAD | 1 |
| p.I614T | LIHC | 1 |
| p.F70V | READ | 1 |
| p.L93I | LUAD | 1 |
| p.R382C | HNSC | 1 |
| p.D364N | BLCA | 1 |
| p.S654R | ESCA | 1 |
| p.V527F | MESO | 1 |
| p.P313T | LUAD | 1 |
| p.R766G | BLCA | 1 |
| p.T126_splice | LUSC | 1 |
| p.E485K | UCEC | 1 |
| p.R281* | SKCM | 1 |
| p.R653* | UCEC | 1 |
| p.D186N | DLBC | 1 |
| p.D461V | LIHC | 1 |
| p.T346N | HNSC | 1 |
| p.R634P | OV | 1 |
| p.T196K | LIHC | 1 |
| p.Q385H | LUAD | 1 |
| p.R294H | OV | 1 |
| p.S590N | COAD | 1 |
| p.S26N | BLCA | 1 |
| p.R265C | SKCM | 1 |
| p.D589E | LUAD | 1 |
| p.R737W | LUAD | 1 |
| p.Y537H | PAAD | 1 |
| p.Q451R | CHOL | 1 |
| p.T213S | KIRC | 1 |
| Top |
| TissGeneCNV for SEMA3D |
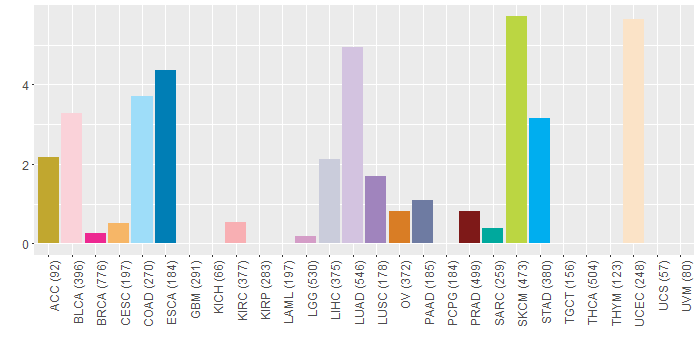
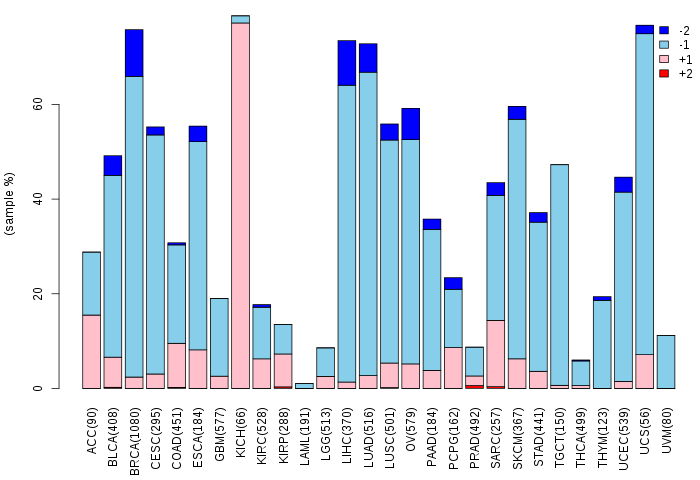
| Copy number variations of TissGene across 28 cancer types (X-axis: cancer type and Y-axis: % of CNV samples) (TCGA Gistic2_CopyNumber_Gistic2_all_data_by_genes, Gistic2 copy number data, version 2016-08-16) |
 |
| Top |
| TissGeneFusions for SEMA3D |
| Fusion genes including TissGene (ChimerDB 3.0, 2016-12-01 and TCGA fusion Portal 2015-12-01) |
| Database | Src | Cancer type | Sample | Fusion gene | ORF | 5'-gene BP | 3'-gene BP |
| Chimerdb3.0 | ChiTaRs | NA | AA248206 | NUCKS1-SEMA3D | chr1:205683081 | chr7:84628566 | |
| Chimerdb3.0 | FusionScan | LGG | TCGA-FG-5963-02A | DMTF1-SEMA3D | In-Frame | chr7:86800405 | chr7:84702397 |
| TCGAfusionPortal | PRADA | LGG | TCGA-FG-5963-01A | DMTF1-SEMA3D | In-frame | Chr7:86800405 | Chr7:84702397 |
| Top |
| TissGeneNet for SEMA3D |
| Co-expressed gene networks based on protein-protein interaction data (CePIN) (TCGA IlluminaHiSeq_RNASeqV2, pan-cancer normalized log2(norm_counts+1) data, version 2016-08-16) (PINA2 ppi data) |
| Top |
| TissGeneProg for SEMA3D |
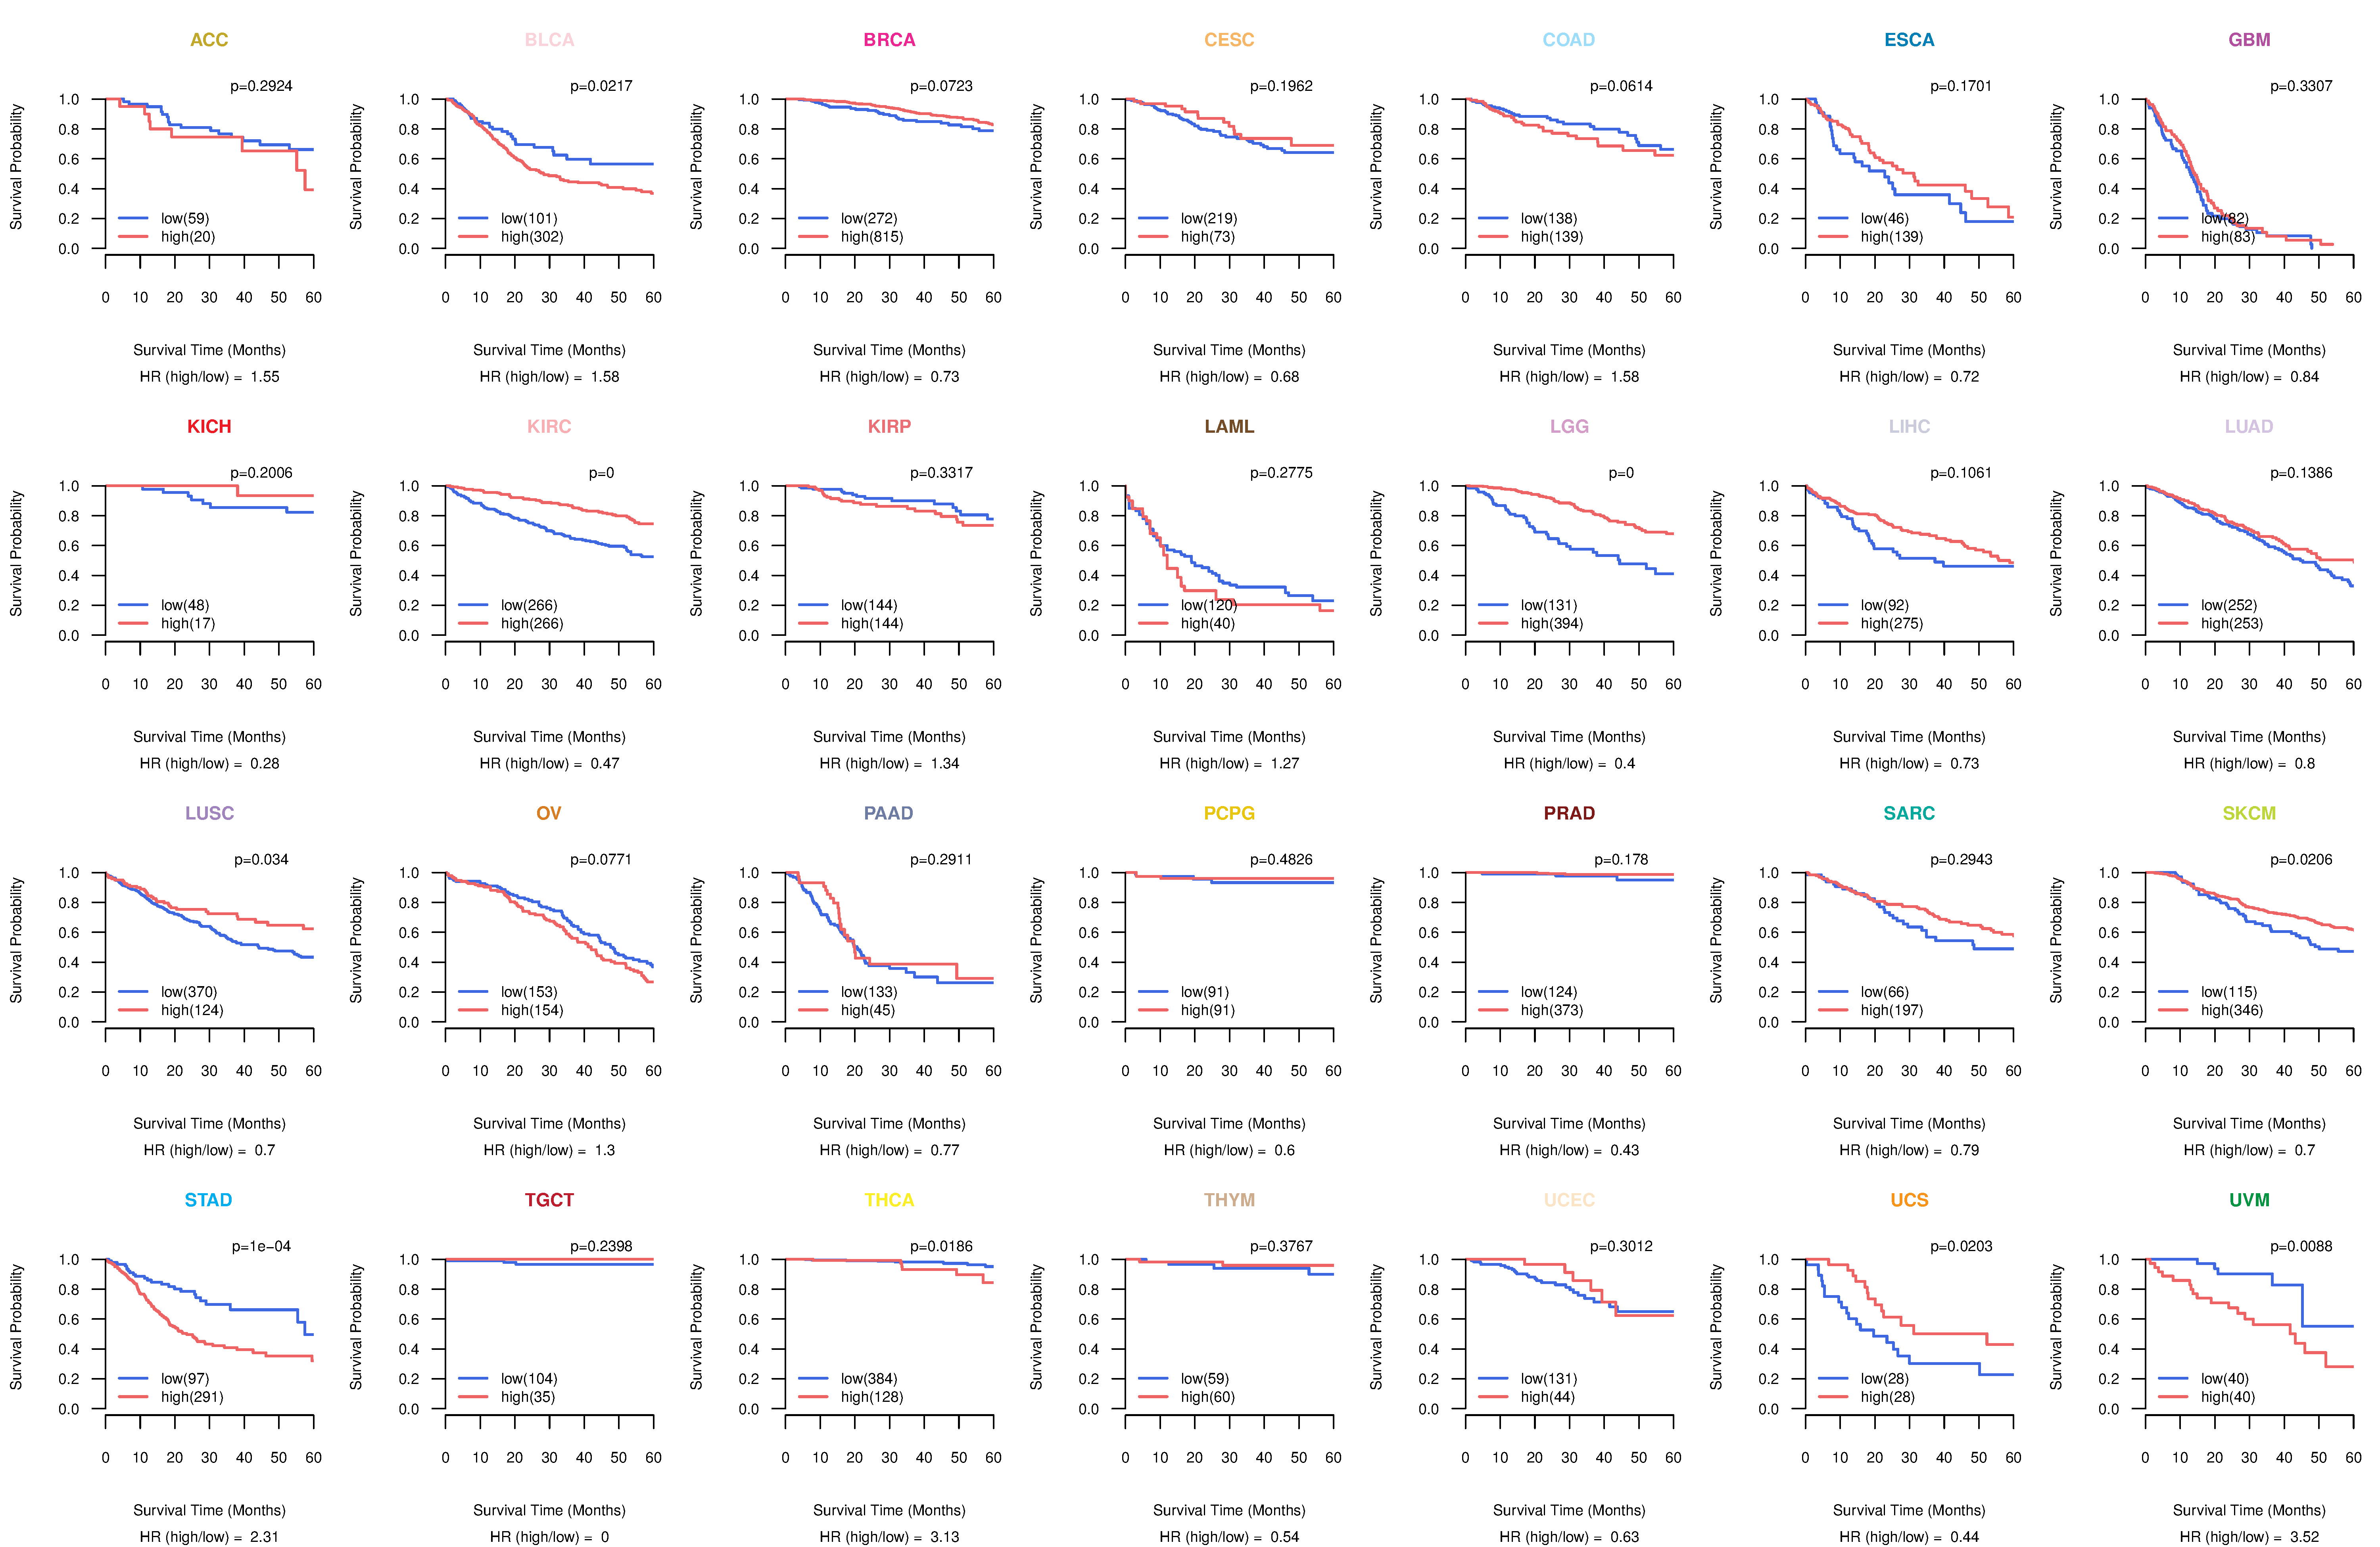
| Kaplan-Meier plots with logrank tests of overall survival (OS) using 28 cancer types (TCGA IlluminaHiSeq_RNASeqV2, pan-cancer normalized log2(norm_counts+1) data, version 2016-08-16) (TCGA clinicalMatrix, phenotype data, version 2016-04-27) * Click on the image to enlarge it in a new window. |
 |
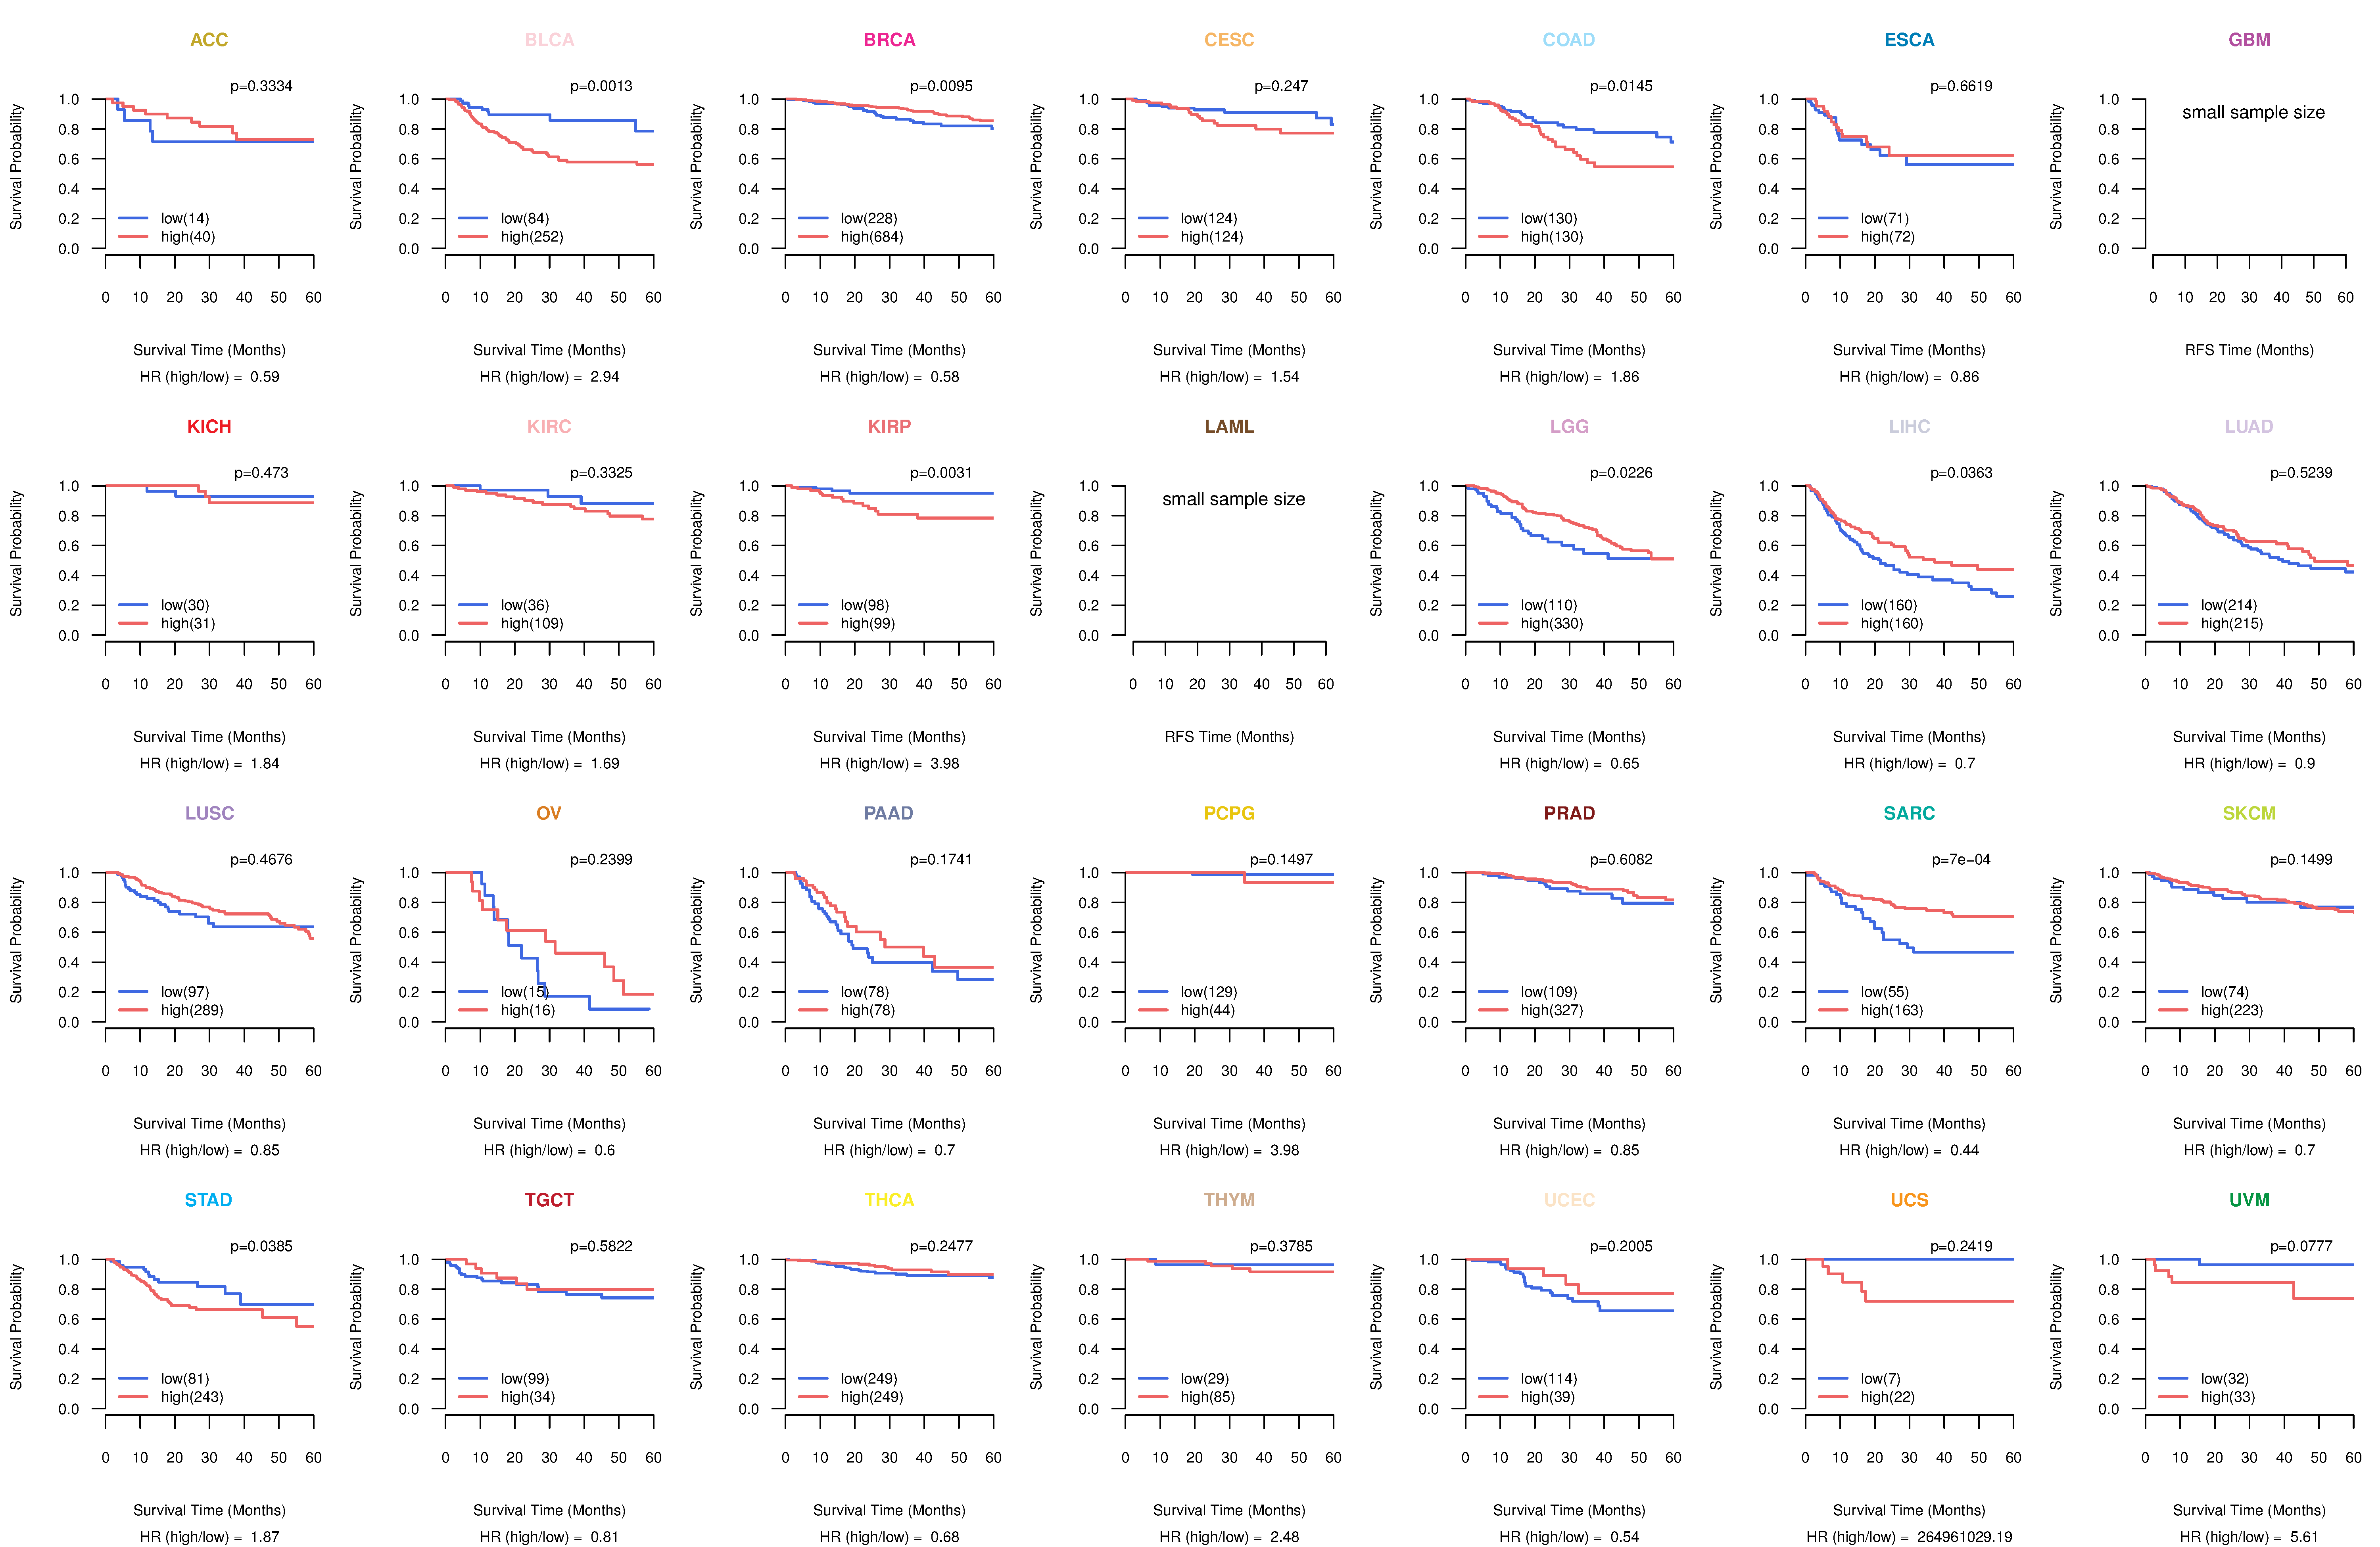
| Kaplan-Meier plots with logrank test of relapse free survival (RFS) using 28 cancer types (TCGA IlluminaHiSeq_RNASeqV2, pan-cancer normalized log2(norm_counts+1) data, version 2016-08-16) (TCGA clinicalMatrix, phenotype data, version 2016-04-27) * Click on the image enlarge it in a new window. |
 |
| Forest plot of Cox proportional hazard ratio (HR) and 95% CI of overall survival (OS) using 28 cancer types (TCGA IlluminaHiSeq_RNASeqV2, pan-cancer normalized log2(norm_counts+1) data, version 2016-08-16) (TCGA clinicalMatrix, phenotype data, version 2016-04-27) * Click on the image enlarge it in a new window. |
 |
| Forest plot of Cox proportional hazard ratio (HR) and 95% CI of relapse free survival (RFS) using 28 cancer types (TCGA IlluminaHiSeq_RNASeqV2, pan-cancer normalized log2(norm_counts+1) data, version 2016-08-16) (TCGA clinicalMatrix, phenotype data, version 2016-04-27) * Click on the image enlarge it in a new window. |
 |
| Top |
| TissGeneClin for SEMA3D |
| TissGeneDrug for SEMA3D |
| Drug information targeting TissGene (DrugBank Version 5.0.6, 2017-04-01) |
| DrugBank ID | Drug name | Drug activity | Drug type | Drug status |
| Top |
| TissGeneDisease for SEMA3D |
| Disease information associated with TissGene (DisGeNet, 2016-06-01) |
| Disease ID | Disease name | # pubmeds | Source |
| umls:C0036341 | Schizophrenia | 2 | BeFree,GAD |
| umls:C0004943 | Behcet Syndrome | 1 | GAD |
| umls:C0010068 | Coronary heart disease | 1 | BeFree |
| umls:C0015230 | Exanthema | 1 | BeFree |
| umls:C0017638 | Glioma | 1 | BeFree |
| umls:C0018798 | Congenital Heart Defects | 1 | BeFree |
| umls:C0019569 | Hirschsprung Disease | 1 | BeFree,ORPHANET |
| umls:C0567312 | Menopause present (finding) | 1 | GAD |
| umls:C0848332 | Spots on skin | 1 | BeFree |
| umls:C2931876 | Hirschsprung disease 1 | 1 | BeFree |
|
Copyright 2016-Present - The University of Texas Health Science Center at Houston (UTHealth) Web File Viewing | How to Report, Fraud, Waste and Abuse | State of Texas | Statewide Search | Texas Homeland Security | Site Policies |