 |
| |
| |
| |
| |
| |
| |
|

| TissGeneSummary for SPESP1 |
 Gene summary Gene summary |
| Basic gene information | Gene symbol | SPESP1 |
| Gene name | sperm equatorial segment protein 1 | |
| Synonyms | ESP|SP-ESP | |
| Cytomap | UCSC genome browser: 15q23 | |
| Type of gene | protein-coding | |
| RefGenes | NM_145658.3, | |
| Description | equatorial segment proteinglycosylated 38 kDa sperm protein C-7/8 | |
| Modification date | 20141207 | |
| dbXrefs | MIM : 609399 | |
| HGNC : HGNC | ||
| Ensembl : ENSG00000258484 | ||
| HPRD : 15436 | ||
| Vega : OTTHUMG00000133321 | ||
| Protein | UniProt: go to UniProt's Cross Reference DB Table | |
| Expression | CleanEX: HS_SPESP1 | |
| BioGPS: 246777 | ||
| Pathway | NCI Pathway Interaction Database: SPESP1 | |
| KEGG: SPESP1 | ||
| REACTOME: SPESP1 | ||
| Pathway Commons: SPESP1 | ||
| Context | iHOP: SPESP1 | |
| ligand binding site mutation search in PubMed: SPESP1 | ||
| UCL Cancer Institute: SPESP1 | ||
| Assigned class in TissGDB* | B | |
| Included tissue-specific gene expression resources | HPA,TiGER,GTEx | |
| Specific-tissues in normal samples (assigned by TissGDB using HPA, TiGER, and GTEx) | Testis | |
| Cancer types related to the specific-tissues in cancer samples (assigned by TissGDB using TCGA) | TGCT | |
| Reference showing the relevant tissue of SPESP1 | ||
| Description by TissGene annotations | ||
| * Class A consists of genes with literature evidence and is part of the cTissGenes. Class B consists of only cTissGenes without additional evidence. The remaining genes belong to Class C. |
| Gene ontology having evidence of Inferred from Direct Assay (IDA) from Entrez |
| GO ID | GO term | PubMed ID |
| Top |
| TissGeneExp for SPESP1 |
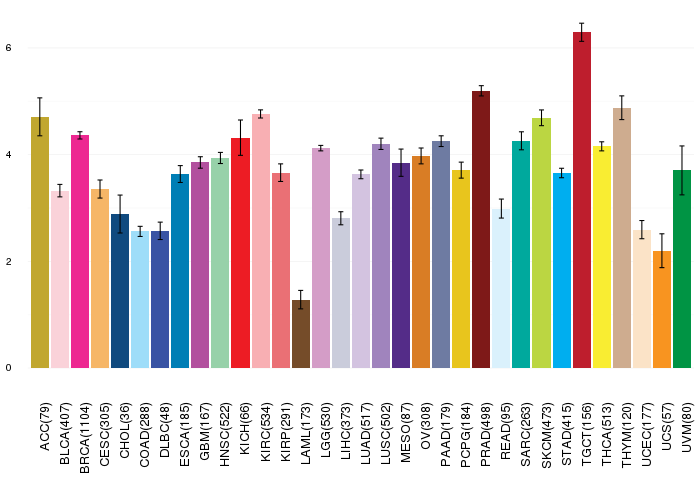
| Gene expressions across 28 cancer types (X-axis: cancer type and Y-axis: log2(norm_counts+1)) (TCGA IlluminaHiSeq_RNASeqV2, pan-cancer normalized log2(norm_counts+1) data, version 2016-08-16) |
 |
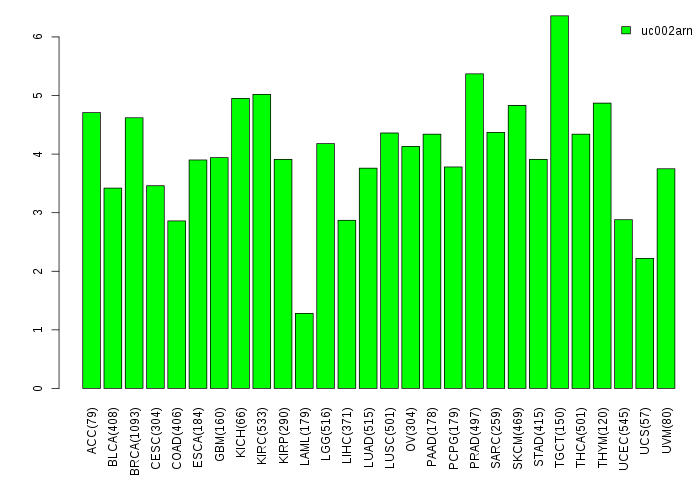
| Gene isoform expressions across 28 cancer types (X-axis: cancer type and Y-axis: log2(norm_counts+1)) (TCGA pan-cancer tcga_rsem_isoform_tpm, version 2016-09-01) |
 |
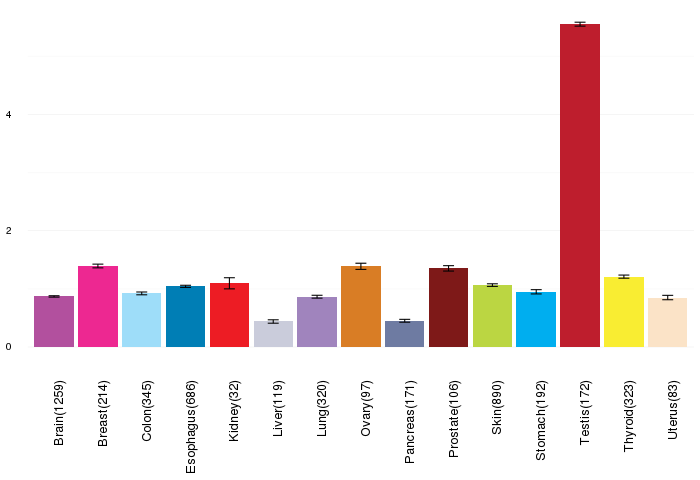
| Gene expressions across normal tissues of GTEx data (GTEx GTEx_Analysis_v6_RNA-seq_RNA-SeQCv1.1.8_gene_rpkm.gct) - Here, we shows the matched tissue types only among our 28 cancer types. |
 |
| Different expressions across 14 cancer types with more than 10 samples between matched tumors and normals (X-axis: cancer type and Y-axis: log2(norm_counts+1)) (TCGA IlluminaHiSeq_RNASeqV2, pan-cancer normalized log2(norm_counts+1) data, version 2016-08-16) |
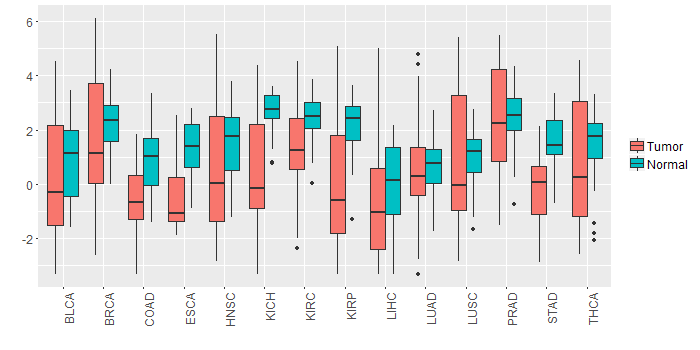 |
| - Significantly differentially expressed cancer types and information. (|Fold change|>1 and FDR<0.05) |
| Cancer type | Mean(exp) in tumor | Mean(exp) in matched normal | Log2FC | P-val. | FDR |
| KIRC | 1.391711794 | 2.458515961 | -1.066804167 | 2.79E-07 | 7.48E-07 |
| STAD | -0.073377442 | 1.609728808 | -1.68310625 | 9.61E-08 | 2.60E-06 |
| KIRP | 0.129019433 | 2.183519433 | -2.0545 | 0.000107 | 0.000361286 |
| COAD | -0.570464702 | 0.849639144 | -1.420103846 | 9.17E-05 | 0.000337105 |
| KICH | 0.421366683 | 2.666370683 | -2.245004 | 7.87E-05 | 0.000210503 |
| Top |
| TissGene-miRNA for SPESP1 |
| Significantly anti-correlated miRNAs of TissGene across 28 cancer types (Gene-miRNA relations from TargetScanHuman Relsease 7.1, Conserved_Site_Context_Scores.txt.zip, 06.01.2016) (TCGA IlluminaHiSeq_miRNASeq, log2(RPM+1) data, version 2016-11-21) (TCGA IlluminaHiSeq_RNASeqV2, log2(normalized_count+1) data, version 2016-08-16) (Spearman’s Rank Correlation (p-value<0.05 and coefficient<-0.25)) |
| Cancer type | miRNA id | miRNA accession | P-val. | Coeff. | # samples |
| Top |
| TissGeneMut for SPESP1 |
| TissGeneSNV for SPESP1 |
| nsSNV counts per each loci. Different colors of circles represent different cancer types. Circle size denotes number of samples. (TCGA somatic mutation (SNPs and small INDELs) data, version 2016-04-25) * Click on the image to enlarge it in a new window. |
 |
 |
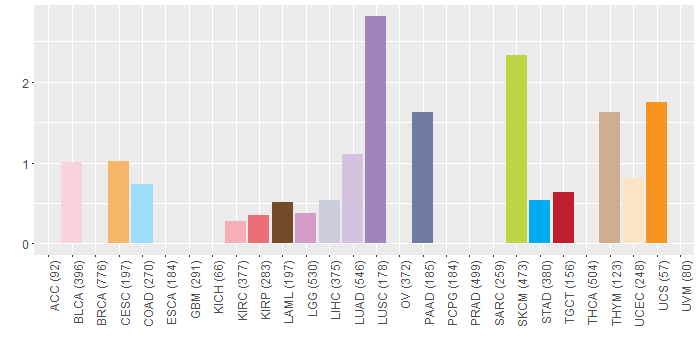
| Somatic nucleotide variants of TissGene across 28 cancer types (X-axis: cancer type and Y-axis: % of mutated samples) The numbers in parentheses are numbers of samples with mutation (nsSNVs). (TCGA somatic mutation (SNPs and small INDELs) data, version 2016-04-25) |
 |
| - nsSNVs sorted by frequency. |
| AAchange | Cancer type | # samples |
| p.F121L | BLCA | 2 |
| p.R45Q | SKCM | 2 |
| p.N247K | LUAD | 1 |
| p.M161I | LGG | 1 |
| p.P320L | KIRP | 1 |
| p.M337V | PAAD | 1 |
| p.E136G | LUAD | 1 |
| p.A68G | LUAD | 1 |
| p.E197K | SKCM | 1 |
| p.Q201K | THYM | 1 |
| p.R251T | BLCA | 1 |
| p.S340P | HNSC | 1 |
| p.R339G | COAD | 1 |
| p.R288Q | TGCT | 1 |
| p.K56T | LGG | 1 |
| p.F214L | UCS | 1 |
| p.K56E | STAD | 1 |
| p.V132L | LUAD | 1 |
| p.N87K | SKCM | 1 |
| p.P3S | SKCM | 1 |
| p.P108L | CESC | 1 |
| p.A158E | LUAD | 1 |
| p.A345T | STAD | 1 |
| p.I230N | LUAD | 1 |
| p.V181F | LUSC | 1 |
| p.E297Q | LIHC | 1 |
| p.P248Q | LUSC | 1 |
| p.P61Q | LUSC | 1 |
| p.V181L | KIRC | 1 |
| p.P126S | SKCM | 1 |
| p.L267I | COAD | 1 |
| p.A268T | BLCA | 1 |
| p.S15L | SKCM | 1 |
| p.R307I | LUSC | 1 |
| p.E272K | CESC | 1 |
| p.R263Q | LAML | 1 |
| p.P48L | SKCM | 1 |
| p.G81E | UCEC | 1 |
| p.H35Y | SKCM | 1 |
| p.A68T | PAAD | 1 |
| p.Q201R | UCEC | 1 |
| p.S187N | SKCM | 1 |
| p.E167* | HNSC | 1 |
| p.R342G | LIHC | 1 |
| p.A153V | THYM | 1 |
| p.Q238* | LUSC | 1 |
| p.L6F | SKCM | 1 |
| p.H80R | PAAD | 1 |
| Top |
| TissGeneCNV for SPESP1 |
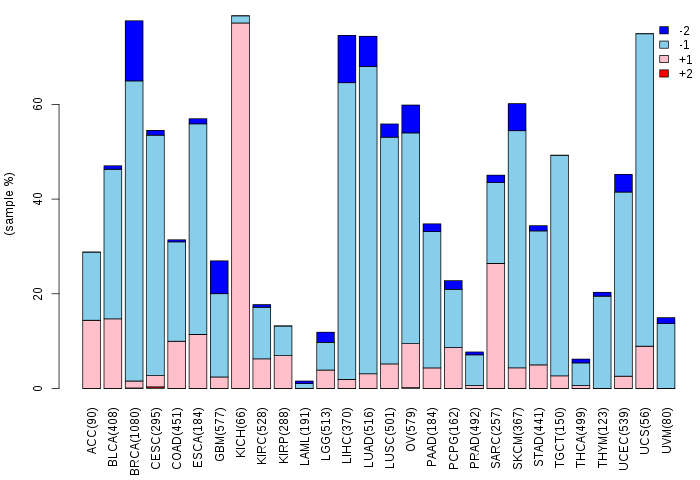
| Copy number variations of TissGene across 28 cancer types (X-axis: cancer type and Y-axis: % of CNV samples) (TCGA Gistic2_CopyNumber_Gistic2_all_data_by_genes, Gistic2 copy number data, version 2016-08-16) |
 |
| Top |
| TissGeneFusions for SPESP1 |
| Fusion genes including TissGene (ChimerDB 3.0, 2016-12-01 and TCGA fusion Portal 2015-12-01) |
| Database | Src | Cancer type | Sample | Fusion gene | ORF | 5'-gene BP | 3'-gene BP |
| TCGAfusionPortal | PRADA | BRCA | TCGA-A8-A09C-01A | GLCE-SPESP1 | 5UTR-CDS | Chr15:69453096 | Chr15:69237938 |
| Top |
| TissGeneNet for SPESP1 |
| Co-expressed gene networks based on protein-protein interaction data (CePIN) (TCGA IlluminaHiSeq_RNASeqV2, pan-cancer normalized log2(norm_counts+1) data, version 2016-08-16) (PINA2 ppi data) |
| Top |
| TissGeneProg for SPESP1 |
| Kaplan-Meier plots with logrank tests of overall survival (OS) using 28 cancer types (TCGA IlluminaHiSeq_RNASeqV2, pan-cancer normalized log2(norm_counts+1) data, version 2016-08-16) (TCGA clinicalMatrix, phenotype data, version 2016-04-27) * Click on the image to enlarge it in a new window. |
 |
| Kaplan-Meier plots with logrank test of relapse free survival (RFS) using 28 cancer types (TCGA IlluminaHiSeq_RNASeqV2, pan-cancer normalized log2(norm_counts+1) data, version 2016-08-16) (TCGA clinicalMatrix, phenotype data, version 2016-04-27) * Click on the image enlarge it in a new window. |
 |
| Forest plot of Cox proportional hazard ratio (HR) and 95% CI of overall survival (OS) using 28 cancer types (TCGA IlluminaHiSeq_RNASeqV2, pan-cancer normalized log2(norm_counts+1) data, version 2016-08-16) (TCGA clinicalMatrix, phenotype data, version 2016-04-27) * Click on the image enlarge it in a new window. |
 |
| Forest plot of Cox proportional hazard ratio (HR) and 95% CI of relapse free survival (RFS) using 28 cancer types (TCGA IlluminaHiSeq_RNASeqV2, pan-cancer normalized log2(norm_counts+1) data, version 2016-08-16) (TCGA clinicalMatrix, phenotype data, version 2016-04-27) * Click on the image enlarge it in a new window. |
 |
| Top |
| TissGeneClin for SPESP1 |
| TissGeneDrug for SPESP1 |
| Drug information targeting TissGene (DrugBank Version 5.0.6, 2017-04-01) |
| DrugBank ID | Drug name | Drug activity | Drug type | Drug status |
| Top |
| TissGeneDisease for SPESP1 |
| Disease information associated with TissGene (DisGeNet, 2016-06-01) |
| Disease ID | Disease name | # pubmeds | Source |
| umls:C0042029 | Urinary tract infection | 2 | BeFree |
| umls:C0004610 | Bacteremia | 1 | BeFree |
| umls:C0011860 | Diabetes Mellitus, Non-Insulin-Dependent | 1 | BeFree |
| umls:C0022658 | Kidney Diseases | 1 | BeFree |
| umls:C0022661 | Kidney Failure, Chronic | 1 | BeFree |
| umls:C0023467 | Leukemia, Myelocytic, Acute | 1 | BeFree |
| umls:C2316810 | Chronic kidney disease stage 5 | 1 | BeFree |
|
Copyright 2016-Present - The University of Texas Health Science Center at Houston (UTHealth) Web File Viewing | How to Report, Fraud, Waste and Abuse | State of Texas | Statewide Search | Texas Homeland Security | Site Policies |