 |
| |
| |
| |
| |
| |
| |
|

| TissGeneSummary for TTLL10 |
 Gene summary Gene summary |
| Basic gene information | Gene symbol | TTLL10 |
| Gene name | tubulin tyrosine ligase-like family, member 10 | |
| Synonyms | TTLL5 | |
| Cytomap | UCSC genome browser: 1p36.33 | |
| Type of gene | protein-coding | |
| RefGenes | NM_001130045.1, NM_153254.2, | |
| Description | inactive polyglycylase TTLL10tubulin tyrosine ligase-like family, member 5tubulin--tyrosine ligase-like protein 10 | |
| Modification date | 20141207 | |
| dbXrefs | HGNC : HGNC | |
| Ensembl : ENSG00000162571 | ||
| HPRD : 08771 | ||
| Vega : OTTHUMG00000000851 | ||
| Protein | UniProt: go to UniProt's Cross Reference DB Table | |
| Expression | CleanEX: HS_TTLL10 | |
| BioGPS: 254173 | ||
| Pathway | NCI Pathway Interaction Database: TTLL10 | |
| KEGG: TTLL10 | ||
| REACTOME: TTLL10 | ||
| Pathway Commons: TTLL10 | ||
| Context | iHOP: TTLL10 | |
| ligand binding site mutation search in PubMed: TTLL10 | ||
| UCL Cancer Institute: TTLL10 | ||
| Assigned class in TissGDB* | C | |
| Included tissue-specific gene expression resources | ||
| Specific-tissues in normal samples (assigned by TissGDB using HPA, TiGER, and GTEx) | Testis | |
| Cancer types related to the specific-tissues in cancer samples (assigned by TissGDB using TCGA) | TGCT | |
| Reference showing the relevant tissue of TTLL10 | ||
| Description by TissGene annotations | ||
| * Class A consists of genes with literature evidence and is part of the cTissGenes. Class B consists of only cTissGenes without additional evidence. The remaining genes belong to Class C. |
| Gene ontology having evidence of Inferred from Direct Assay (IDA) from Entrez |
| GO ID | GO term | PubMed ID | GO:0018094 | protein polyglycylation | 19524510 | GO:0018094 | protein polyglycylation | 19524510 |
| Top |
| TissGeneExp for TTLL10 |
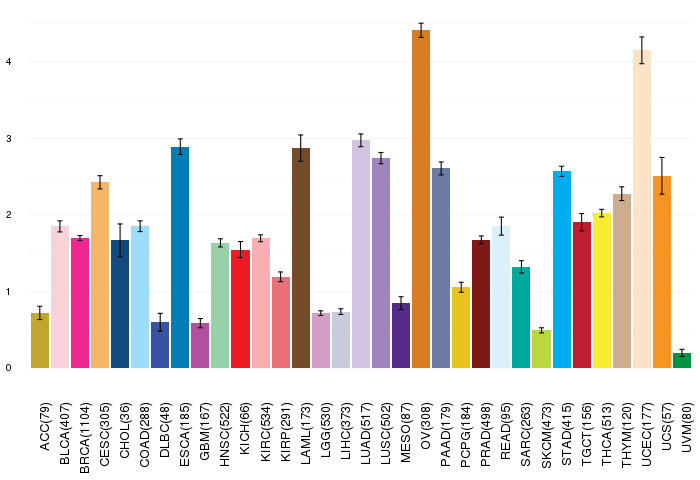
| Gene expressions across 28 cancer types (X-axis: cancer type and Y-axis: log2(norm_counts+1)) (TCGA IlluminaHiSeq_RNASeqV2, pan-cancer normalized log2(norm_counts+1) data, version 2016-08-16) |
 |
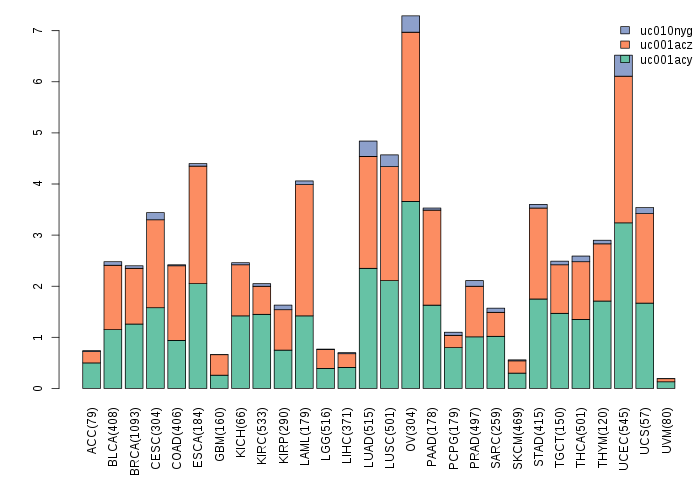
| Gene isoform expressions across 28 cancer types (X-axis: cancer type and Y-axis: log2(norm_counts+1)) (TCGA pan-cancer tcga_rsem_isoform_tpm, version 2016-09-01) |
 |
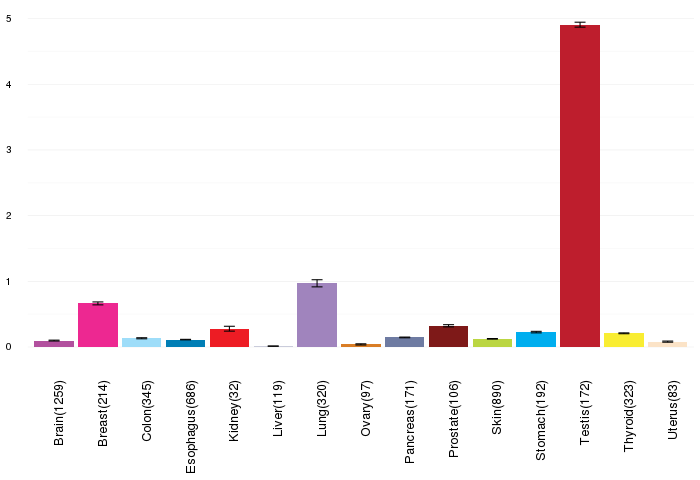
| Gene expressions across normal tissues of GTEx data (GTEx GTEx_Analysis_v6_RNA-seq_RNA-SeQCv1.1.8_gene_rpkm.gct) - Here, we shows the matched tissue types only among our 28 cancer types. |
 |
| Different expressions across 14 cancer types with more than 10 samples between matched tumors and normals (X-axis: cancer type and Y-axis: log2(norm_counts+1)) (TCGA IlluminaHiSeq_RNASeqV2, pan-cancer normalized log2(norm_counts+1) data, version 2016-08-16) |
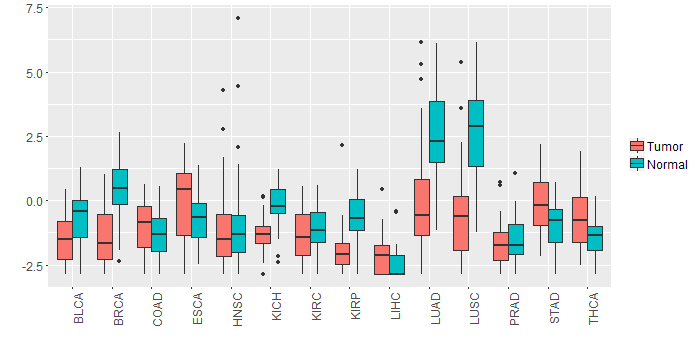 |
| - Significantly differentially expressed cancer types and information. (|Fold change|>1 and FDR<0.05) |
| Cancer type | Mean(exp) in tumor | Mean(exp) in matched normal | Log2FC | P-val. | FDR |
| KICH | -1.339326204 | -0.193234204 | -1.146092 | 1.72E-05 | 5.16E-05 |
| LUAD | -0.053572411 | 2.601903452 | -2.655475862 | 6.19E-12 | 4.45E-11 |
| LUSC | -0.652678361 | 2.58677262 | -3.23945098 | 4.81E-15 | 2.98E-14 |
| KIRP | -1.879595579 | -0.639308079 | -1.2402875 | 5.16E-06 | 2.26E-05 |
| BRCA | -1.435531818 | 0.445513796 | -1.881045614 | 1.02E-32 | 1.59E-31 |
| Top |
| TissGene-miRNA for TTLL10 |
| Significantly anti-correlated miRNAs of TissGene across 28 cancer types (Gene-miRNA relations from TargetScanHuman Relsease 7.1, Conserved_Site_Context_Scores.txt.zip, 06.01.2016) (TCGA IlluminaHiSeq_miRNASeq, log2(RPM+1) data, version 2016-11-21) (TCGA IlluminaHiSeq_RNASeqV2, log2(normalized_count+1) data, version 2016-08-16) (Spearman’s Rank Correlation (p-value<0.05 and coefficient<-0.25)) |
| Cancer type | miRNA id | miRNA accession | P-val. | Coeff. | # samples |
| Top |
| TissGeneMut for TTLL10 |
| TissGeneSNV for TTLL10 |
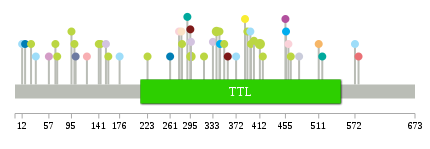
| nsSNV counts per each loci. Different colors of circles represent different cancer types. Circle size denotes number of samples. (TCGA somatic mutation (SNPs and small INDELs) data, version 2016-04-25) * Click on the image to enlarge it in a new window. |
 |
 |
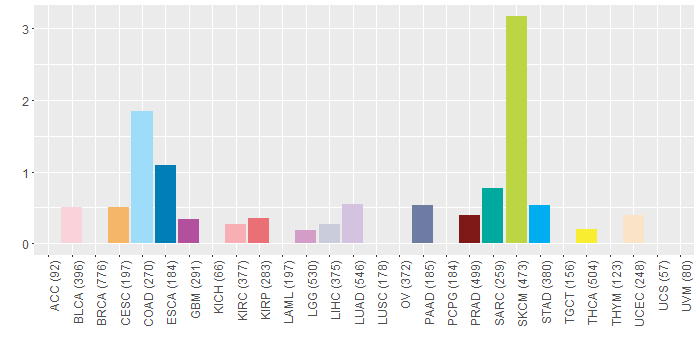
| Somatic nucleotide variants of TissGene across 28 cancer types (X-axis: cancer type and Y-axis: % of mutated samples) The numbers in parentheses are numbers of samples with mutation (nsSNVs). (TCGA somatic mutation (SNPs and small INDELs) data, version 2016-04-25) |
 |
| - nsSNVs sorted by frequency. |
| AAchange | Cancer type | # samples |
| p.D412N | SKCM | 3 |
| p.E296K | SKCM | 2 |
| p.D339N | SKCM | 2 |
| p.D387H | THCA | 1 |
| p.A517S | SARC | 1 |
| p.R396C | COAD | 1 |
| p.A358V | PRAD | 1 |
| p.Q276H | BLCA | 1 |
| p.E223K | SKCM | 1 |
| p.H295Q | PRAD | 1 |
| p.G320S | HNSC | 1 |
| p.R17Q | ESCA | 1 |
| p.T153S | LUAD | 1 |
| p.P352L | SKCM | 1 |
| p.R372H | COAD | 1 |
| p.A57T | LGG | 1 |
| p.L141F | SKCM | 1 |
| p.D345G | STAD | 1 |
| p.P572L | COAD | 1 |
| p.K255M | HNSC | 1 |
| p.G71E | SKCM | 1 |
| p.E511Q | CESC | 1 |
| p.R12Q | COAD | 1 |
| p.P157S | SKCM | 1 |
| p.A333V | LUAD | 1 |
| p.R280I | UCEC | 1 |
| p.E102V | PAAD | 1 |
| p.L68F | SKCM | 1 |
| p.D460H | BLCA | 1 |
| p.R455W | GBM | 1 |
| p.M281I | SKCM | 1 |
| p.M318I | SKCM | 1 |
| p.M391I | SKCM | 1 |
| p.G456S | STAD | 1 |
| p.E296D | LUAD | 1 |
| p.G95R | SKCM | 1 |
| p.A261S | ESCA | 1 |
| p.R35W | COAD | 1 |
| p.R35Q | READ | 1 |
| p.T402N | SKCM | 1 |
| p.T464I | SKCM | 1 |
| p.L344V | SKCM | 1 |
| p.D100N | SKCM | 1 |
| p.F478L | LIHC | 1 |
| p.D27N | SKCM | 1 |
| p.G578D | KIRP | 1 |
| p.R121W | KIRC | 1 |
| p.G144E | SKCM | 1 |
| p.R290C | SARC | 1 |
| p.V176A | COAD | 1 |
| p.L417V | SKCM | 1 |
| p.P397S | SKCM | 1 |
| Top |
| TissGeneCNV for TTLL10 |
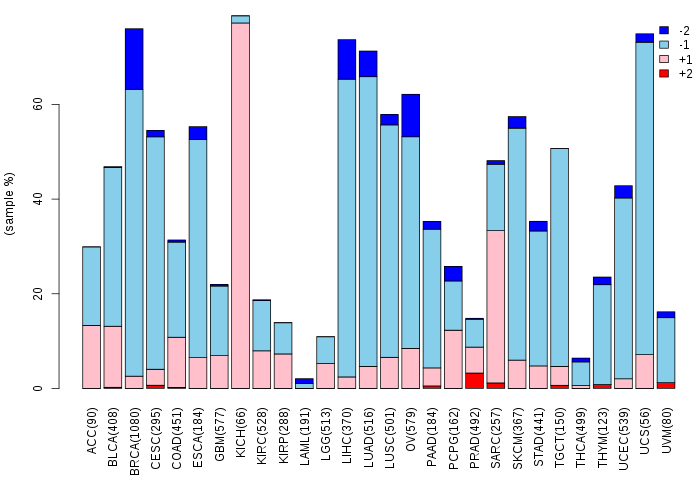
| Copy number variations of TissGene across 28 cancer types (X-axis: cancer type and Y-axis: % of CNV samples) (TCGA Gistic2_CopyNumber_Gistic2_all_data_by_genes, Gistic2 copy number data, version 2016-08-16) |
 |
| Top |
| TissGeneFusions for TTLL10 |
| Fusion genes including TissGene (ChimerDB 3.0, 2016-12-01 and TCGA fusion Portal 2015-12-01) |
| Database | Src | Cancer type | Sample | Fusion gene | ORF | 5'-gene BP | 3'-gene BP |
| Chimerdb3.0 | FusionScan | CESC | TCGA-Q1-A73P-01A | TTLL10-CTAG1B | Out-of-Frame | chr1:1120489 | chrX:153814784 |
| Top |
| TissGeneNet for TTLL10 |
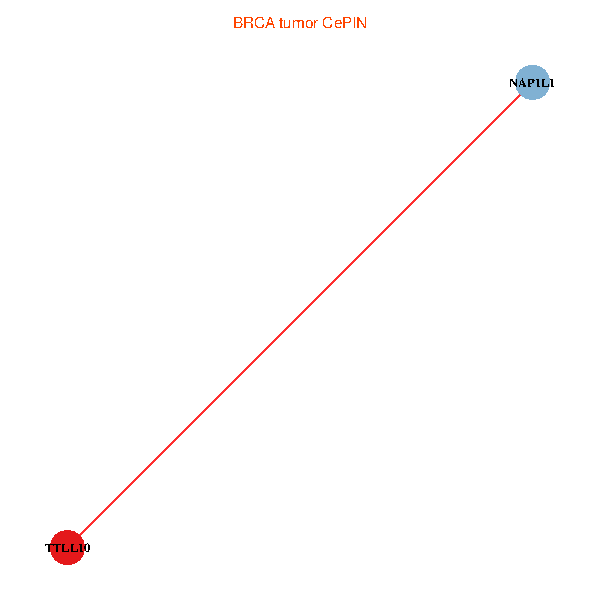
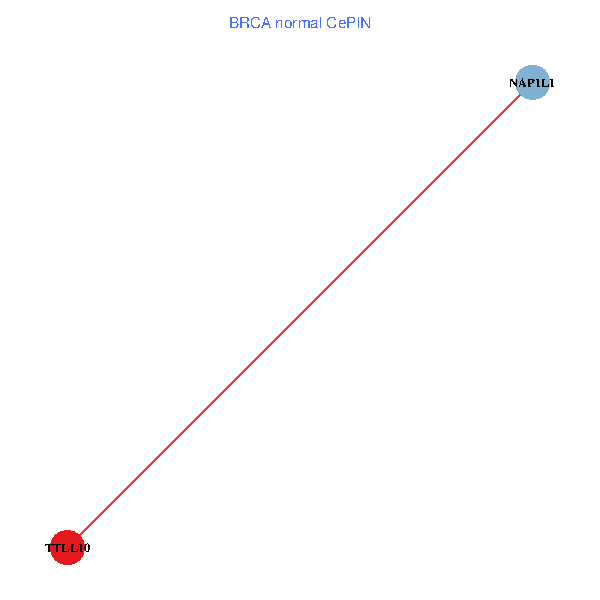
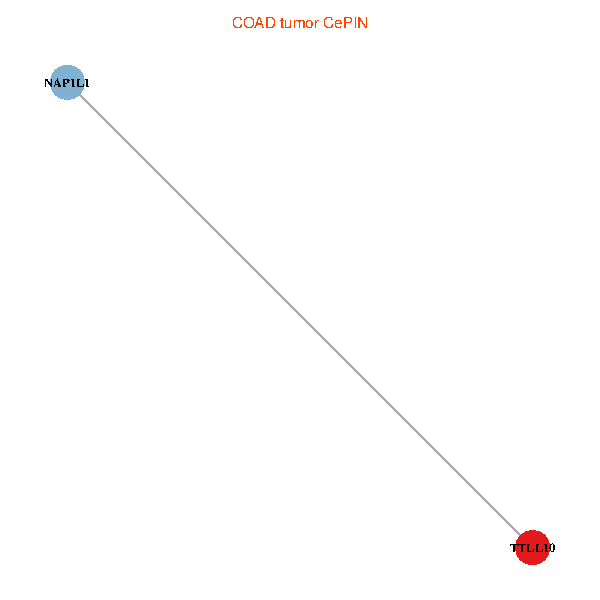
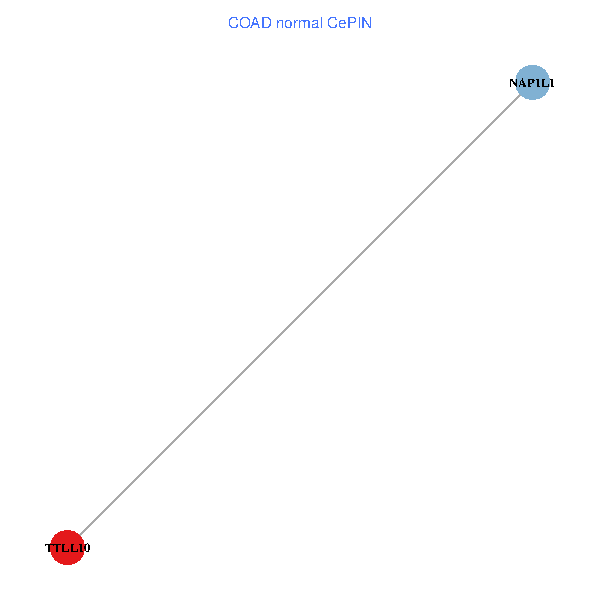
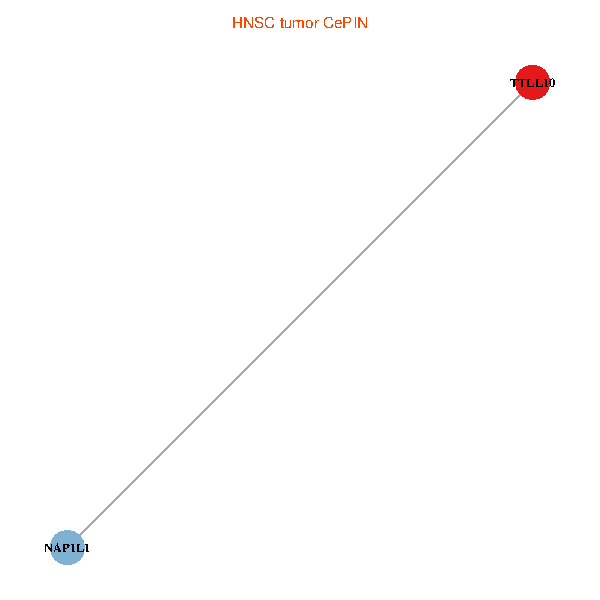
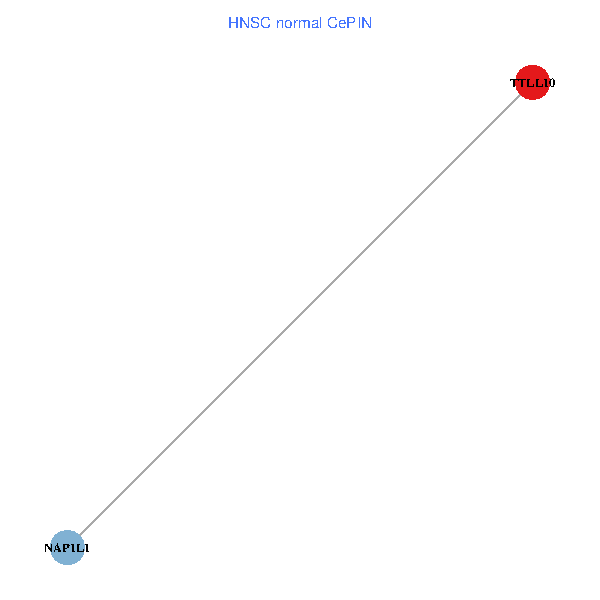
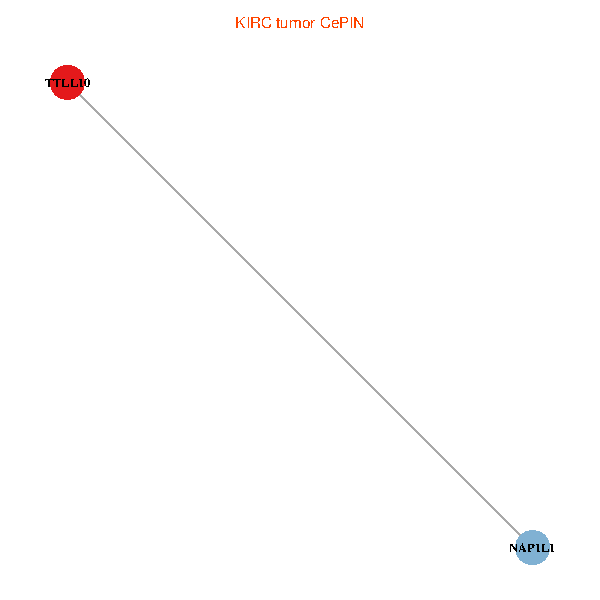
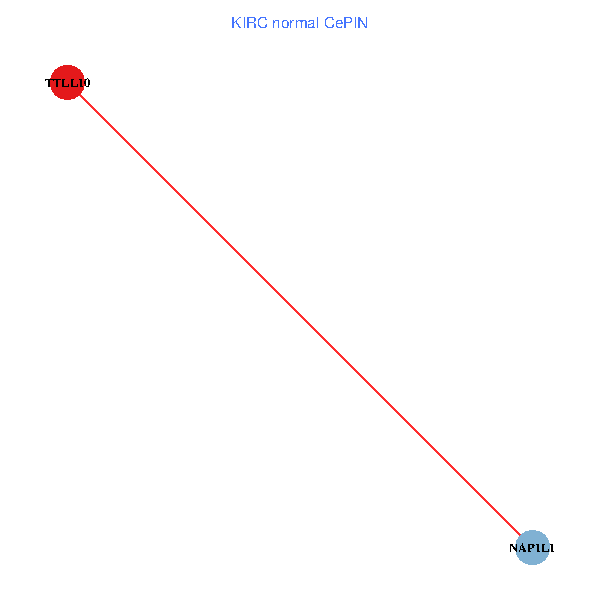
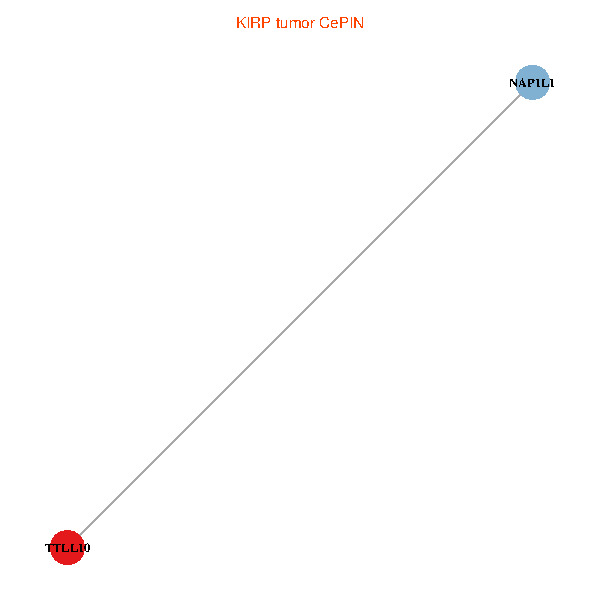
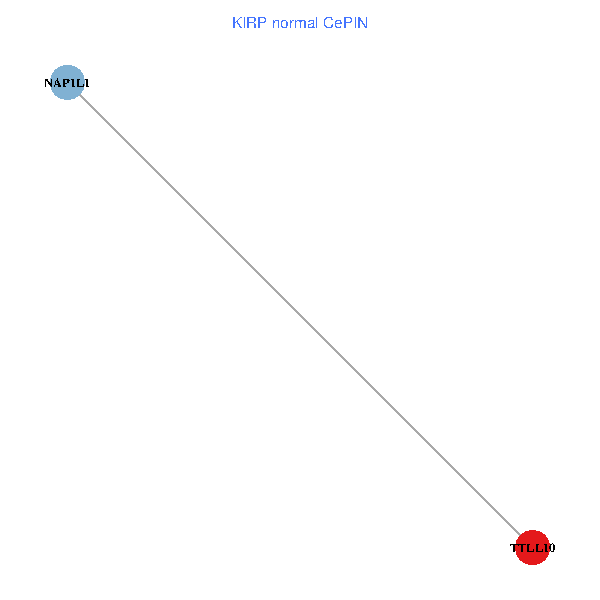
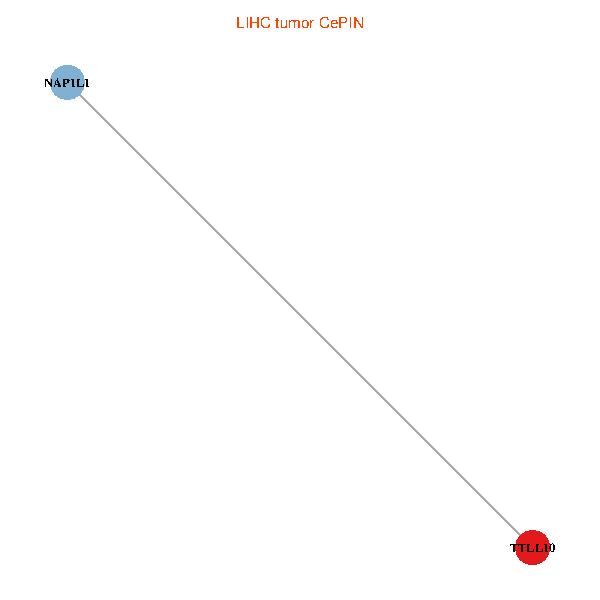
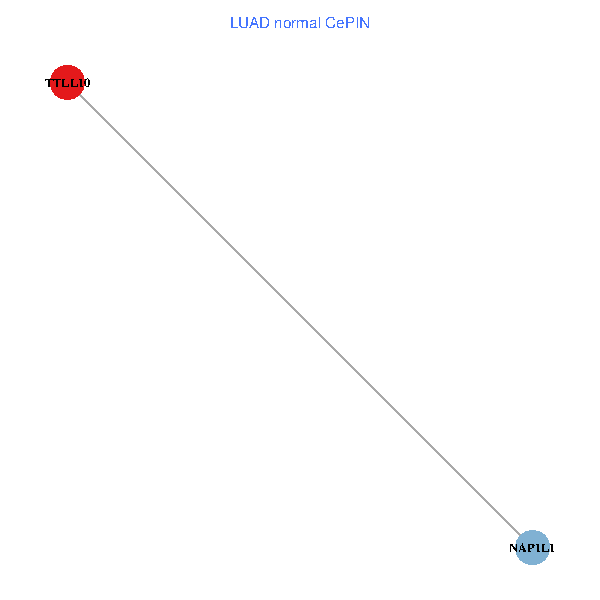
| Co-expressed gene networks based on protein-protein interaction data (CePIN) (TCGA IlluminaHiSeq_RNASeqV2, pan-cancer normalized log2(norm_counts+1) data, version 2016-08-16) (PINA2 ppi data) |
| BRCA (tumor) | BRCA (normal) |
| TTLL10, NAP1L1 (tumor) | TTLL10, NAP1L1 (normal) |
 |  |
| COAD (tumor) | COAD (normal) |
| TTLL10, NAP1L1 (tumor) | TTLL10, NAP1L1 (normal) |
 |  |
| HNSC (tumor) | HNSC (normal) |
| TTLL10, NAP1L1 (tumor) | TTLL10, NAP1L1 (normal) |
 |  |
| KICH (tumor) | KICH (normal) |
| TTLL10, NAP1L1 (tumor) | TTLL10, NAP1L1 (normal) |
 |  |
| KIRC (tumor) | KIRC (normal) |
| TTLL10, NAP1L1 (tumor) | TTLL10, NAP1L1 (normal) |
 |  |
| KIRP (tumor) | KIRP (normal) |
| TTLL10, NAP1L1 (tumor) | TTLL10, NAP1L1 (normal) |
 |  |
| LIHC (tumor) | LIHC (normal) |
| TTLL10, NAP1L1 (tumor) | TTLL10, NAP1L1 (normal) |
 |  |
| LUAD (tumor) | LUAD (normal) |
| TTLL10, NAP1L1 (tumor) | TTLL10, NAP1L1 (normal) |
 |  |
| LUSC (tumor) | LUSC (normal) |
| TTLL10, NAP1L1 (tumor) | TTLL10, NAP1L1 (normal) |
 |  |
| PRAD (tumor) | PRAD (normal) |
| TTLL10, NAP1L1 (tumor) | TTLL10, NAP1L1 (normal) |
 |  |
| STAD (tumor) | STAD (normal) |
| TTLL10, NAP1L1 (tumor) | TTLL10, NAP1L1 (normal) |
 |  |
| THCA (tumor) | THCA (normal) |
| TTLL10, NAP1L1 (tumor) | TTLL10, NAP1L1 (normal) |
 |  |
| Top |
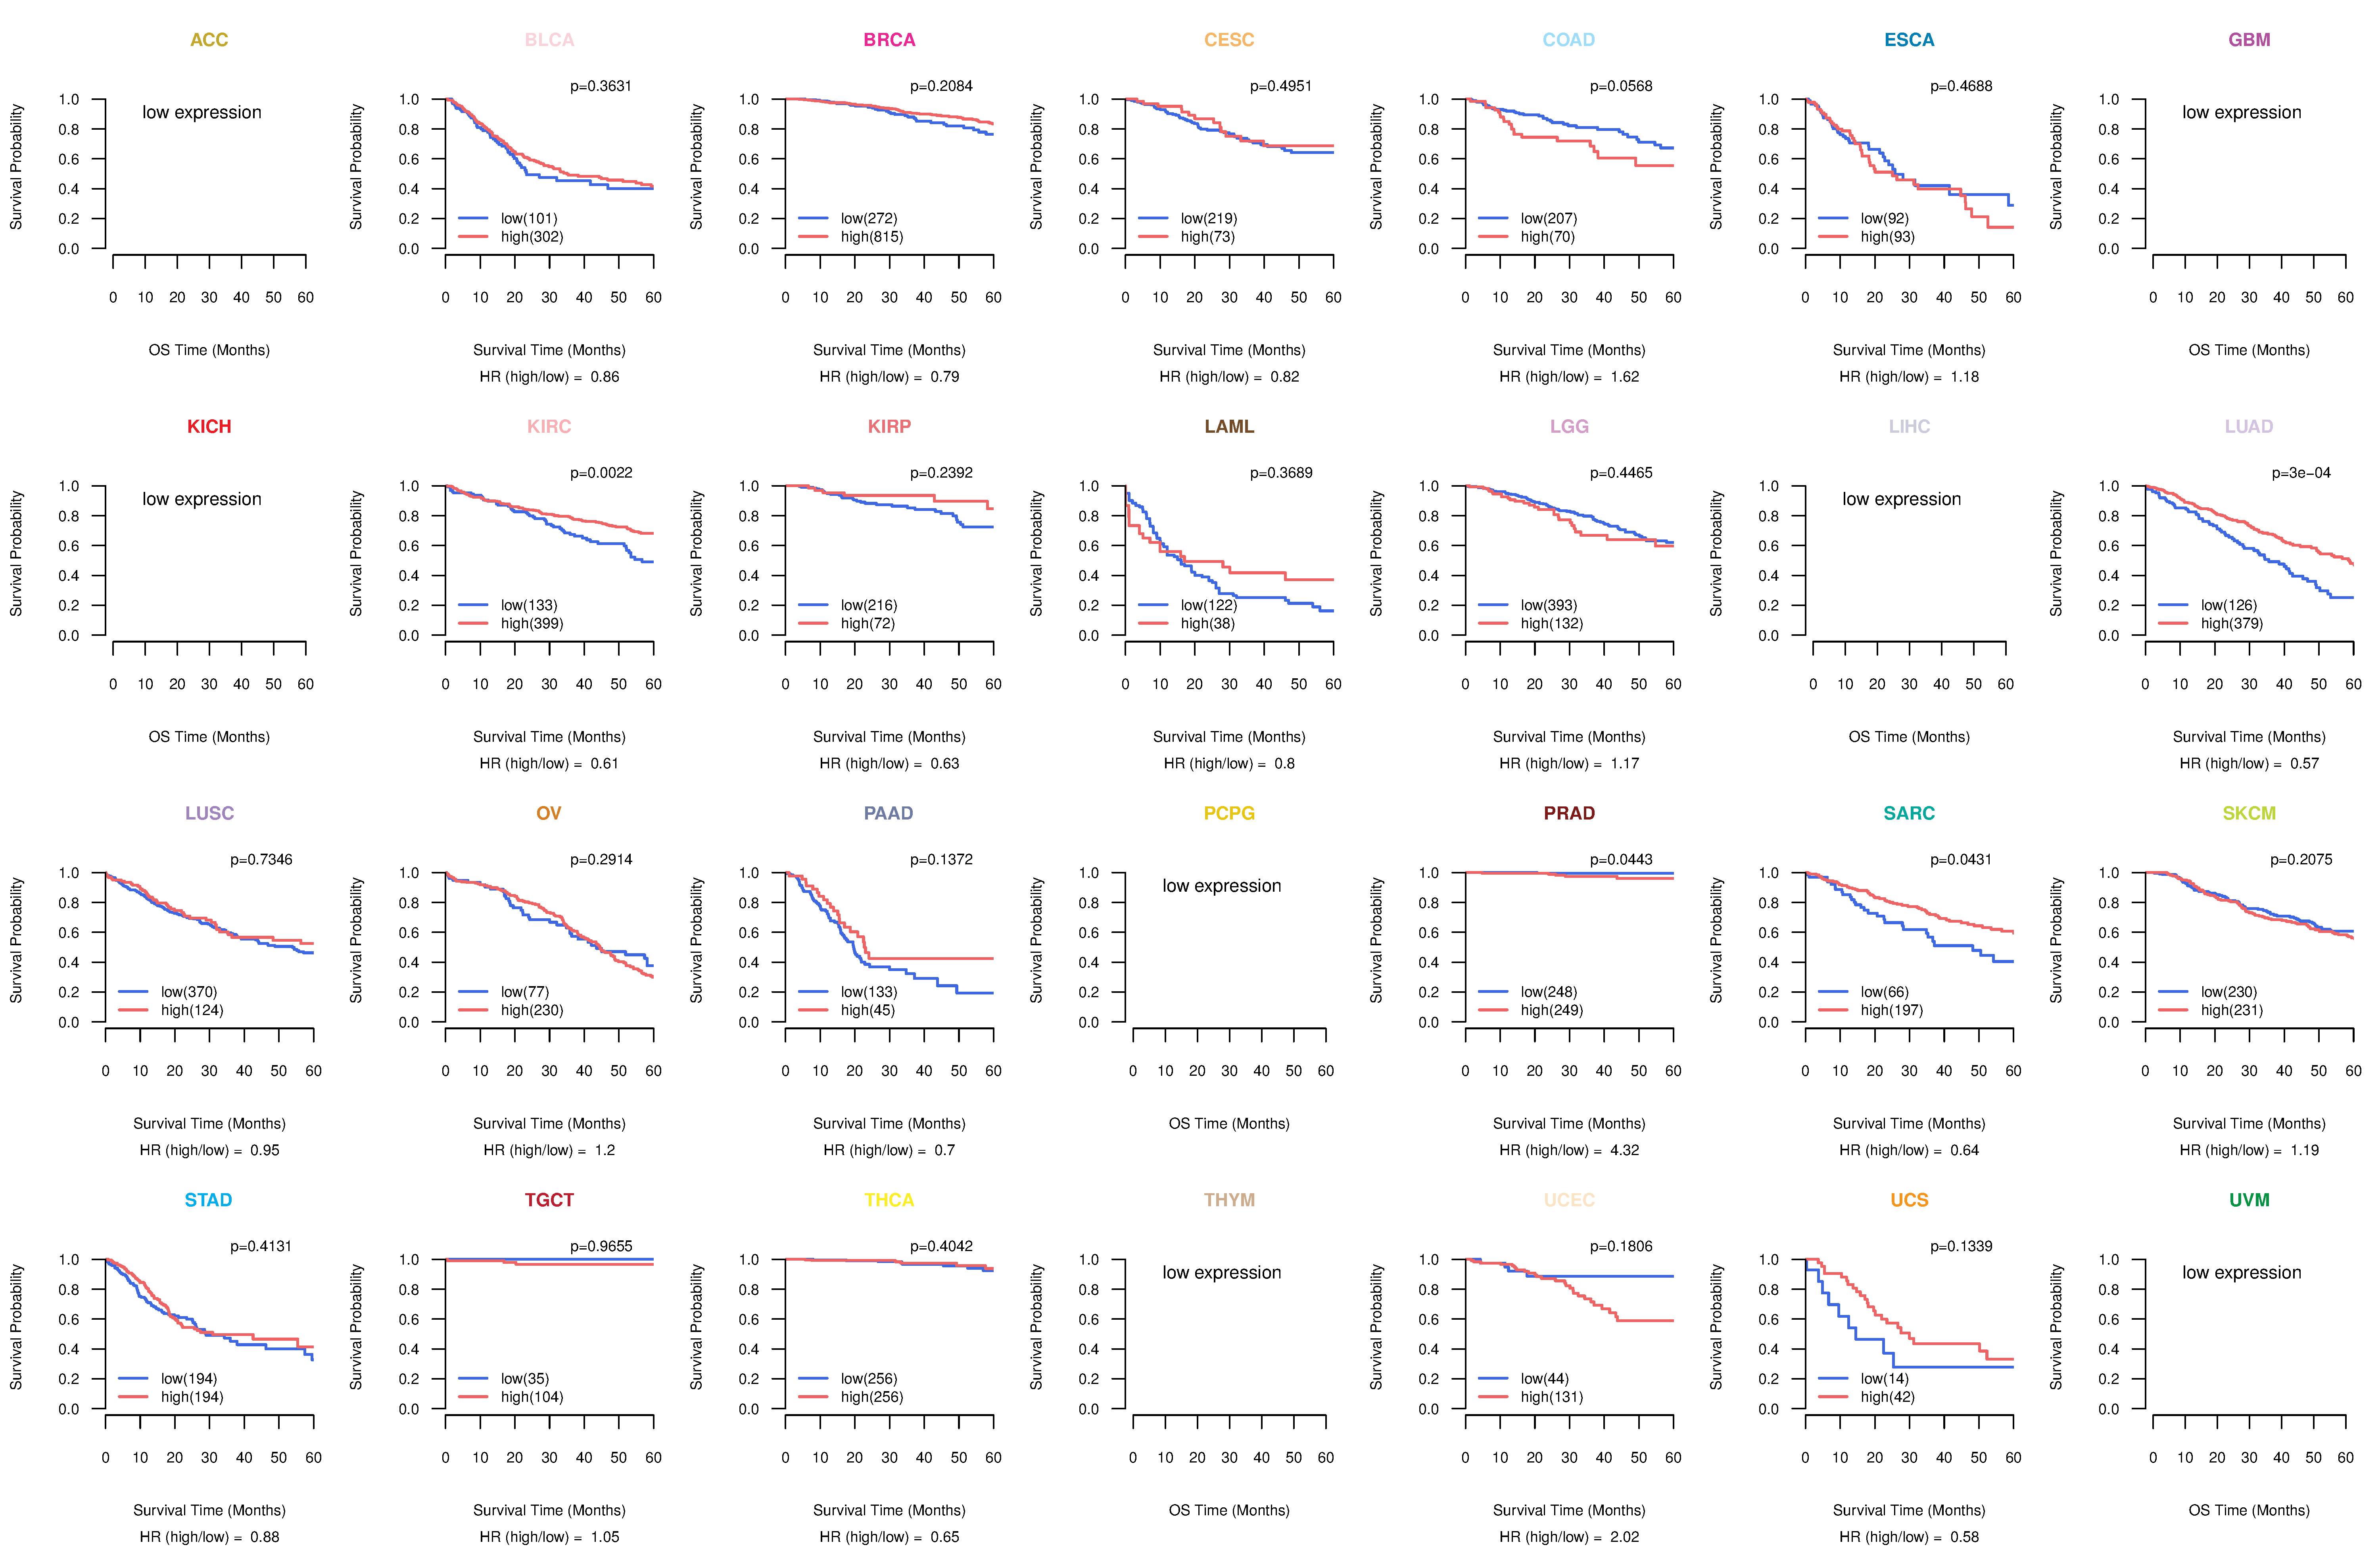
| TissGeneProg for TTLL10 |
| Kaplan-Meier plots with logrank tests of overall survival (OS) using 28 cancer types (TCGA IlluminaHiSeq_RNASeqV2, pan-cancer normalized log2(norm_counts+1) data, version 2016-08-16) (TCGA clinicalMatrix, phenotype data, version 2016-04-27) * Click on the image to enlarge it in a new window. |
 |
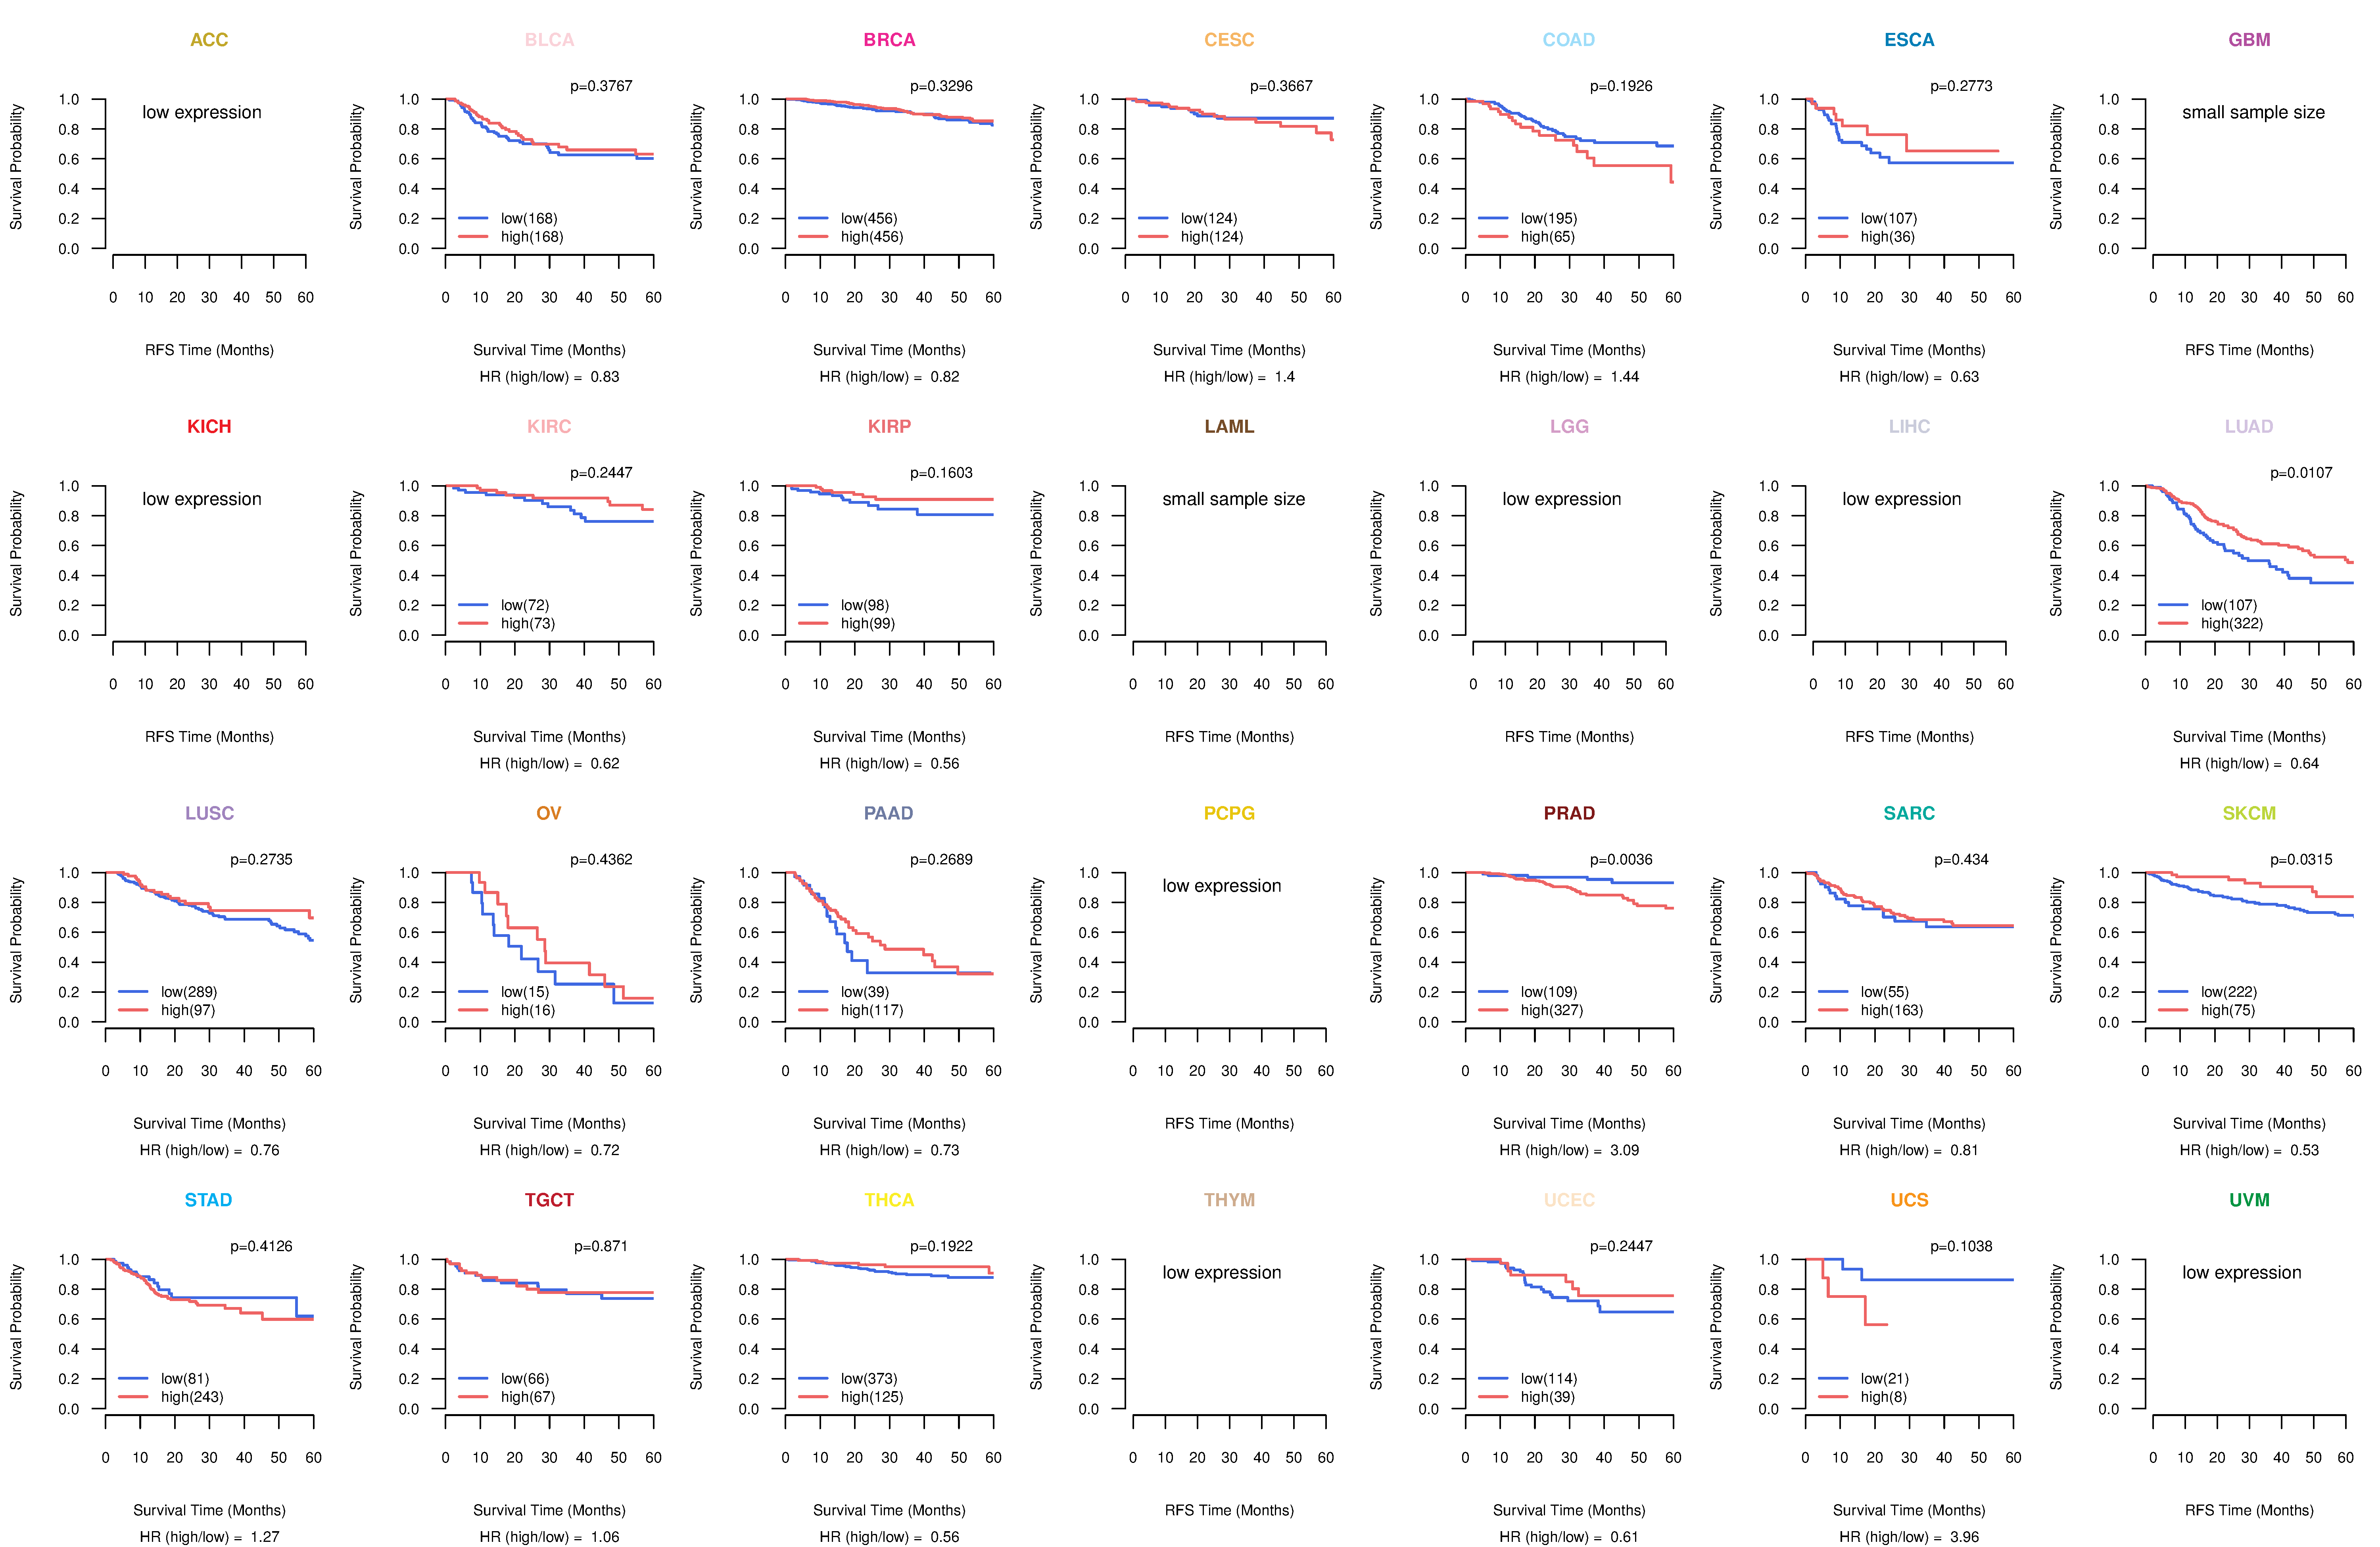
| Kaplan-Meier plots with logrank test of relapse free survival (RFS) using 28 cancer types (TCGA IlluminaHiSeq_RNASeqV2, pan-cancer normalized log2(norm_counts+1) data, version 2016-08-16) (TCGA clinicalMatrix, phenotype data, version 2016-04-27) * Click on the image enlarge it in a new window. |
 |
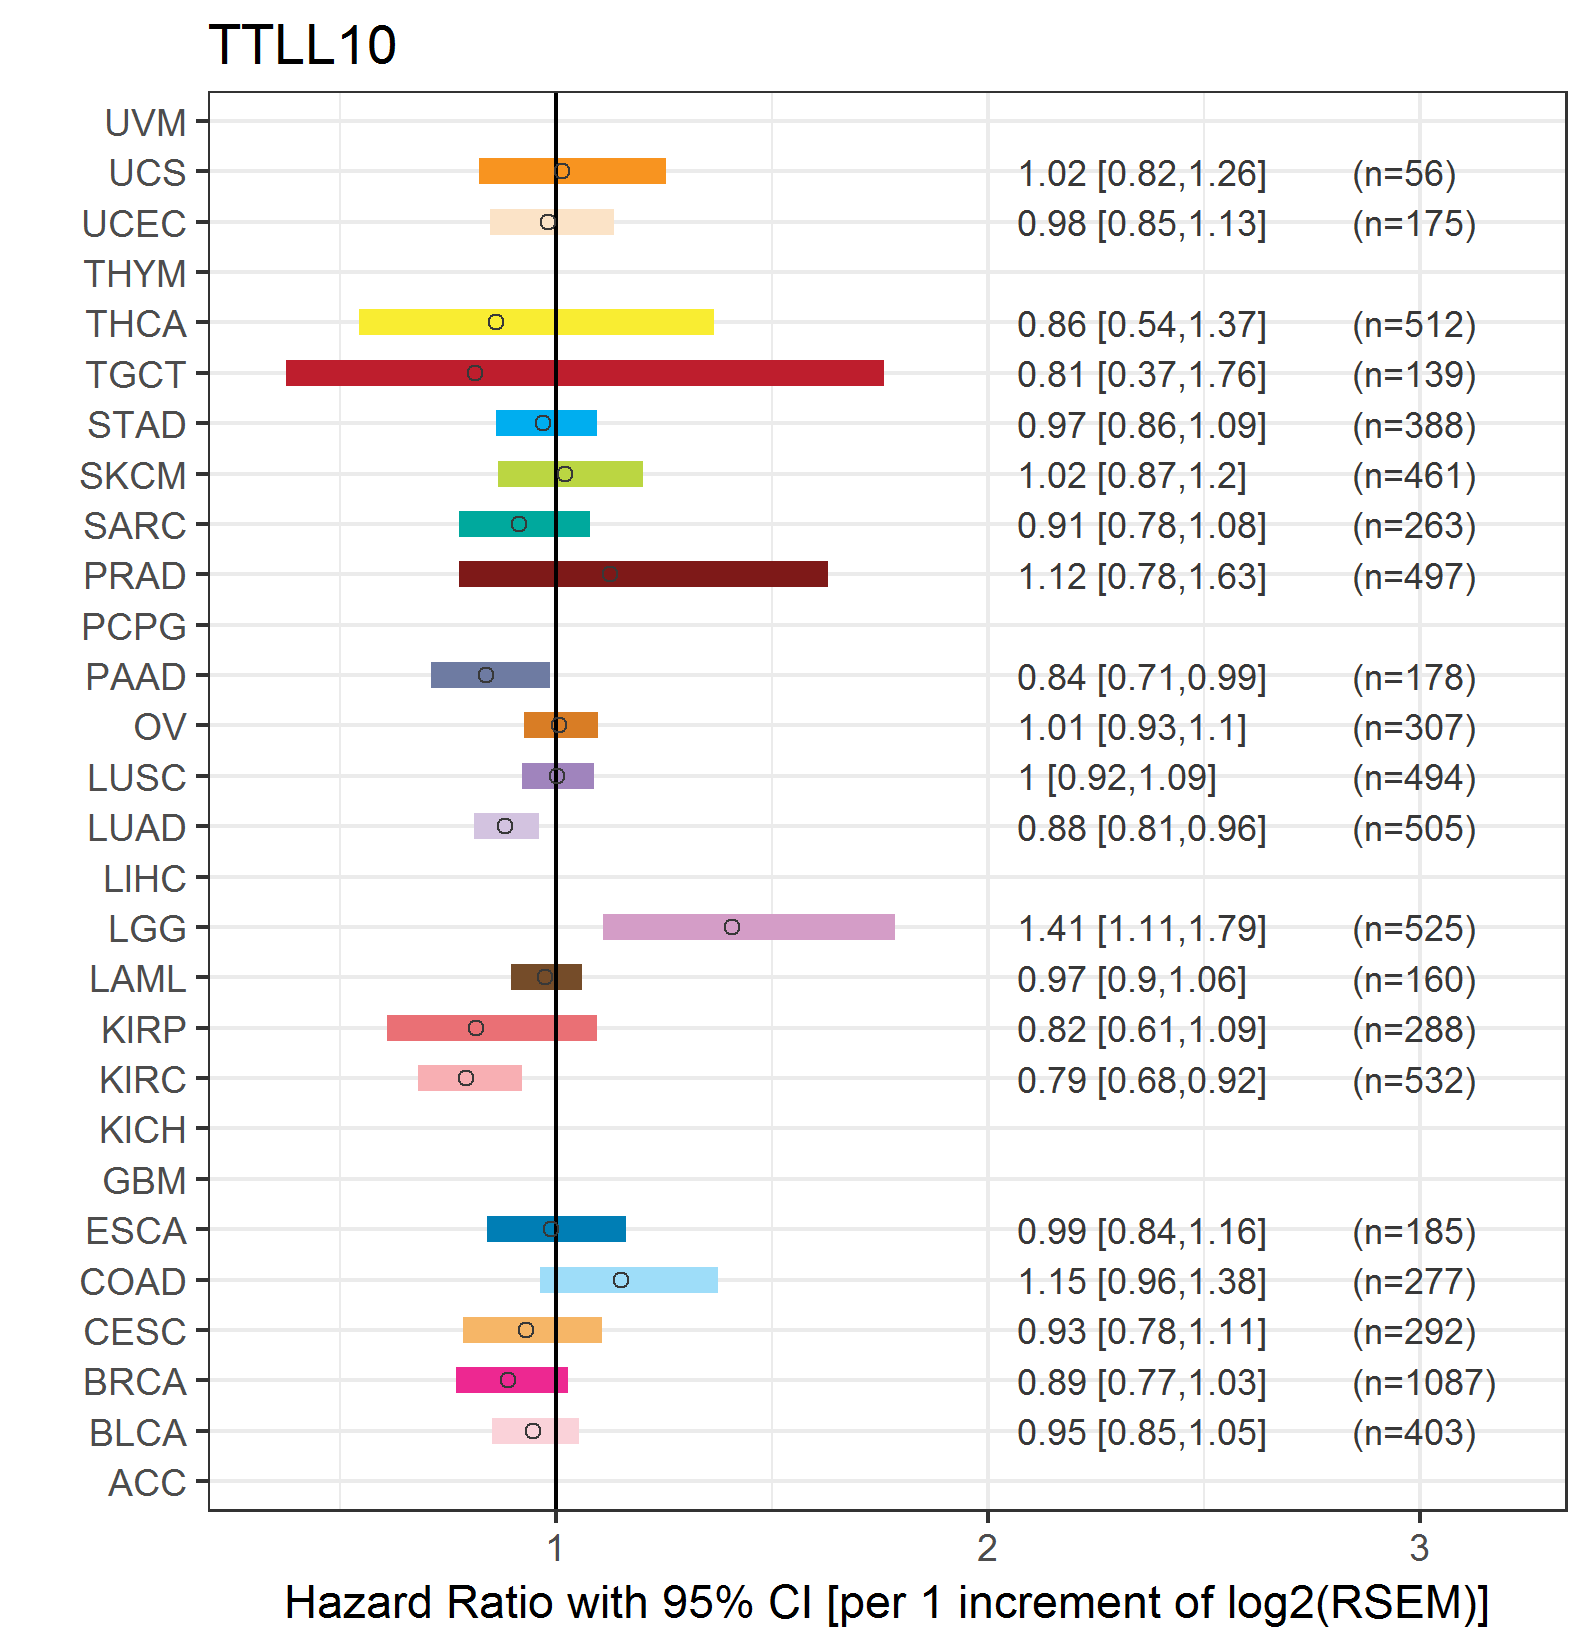
| Forest plot of Cox proportional hazard ratio (HR) and 95% CI of overall survival (OS) using 28 cancer types (TCGA IlluminaHiSeq_RNASeqV2, pan-cancer normalized log2(norm_counts+1) data, version 2016-08-16) (TCGA clinicalMatrix, phenotype data, version 2016-04-27) * Click on the image enlarge it in a new window. |
 |
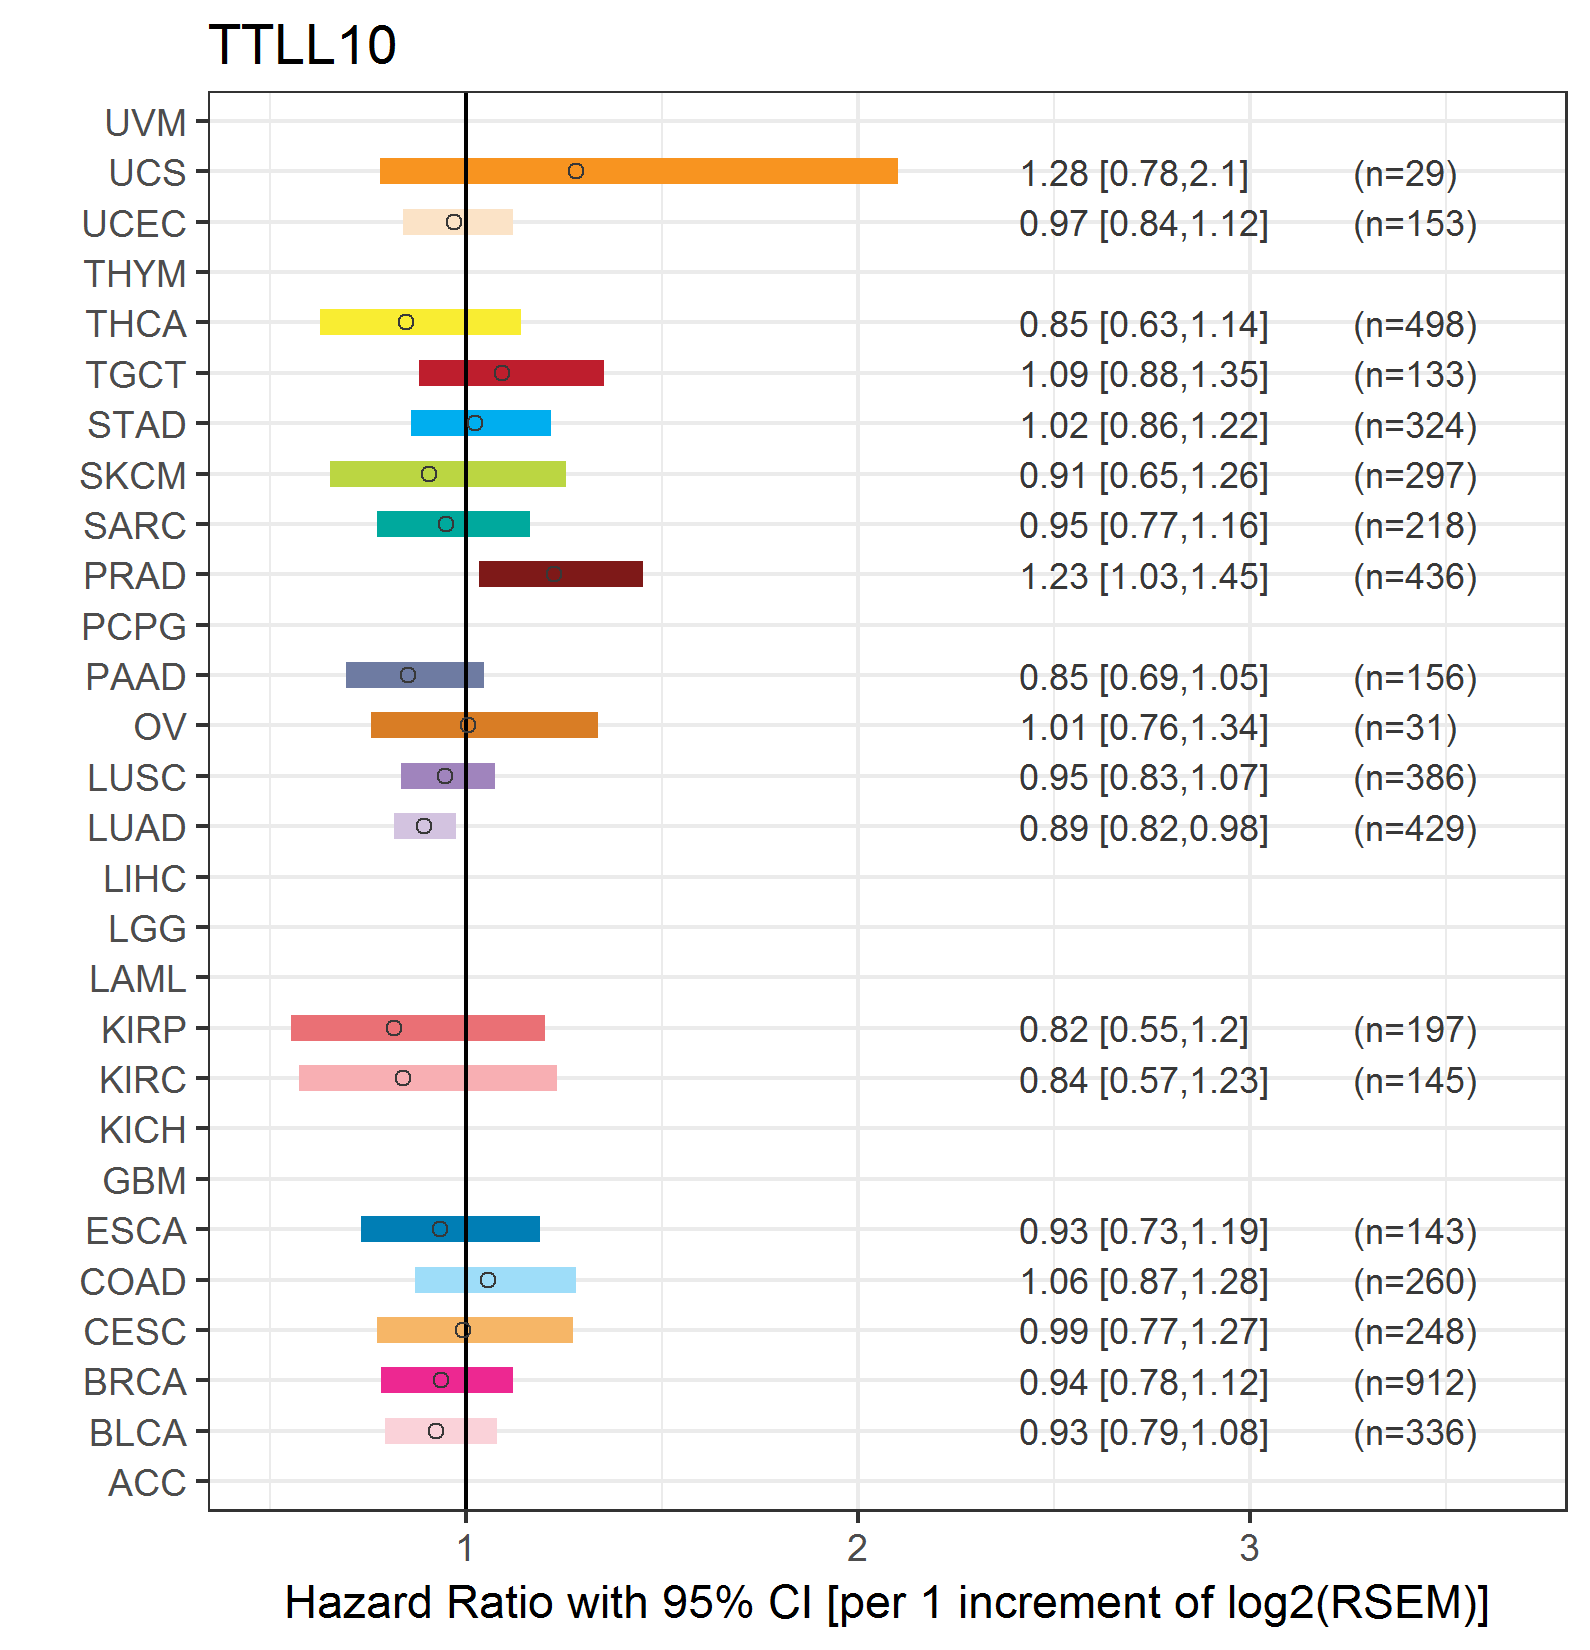
| Forest plot of Cox proportional hazard ratio (HR) and 95% CI of relapse free survival (RFS) using 28 cancer types (TCGA IlluminaHiSeq_RNASeqV2, pan-cancer normalized log2(norm_counts+1) data, version 2016-08-16) (TCGA clinicalMatrix, phenotype data, version 2016-04-27) * Click on the image enlarge it in a new window. |
 |
| Top |
| TissGeneClin for TTLL10 |
| TissGeneDrug for TTLL10 |
| Drug information targeting TissGene (DrugBank Version 5.0.6, 2017-04-01) |
| DrugBank ID | Drug name | Drug activity | Drug type | Drug status |
| Top |
| TissGeneDisease for TTLL10 |
| Disease information associated with TissGene (DisGeNet, 2016-06-01) |
| Disease ID | Disease name | # pubmeds | Source |
| umls:C0854723 | Retinal Dystrophies | 1 | BeFree |
|
Copyright 2016-Present - The University of Texas Health Science Center at Houston (UTHealth) Web File Viewing | How to Report, Fraud, Waste and Abuse | State of Texas | Statewide Search | Texas Homeland Security | Site Policies |