 |
| |
| |
| |
| |
| |
| |
|

| TissGeneSummary for CNIH2 |
 Gene summary Gene summary |
| Basic gene information | Gene symbol | CNIH2 |
| Gene name | cornichon family AMPA receptor auxiliary protein 2 | |
| Synonyms | CNIH-2|Cnil | |
| Cytomap | UCSC genome browser: 11q13.2 | |
| Type of gene | protein-coding | |
| RefGenes | NM_182553.2, NR_073078.1,NR_073079.1, | |
| Description | cornichon homolog 2protein cornichon homolog 2 | |
| Modification date | 20141207 | |
| dbXrefs | MIM : 611288 | |
| HGNC : HGNC | ||
| Ensembl : ENSG00000174871 | ||
| HPRD : 13078 | ||
| Vega : OTTHUMG00000166919 | ||
| Protein | UniProt: go to UniProt's Cross Reference DB Table | |
| Expression | CleanEX: HS_CNIH2 | |
| BioGPS: 254263 | ||
| Pathway | NCI Pathway Interaction Database: CNIH2 | |
| KEGG: CNIH2 | ||
| REACTOME: CNIH2 | ||
| Pathway Commons: CNIH2 | ||
| Context | iHOP: CNIH2 | |
| ligand binding site mutation search in PubMed: CNIH2 | ||
| UCL Cancer Institute: CNIH2 | ||
| Assigned class in TissGDB* | C | |
| Included tissue-specific gene expression resources | HPA,TiGER | |
| Specific-tissues in normal samples (assigned by TissGDB using HPA, TiGER, and GTEx) | BrainPancreas | |
| Cancer types related to the specific-tissues in cancer samples (assigned by TissGDB using TCGA) | GBM,LGGPAAD | |
| Reference showing the relevant tissue of CNIH2 | ||
| Description by TissGene annotations | Protective TissGene in RFS | |
| * Class A consists of genes with literature evidence and is part of the cTissGenes. Class B consists of only cTissGenes without additional evidence. The remaining genes belong to Class C. |
| Gene ontology having evidence of Inferred from Direct Assay (IDA) from Entrez |
| GO ID | GO term | PubMed ID | GO:2000311 | regulation of alpha-amino-3-hydroxy-5-methyl-4-isoxazole propionate selective glutamate receptor activity | 20805473 | GO:2000311 | regulation of alpha-amino-3-hydroxy-5-methyl-4-isoxazole propionate selective glutamate receptor activity | 20805473 |
| Top |
| TissGeneExp for CNIH2 |
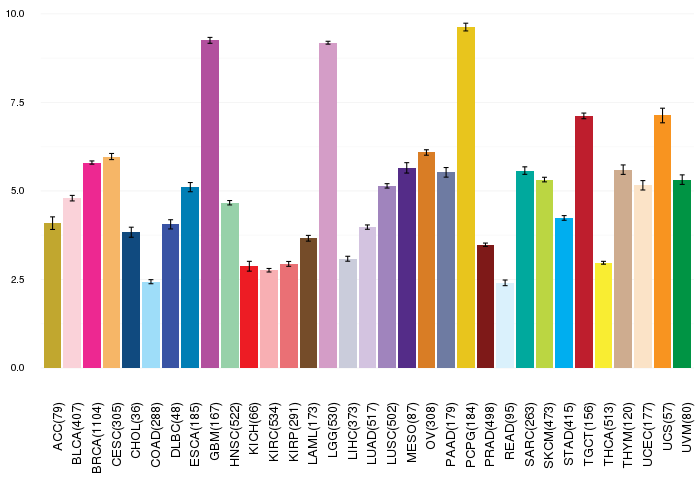
| Gene expressions across 28 cancer types (X-axis: cancer type and Y-axis: log2(norm_counts+1)) (TCGA IlluminaHiSeq_RNASeqV2, pan-cancer normalized log2(norm_counts+1) data, version 2016-08-16) |
 |
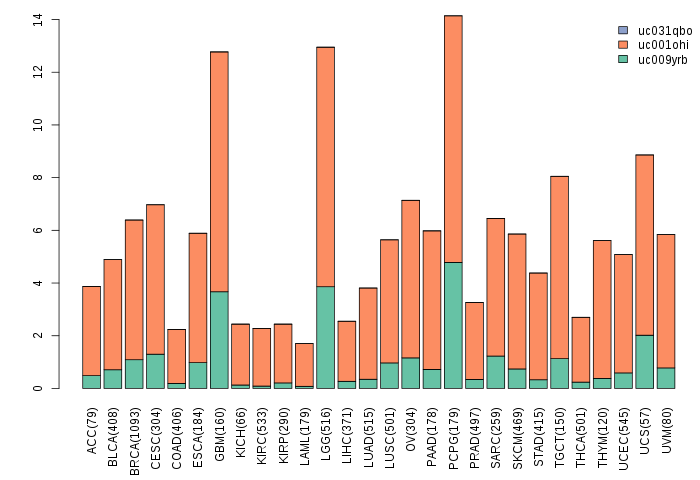
| Gene isoform expressions across 28 cancer types (X-axis: cancer type and Y-axis: log2(norm_counts+1)) (TCGA pan-cancer tcga_rsem_isoform_tpm, version 2016-09-01) |
 |
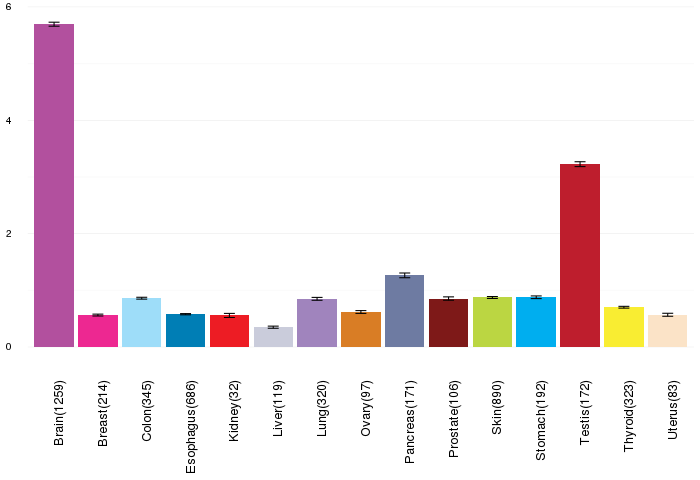
| Gene expressions across normal tissues of GTEx data (GTEx GTEx_Analysis_v6_RNA-seq_RNA-SeQCv1.1.8_gene_rpkm.gct) - Here, we shows the matched tissue types only among our 28 cancer types. |
 |
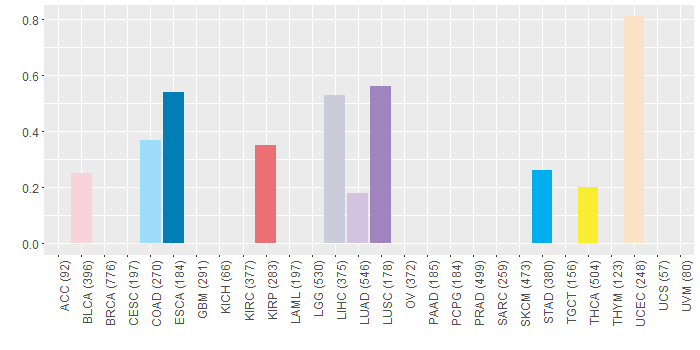
| Different expressions across 14 cancer types with more than 10 samples between matched tumors and normals (X-axis: cancer type and Y-axis: log2(norm_counts+1)) (TCGA IlluminaHiSeq_RNASeqV2, pan-cancer normalized log2(norm_counts+1) data, version 2016-08-16) |
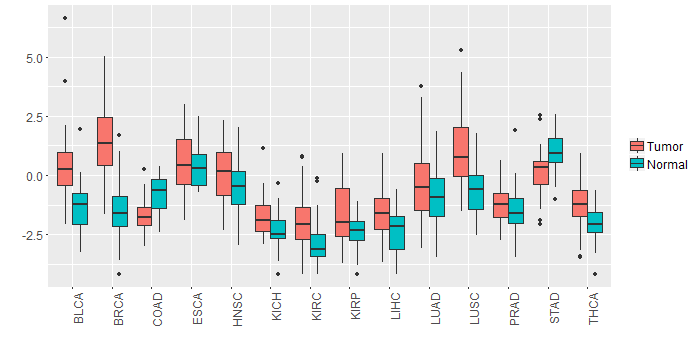 |
| - Significantly differentially expressed cancer types and information. (|Fold change|>1 and FDR<0.05) |
| Cancer type | Mean(exp) in tumor | Mean(exp) in matched normal | Log2FC | P-val. | FDR |
| COAD | -1.754828552 | -0.730151629 | -1.024676923 | 1.13E-05 | 5.12E-05 |
| LUSC | 1.015997542 | -0.665865203 | 1.681862745 | 1.37E-08 | 4.25E-08 |
| BRCA | 1.386303837 | -1.523036514 | 2.909340351 | 9.70E-42 | 3.36E-40 |
| BLCA | 0.573445942 | -1.229185637 | 1.802631579 | 0.00267 | 0.016180054 |
| Top |
| TissGene-miRNA for CNIH2 |
| Significantly anti-correlated miRNAs of TissGene across 28 cancer types (Gene-miRNA relations from TargetScanHuman Relsease 7.1, Conserved_Site_Context_Scores.txt.zip, 06.01.2016) (TCGA IlluminaHiSeq_miRNASeq, log2(RPM+1) data, version 2016-11-21) (TCGA IlluminaHiSeq_RNASeqV2, log2(normalized_count+1) data, version 2016-08-16) (Spearman’s Rank Correlation (p-value<0.05 and coefficient<-0.25)) |
| Cancer type | miRNA id | miRNA accession | P-val. | Coeff. | # samples |
| Top |
| TissGeneMut for CNIH2 |
| TissGeneSNV for CNIH2 |
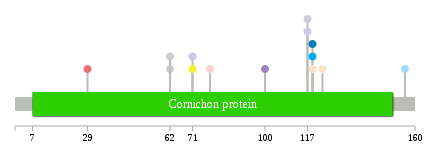
| nsSNV counts per each loci. Different colors of circles represent different cancer types. Circle size denotes number of samples. (TCGA somatic mutation (SNPs and small INDELs) data, version 2016-04-25) * Click on the image to enlarge it in a new window. |
 |
 |
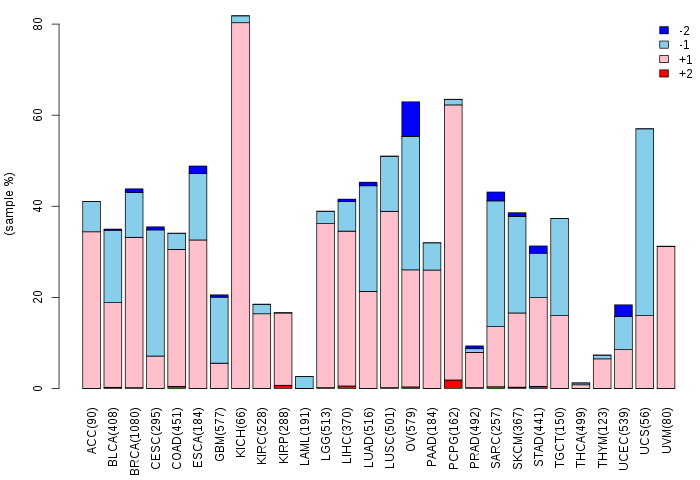
| Somatic nucleotide variants of TissGene across 28 cancer types (X-axis: cancer type and Y-axis: % of mutated samples) The numbers in parentheses are numbers of samples with mutation (nsSNVs). (TCGA somatic mutation (SNPs and small INDELs) data, version 2016-04-25) |
 |
| - nsSNVs sorted by frequency. |
| AAchange | Cancer type | # samples |
| p.T156M | COAD | 1 |
| p.C62F | LIHC | 1 |
| p.A119V | ESCA | 1 |
| p.F78L | BLCA | 1 |
| p.Y117X | LIHC | 1 |
| p.A119V | STAD | 1 |
| p.A119V | UCEC | 1 |
| p.E71Q | THCA | 1 |
| p.I29M | KIRP | 1 |
| p.Y100H | LUSC | 1 |
| p.D32H | HNSC | 1 |
| p.Y117* | LIHC | 1 |
| p.C62R | LIHC | 1 |
| p.E71K | LUAD | 1 |
| p.M123V | UCEC | 1 |
| Top |
| TissGeneCNV for CNIH2 |
| Copy number variations of TissGene across 28 cancer types (X-axis: cancer type and Y-axis: % of CNV samples) (TCGA Gistic2_CopyNumber_Gistic2_all_data_by_genes, Gistic2 copy number data, version 2016-08-16) |
 |
| Top |
| TissGeneFusions for CNIH2 |
| Fusion genes including TissGene (ChimerDB 3.0, 2016-12-01 and TCGA fusion Portal 2015-12-01) |
| Database | Src | Cancer type | Sample | Fusion gene | ORF | 5'-gene BP | 3'-gene BP |
| Chimerdb3.0 | ChiTaRs | NA | BI912966 | KAT2B-CNIH2 | chr3:20120316 | chr11:66051619 | |
| Chimerdb3.0 | FusionScan | BRCA | TCGA-BH-A0H6-01A | ARFGEF2-CNIH2 | In-Frame | chr20:47558524 | chr11:66049729 |
| TCGAfusionPortal | PRADA | BRCA | TCGA-BH-A0H6-01A | ARFGEF2-CNIH2 | In-frame | Chr20:47558524 | Chr11:66049730 |
| TCGAfusionPortal | PRADA | SKCM | TCGA-D9-A4Z5-01A | CNIH2-MS4A4A | Out-of-frame | Chr11:66046008 | Chr11:60059698 |
| Top |
| TissGeneNet for CNIH2 |
| Co-expressed gene networks based on protein-protein interaction data (CePIN) (TCGA IlluminaHiSeq_RNASeqV2, pan-cancer normalized log2(norm_counts+1) data, version 2016-08-16) (PINA2 ppi data) |
| Top |
| TissGeneProg for CNIH2 |
| Kaplan-Meier plots with logrank tests of overall survival (OS) using 28 cancer types (TCGA IlluminaHiSeq_RNASeqV2, pan-cancer normalized log2(norm_counts+1) data, version 2016-08-16) (TCGA clinicalMatrix, phenotype data, version 2016-04-27) * Click on the image to enlarge it in a new window. |
 |
| Kaplan-Meier plots with logrank test of relapse free survival (RFS) using 28 cancer types (TCGA IlluminaHiSeq_RNASeqV2, pan-cancer normalized log2(norm_counts+1) data, version 2016-08-16) (TCGA clinicalMatrix, phenotype data, version 2016-04-27) * Click on the image enlarge it in a new window. |
 |
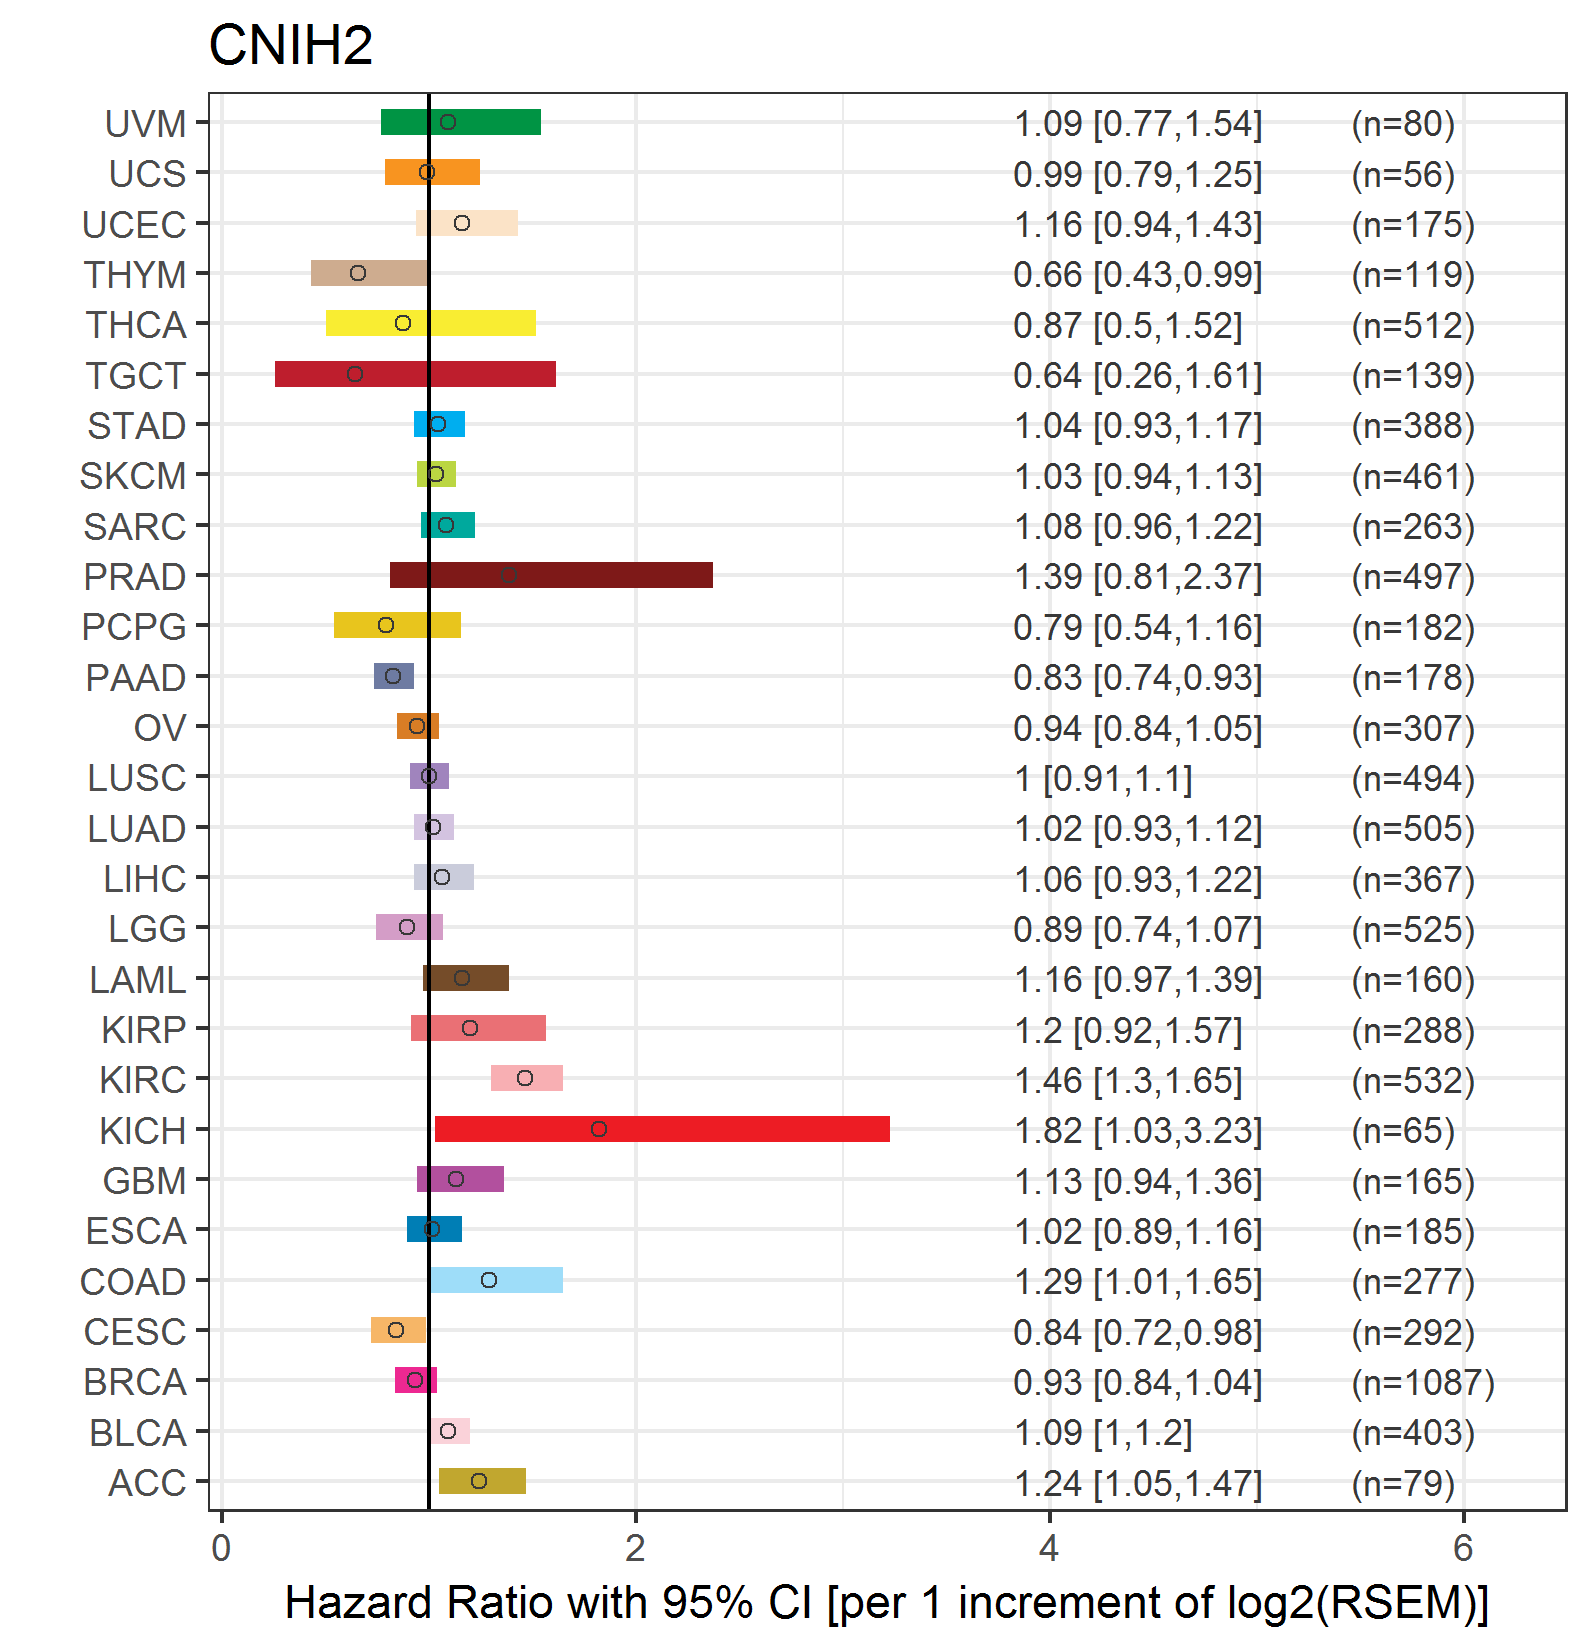
| Forest plot of Cox proportional hazard ratio (HR) and 95% CI of overall survival (OS) using 28 cancer types (TCGA IlluminaHiSeq_RNASeqV2, pan-cancer normalized log2(norm_counts+1) data, version 2016-08-16) (TCGA clinicalMatrix, phenotype data, version 2016-04-27) * Click on the image enlarge it in a new window. |
 |
| Forest plot of Cox proportional hazard ratio (HR) and 95% CI of relapse free survival (RFS) using 28 cancer types (TCGA IlluminaHiSeq_RNASeqV2, pan-cancer normalized log2(norm_counts+1) data, version 2016-08-16) (TCGA clinicalMatrix, phenotype data, version 2016-04-27) * Click on the image enlarge it in a new window. |
 |
| Top |
| TissGeneClin for CNIH2 |
| TissGeneDrug for CNIH2 |
| Drug information targeting TissGene (DrugBank Version 5.0.6, 2017-04-01) |
| DrugBank ID | Drug name | Drug activity | Drug type | Drug status |
| Top |
| TissGeneDisease for CNIH2 |
| Disease information associated with TissGene (DisGeNet, 2016-06-01) |
| Disease ID | Disease name | # pubmeds | Source |
| umls:C0018099 | Gout | 1 | GWASCAT |
|
Copyright 2016-Present - The University of Texas Health Science Center at Houston (UTHealth) Web File Viewing | How to Report, Fraud, Waste and Abuse | State of Texas | Statewide Search | Texas Homeland Security | Site Policies |