 |
| |
| |
| |
| |
| |
| |
|

| TissGeneSummary for PTF1A |
 Gene summary Gene summary |
| Basic gene information | Gene symbol | PTF1A |
| Gene name | pancreas specific transcription factor, 1a | |
| Synonyms | PACA|PAGEN2|PTF1-p48|bHLHa29 | |
| Cytomap | UCSC genome browser: 10p12.2 | |
| Type of gene | protein-coding | |
| RefGenes | NM_178161.2, | |
| Description | bHLH transcription factor p48class A basic helix-loop-helix protein 29class II bHLH protein PTF1Aexocrine pancreas-specific transcription factor p48p48 DNA-binding subunit of transcription factor PTF1pancreas transcription factor 1 subunit alphapanc | |
| Modification date | 20141207 | |
| dbXrefs | MIM : 607194 | |
| HGNC : HGNC | ||
| Ensembl : ENSG00000168267 | ||
| HPRD : 09526 | ||
| Vega : OTTHUMG00000017815 | ||
| Protein | UniProt: go to UniProt's Cross Reference DB Table | |
| Expression | CleanEX: HS_PTF1A | |
| BioGPS: 256297 | ||
| Pathway | NCI Pathway Interaction Database: PTF1A | |
| KEGG: PTF1A | ||
| REACTOME: PTF1A | ||
| Pathway Commons: PTF1A | ||
| Context | iHOP: PTF1A | |
| ligand binding site mutation search in PubMed: PTF1A | ||
| UCL Cancer Institute: PTF1A | ||
| Assigned class in TissGDB* | C | |
| Included tissue-specific gene expression resources | HPA,GTEx | |
| Specific-tissues in normal samples (assigned by TissGDB using HPA, TiGER, and GTEx) | Pancreas | |
| Cancer types related to the specific-tissues in cancer samples (assigned by TissGDB using TCGA) | PAAD | |
| Reference showing the relevant tissue of PTF1A | ||
| Description by TissGene annotations | Have significant anti-correlated miRNA | |
| * Class A consists of genes with literature evidence and is part of the cTissGenes. Class B consists of only cTissGenes without additional evidence. The remaining genes belong to Class C. |
| Gene ontology having evidence of Inferred from Direct Assay (IDA) from Entrez |
| GO ID | GO term | PubMed ID | GO:0009888 | tissue development | 12185368 | GO:0009888 | tissue development | 12185368 |
| Top |
| TissGeneExp for PTF1A |
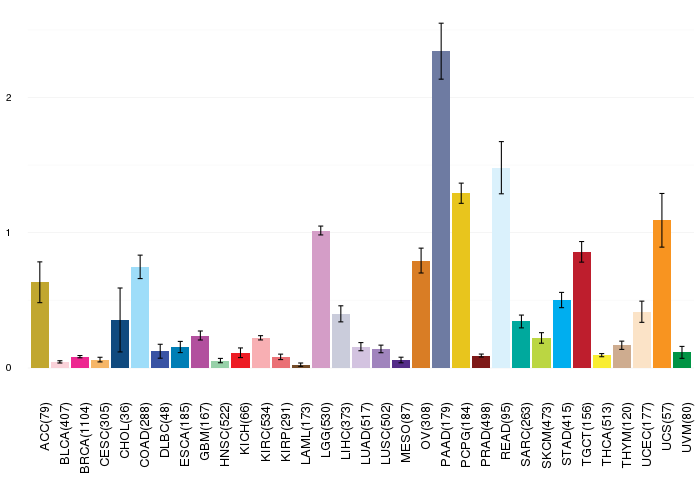
| Gene expressions across 28 cancer types (X-axis: cancer type and Y-axis: log2(norm_counts+1)) (TCGA IlluminaHiSeq_RNASeqV2, pan-cancer normalized log2(norm_counts+1) data, version 2016-08-16) |
 |
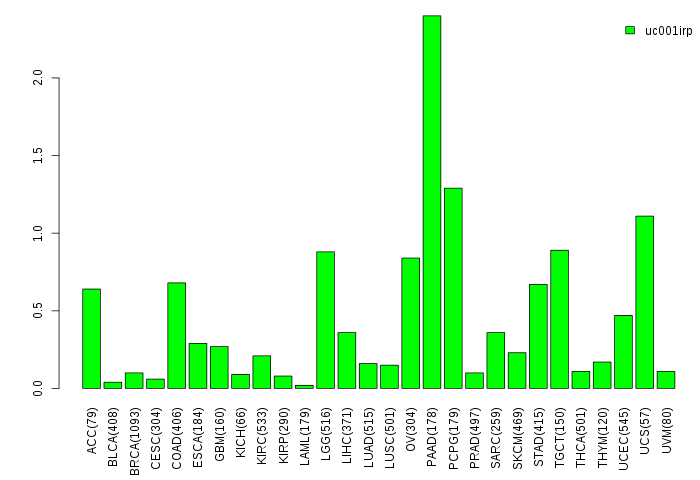
| Gene isoform expressions across 28 cancer types (X-axis: cancer type and Y-axis: log2(norm_counts+1)) (TCGA pan-cancer tcga_rsem_isoform_tpm, version 2016-09-01) |
 |
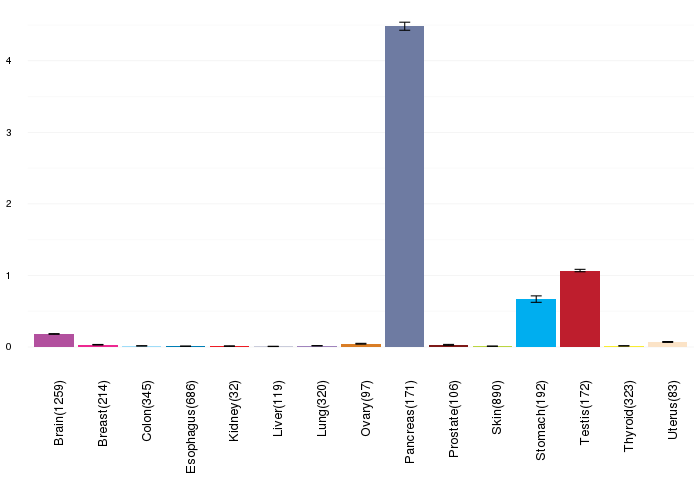
| Gene expressions across normal tissues of GTEx data (GTEx GTEx_Analysis_v6_RNA-seq_RNA-SeQCv1.1.8_gene_rpkm.gct) - Here, we shows the matched tissue types only among our 28 cancer types. |
 |
| Different expressions across 14 cancer types with more than 10 samples between matched tumors and normals (X-axis: cancer type and Y-axis: log2(norm_counts+1)) (TCGA IlluminaHiSeq_RNASeqV2, pan-cancer normalized log2(norm_counts+1) data, version 2016-08-16) |
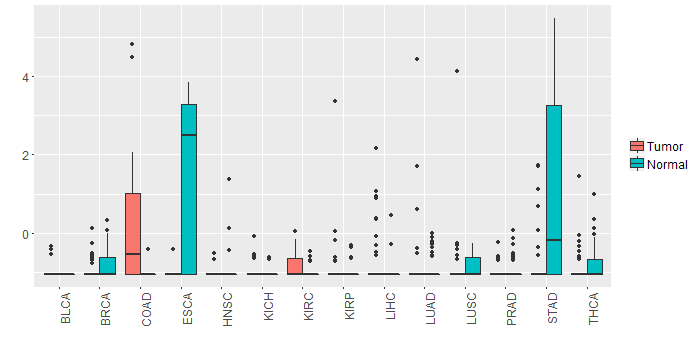 |
| - Significantly differentially expressed cancer types and information. (|Fold change|>1 and FDR<0.05) |
| Cancer type | Mean(exp) in tumor | Mean(exp) in matched normal | Log2FC | P-val. | FDR |
| ESCA | -0.983241475 | 1.356422162 | -2.339663636 | 0.00467 | 0.038184118 |
| COAD | 0.186334749 | -1.017592174 | 1.203926923 | 0.00117 | 0.003294949 |
| STAD | -0.677305395 | 1.081694605 | -1.759 | 0.000234 | 0.001589927 |
| Top |
| TissGene-miRNA for PTF1A |
| Significantly anti-correlated miRNAs of TissGene across 28 cancer types (Gene-miRNA relations from TargetScanHuman Relsease 7.1, Conserved_Site_Context_Scores.txt.zip, 06.01.2016) (TCGA IlluminaHiSeq_miRNASeq, log2(RPM+1) data, version 2016-11-21) (TCGA IlluminaHiSeq_RNASeqV2, log2(normalized_count+1) data, version 2016-08-16) (Spearman’s Rank Correlation (p-value<0.05 and coefficient<-0.25)) |
| Cancer type | miRNA id | miRNA accession | P-val. | Coeff. | # samples |
| UCS | hsa-miR-363-3p | MIMAT0000707 | 0.023 | -0.31 | 56 |
| Top |
| TissGeneMut for PTF1A |
| TissGeneSNV for PTF1A |
| nsSNV counts per each loci. Different colors of circles represent different cancer types. Circle size denotes number of samples. (TCGA somatic mutation (SNPs and small INDELs) data, version 2016-04-25) * Click on the image to enlarge it in a new window. |
 |
 |
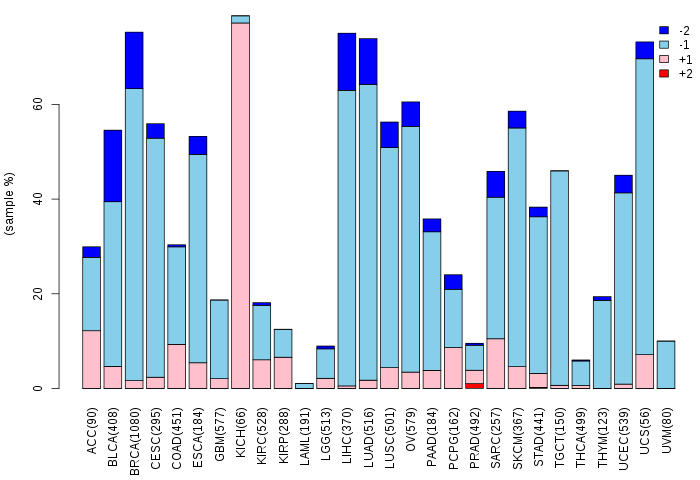
| Somatic nucleotide variants of TissGene across 28 cancer types (X-axis: cancer type and Y-axis: % of mutated samples) The numbers in parentheses are numbers of samples with mutation (nsSNVs). (TCGA somatic mutation (SNPs and small INDELs) data, version 2016-04-25) |
 |
| - nsSNVs sorted by frequency. |
| AAchange | Cancer type | # samples |
| p.E321K | SKCM | 2 |
| p.L42Q | LUAD | 1 |
| p.S19L | CESC | 1 |
| p.F52L | HNSC | 1 |
| p.M1I | HNSC | 1 |
| p.D25Y | BLCA | 1 |
| p.D24G | COAD | 1 |
| p.G272D | SKCM | 1 |
| p.R296* | UCEC | 1 |
| p.E325K | UCEC | 1 |
| p.G278R | COAD | 1 |
| p.L13I | ESCA | 1 |
| p.R307I | LGG | 1 |
| p.L36V | LUAD | 1 |
| p.F26I | SKCM | 1 |
| p.E7V | PAAD | 1 |
| p.D305G | PRAD | 1 |
| p.R296L | LUAD | 1 |
| p.P266L | LIHC | 1 |
| p.A48T | THYM | 1 |
| p.P322T | HNSC | 1 |
| p.L276V | LUAD | 1 |
| p.L309P | UCEC | 1 |
| p.G278E | LUAD | 1 |
| p.F26S | SKCM | 1 |
| p.P264L | SKCM | 1 |
| p.E286* | STAD | 1 |
| p.D285V | STAD | 1 |
| p.D25N | SKCM | 1 |
| p.M1K | LIHC | 1 |
| p.E41Q | BLCA | 1 |
| Top |
| TissGeneCNV for PTF1A |
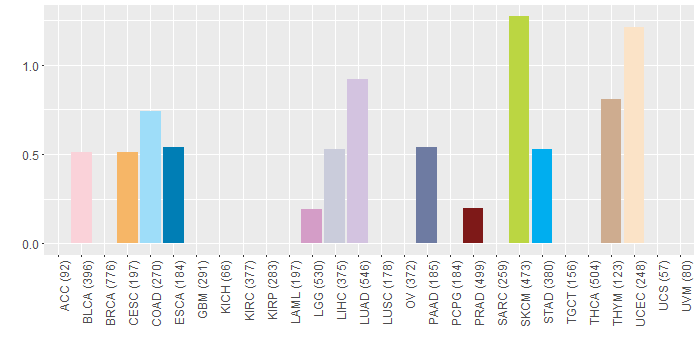
| Copy number variations of TissGene across 28 cancer types (X-axis: cancer type and Y-axis: % of CNV samples) (TCGA Gistic2_CopyNumber_Gistic2_all_data_by_genes, Gistic2 copy number data, version 2016-08-16) |
 |
| Top |
| TissGeneFusions for PTF1A |
| Fusion genes including TissGene (ChimerDB 3.0, 2016-12-01 and TCGA fusion Portal 2015-12-01) |
| Database | Src | Cancer type | Sample | Fusion gene | ORF | 5'-gene BP | 3'-gene BP |
| Top |
| TissGeneNet for PTF1A |
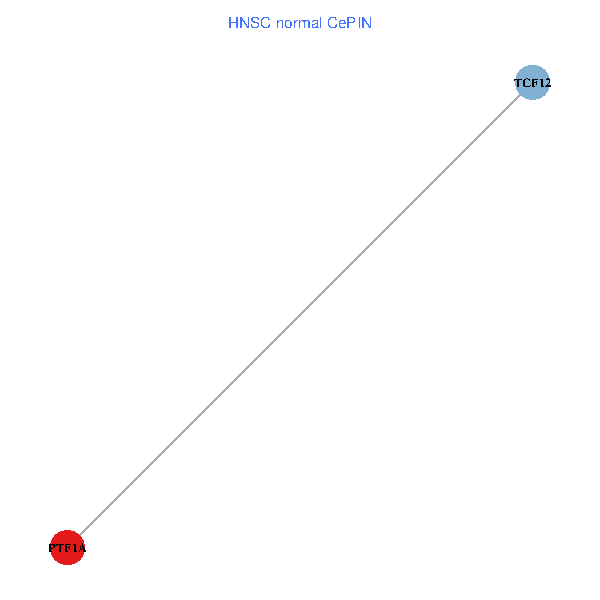
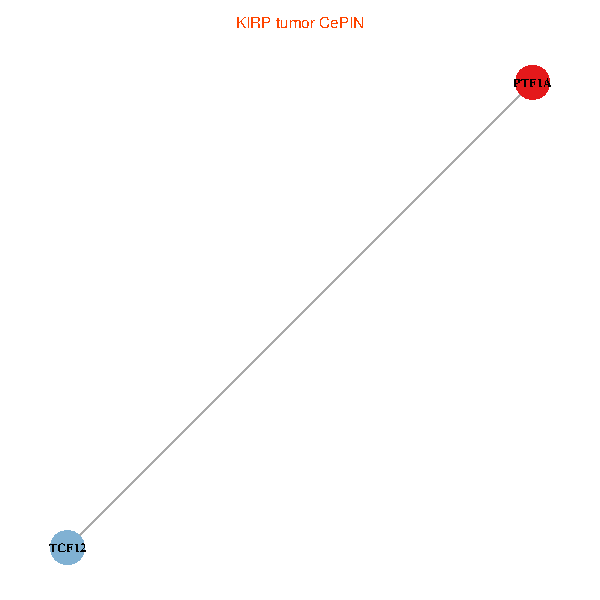
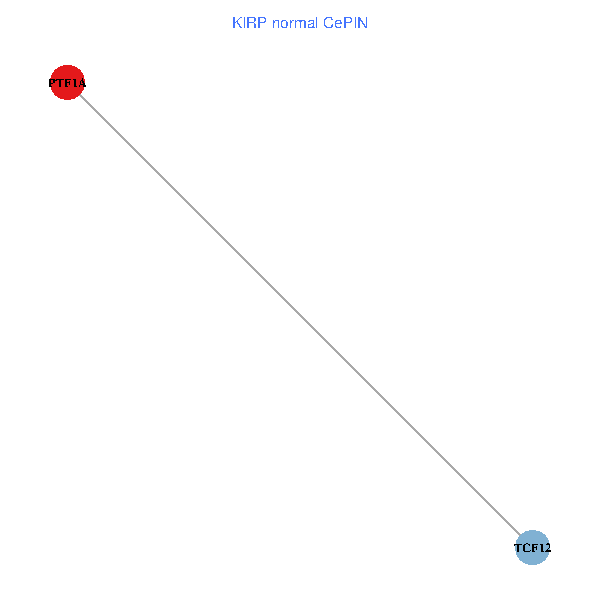
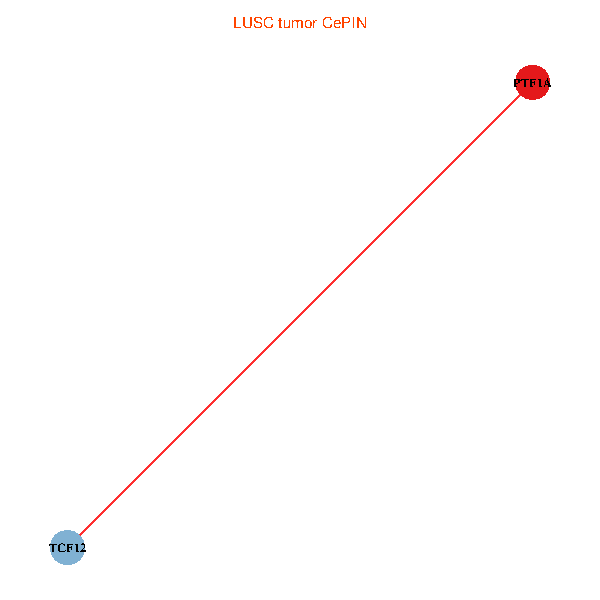
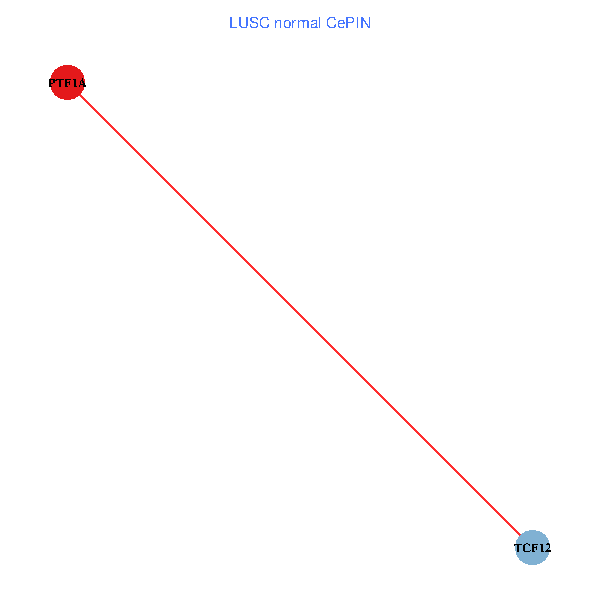
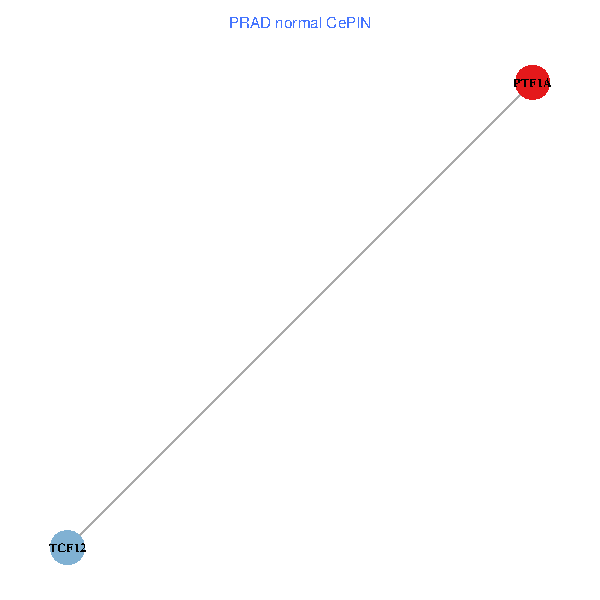
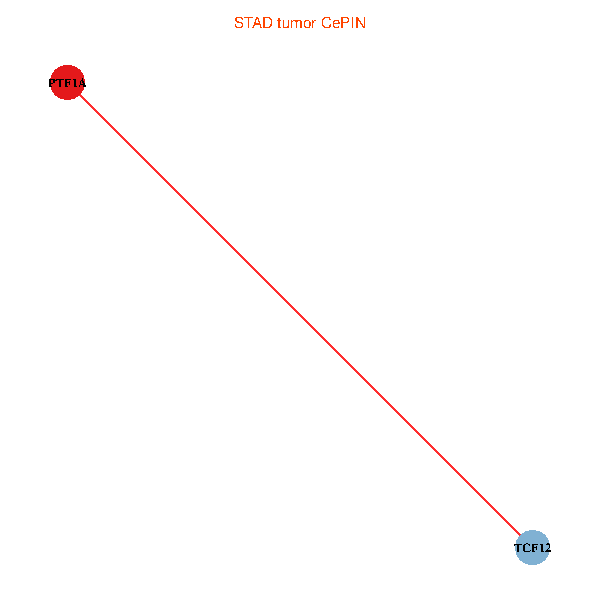
| Co-expressed gene networks based on protein-protein interaction data (CePIN) (TCGA IlluminaHiSeq_RNASeqV2, pan-cancer normalized log2(norm_counts+1) data, version 2016-08-16) (PINA2 ppi data) |
| BRCA (tumor) | BRCA (normal) |
| PTF1A, TCF12 (tumor) | PTF1A, TCF12 (normal) |
 |  |
| COAD (tumor) | COAD (normal) |
| PTF1A, TCF12 (tumor) | PTF1A, TCF12 (normal) |
 | 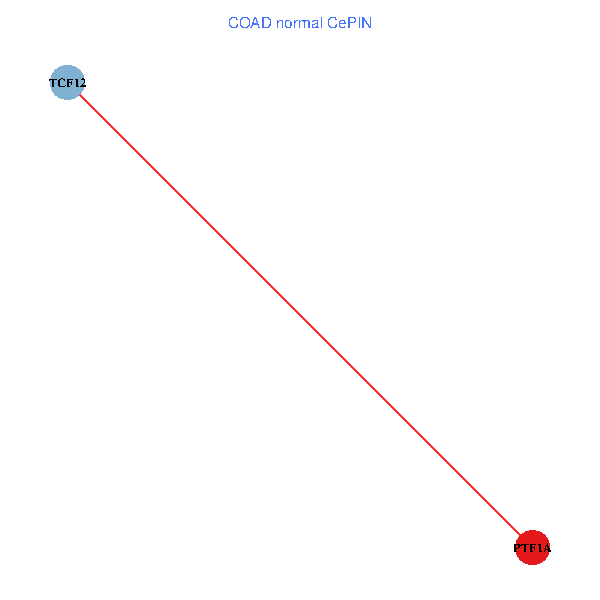 |
| HNSC (tumor) | HNSC (normal) |
| PTF1A, TCF12 (tumor) | PTF1A, TCF12 (normal) |
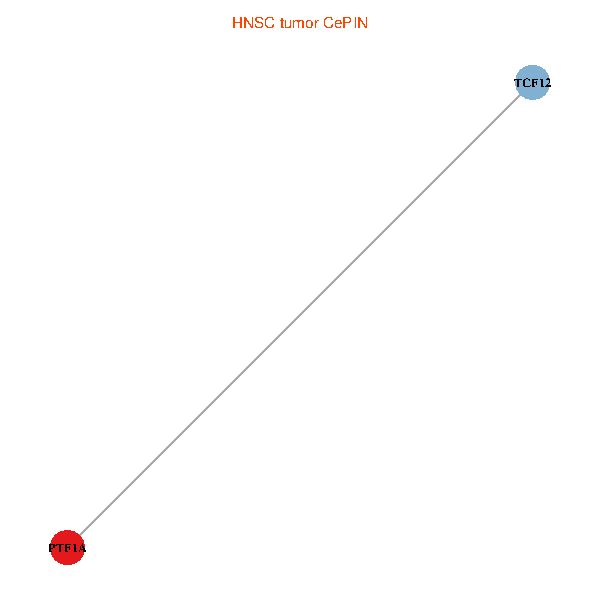 |  |
| KICH (tumor) | KICH (normal) |
| PTF1A, TCF12 (tumor) | PTF1A, TCF12 (normal) |
 |  |
| KIRC (tumor) | KIRC (normal) |
| PTF1A, TCF12 (tumor) | PTF1A, TCF12 (normal) |
 |  |
| KIRP (tumor) | KIRP (normal) |
| PTF1A, TCF12 (tumor) | PTF1A, TCF12 (normal) |
 |  |
| LIHC (tumor) | LIHC (normal) |
| PTF1A, TCF12 (tumor) | PTF1A, TCF12 (normal) |
 |  |
| LUAD (tumor) | LUAD (normal) |
| PTF1A, TCF12 (tumor) | PTF1A, TCF12 (normal) |
 |  |
| LUSC (tumor) | LUSC (normal) |
| PTF1A, TCF12 (tumor) | PTF1A, TCF12 (normal) |
 |  |
| PRAD (tumor) | PRAD (normal) |
| PTF1A, TCF12 (tumor) | PTF1A, TCF12 (normal) |
 |  |
| STAD (tumor) | STAD (normal) |
| PTF1A, TCF12 (tumor) | PTF1A, TCF12 (normal) |
 |  |
| THCA (tumor) | THCA (normal) |
| PTF1A, TCF12 (tumor) | PTF1A, TCF12 (normal) |
 |  |
| Top |
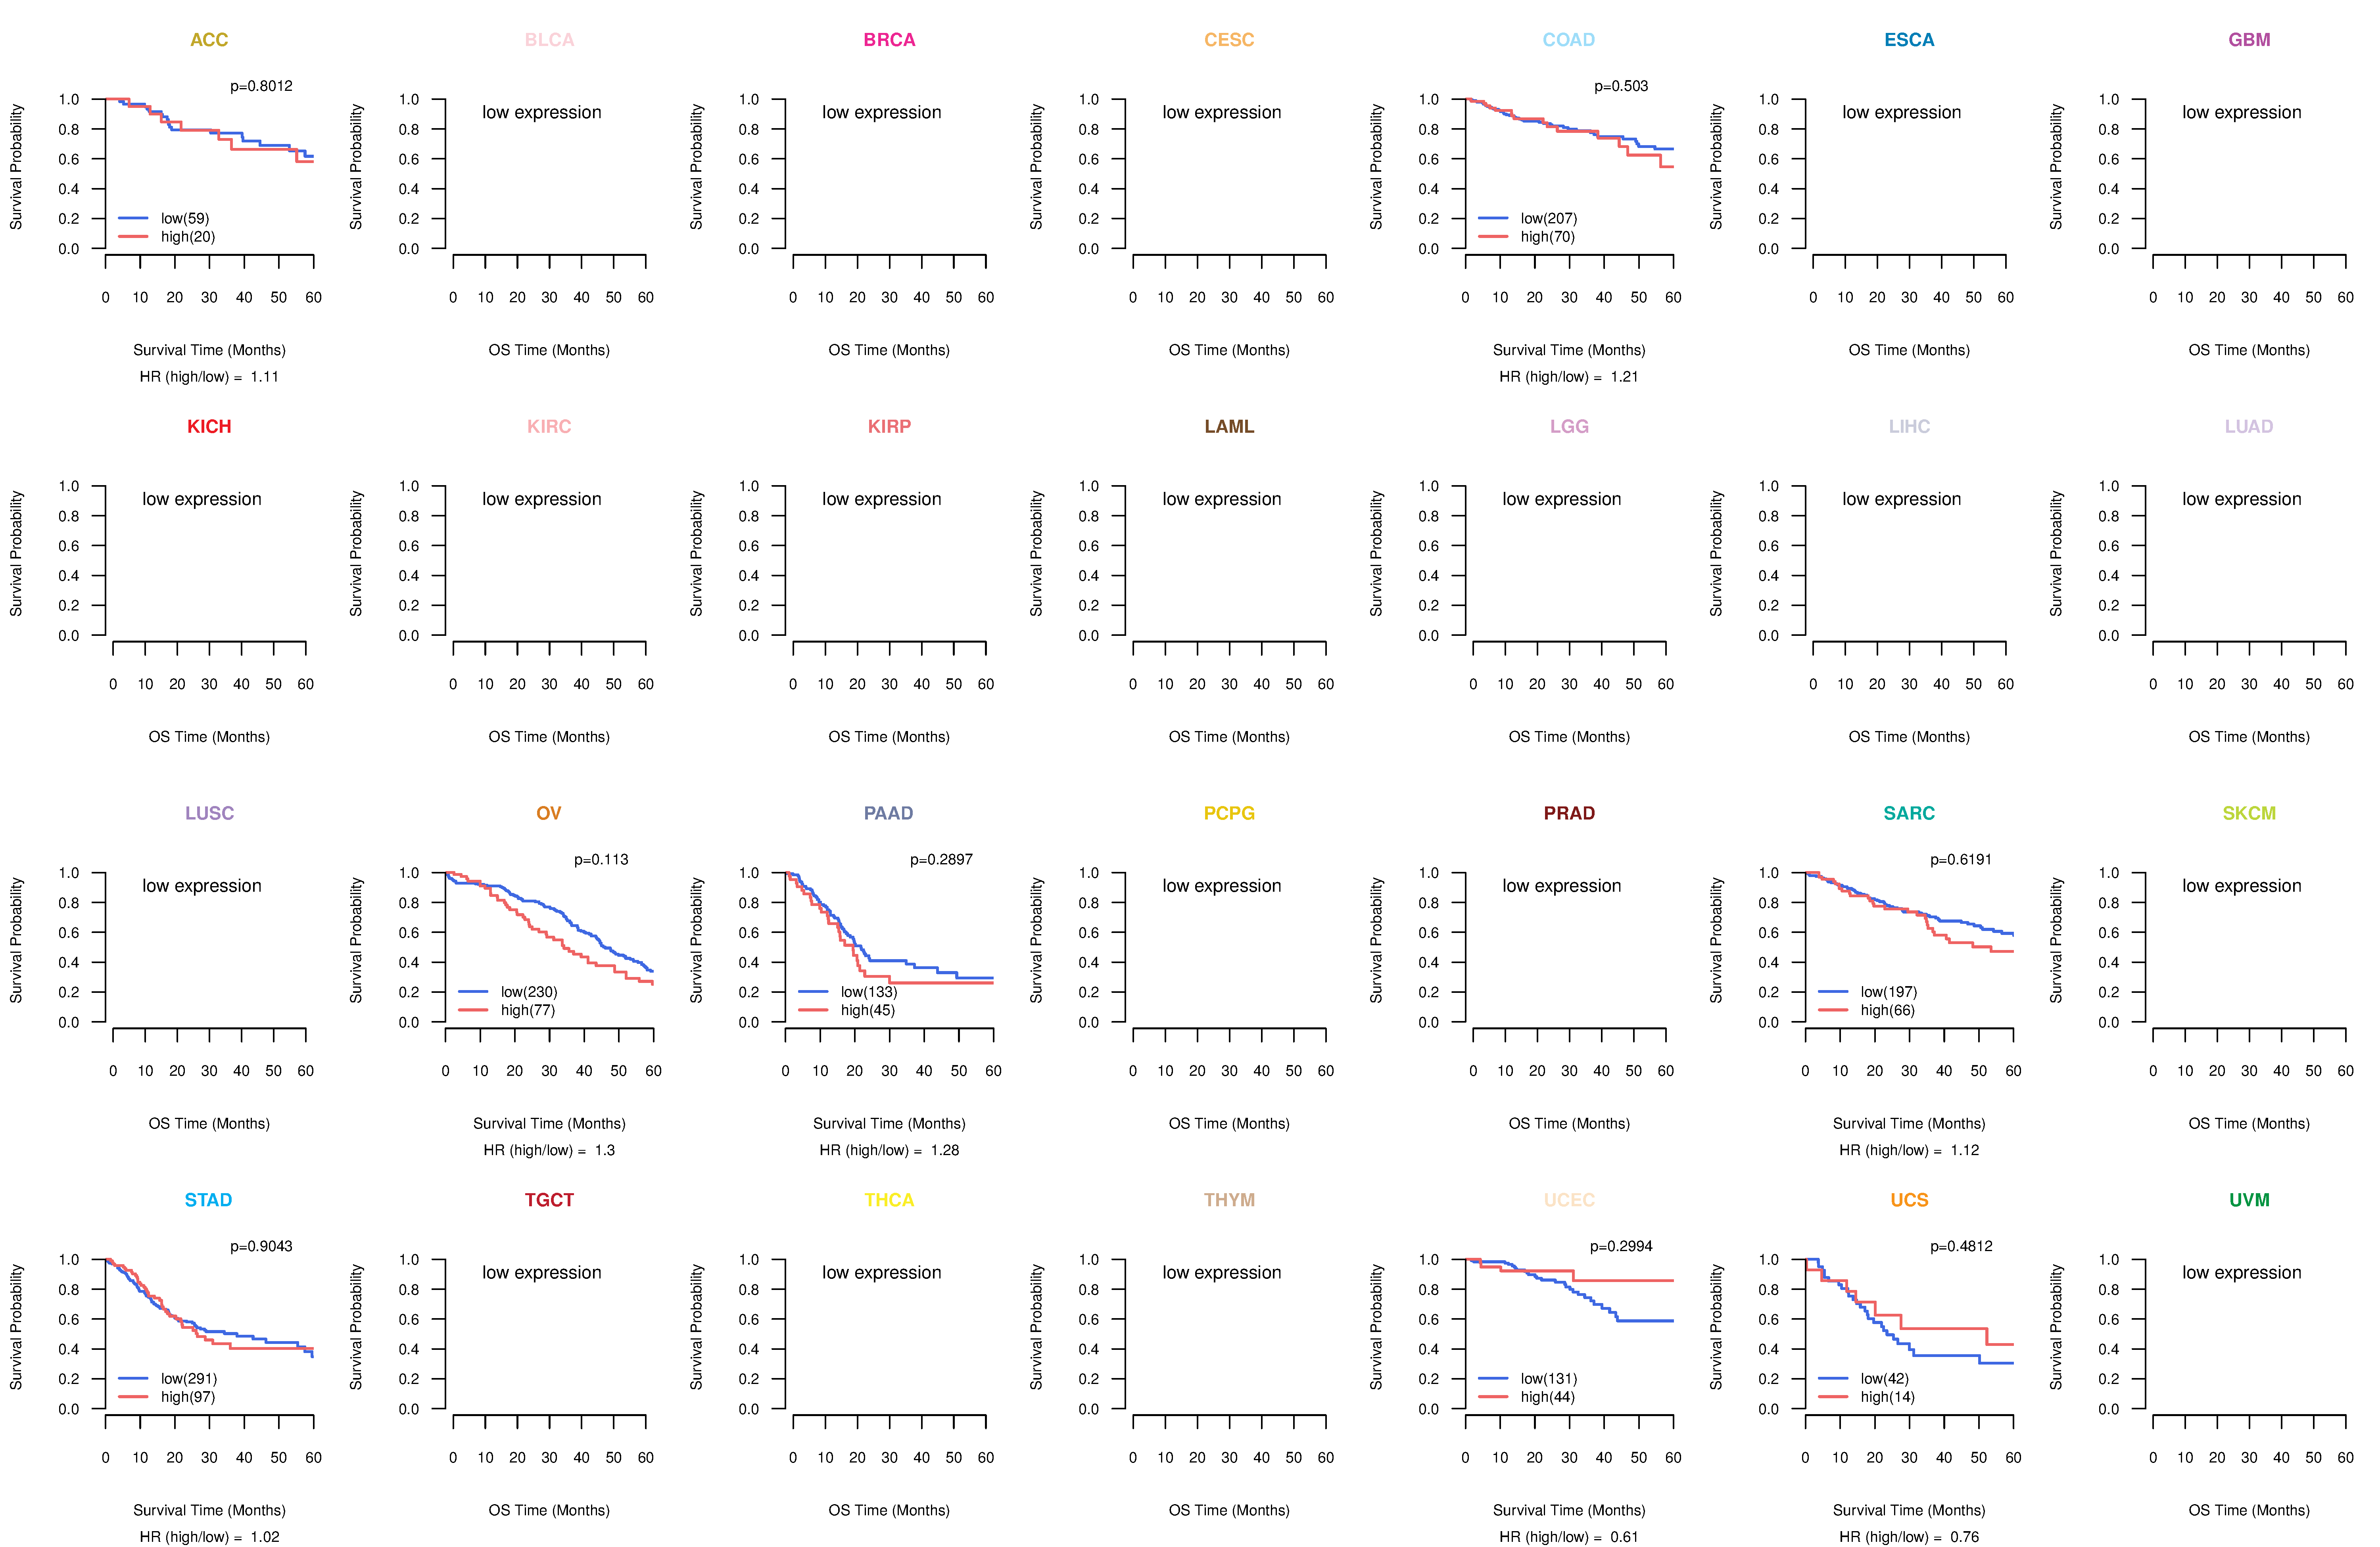
| TissGeneProg for PTF1A |
| Kaplan-Meier plots with logrank tests of overall survival (OS) using 28 cancer types (TCGA IlluminaHiSeq_RNASeqV2, pan-cancer normalized log2(norm_counts+1) data, version 2016-08-16) (TCGA clinicalMatrix, phenotype data, version 2016-04-27) * Click on the image to enlarge it in a new window. |
 |
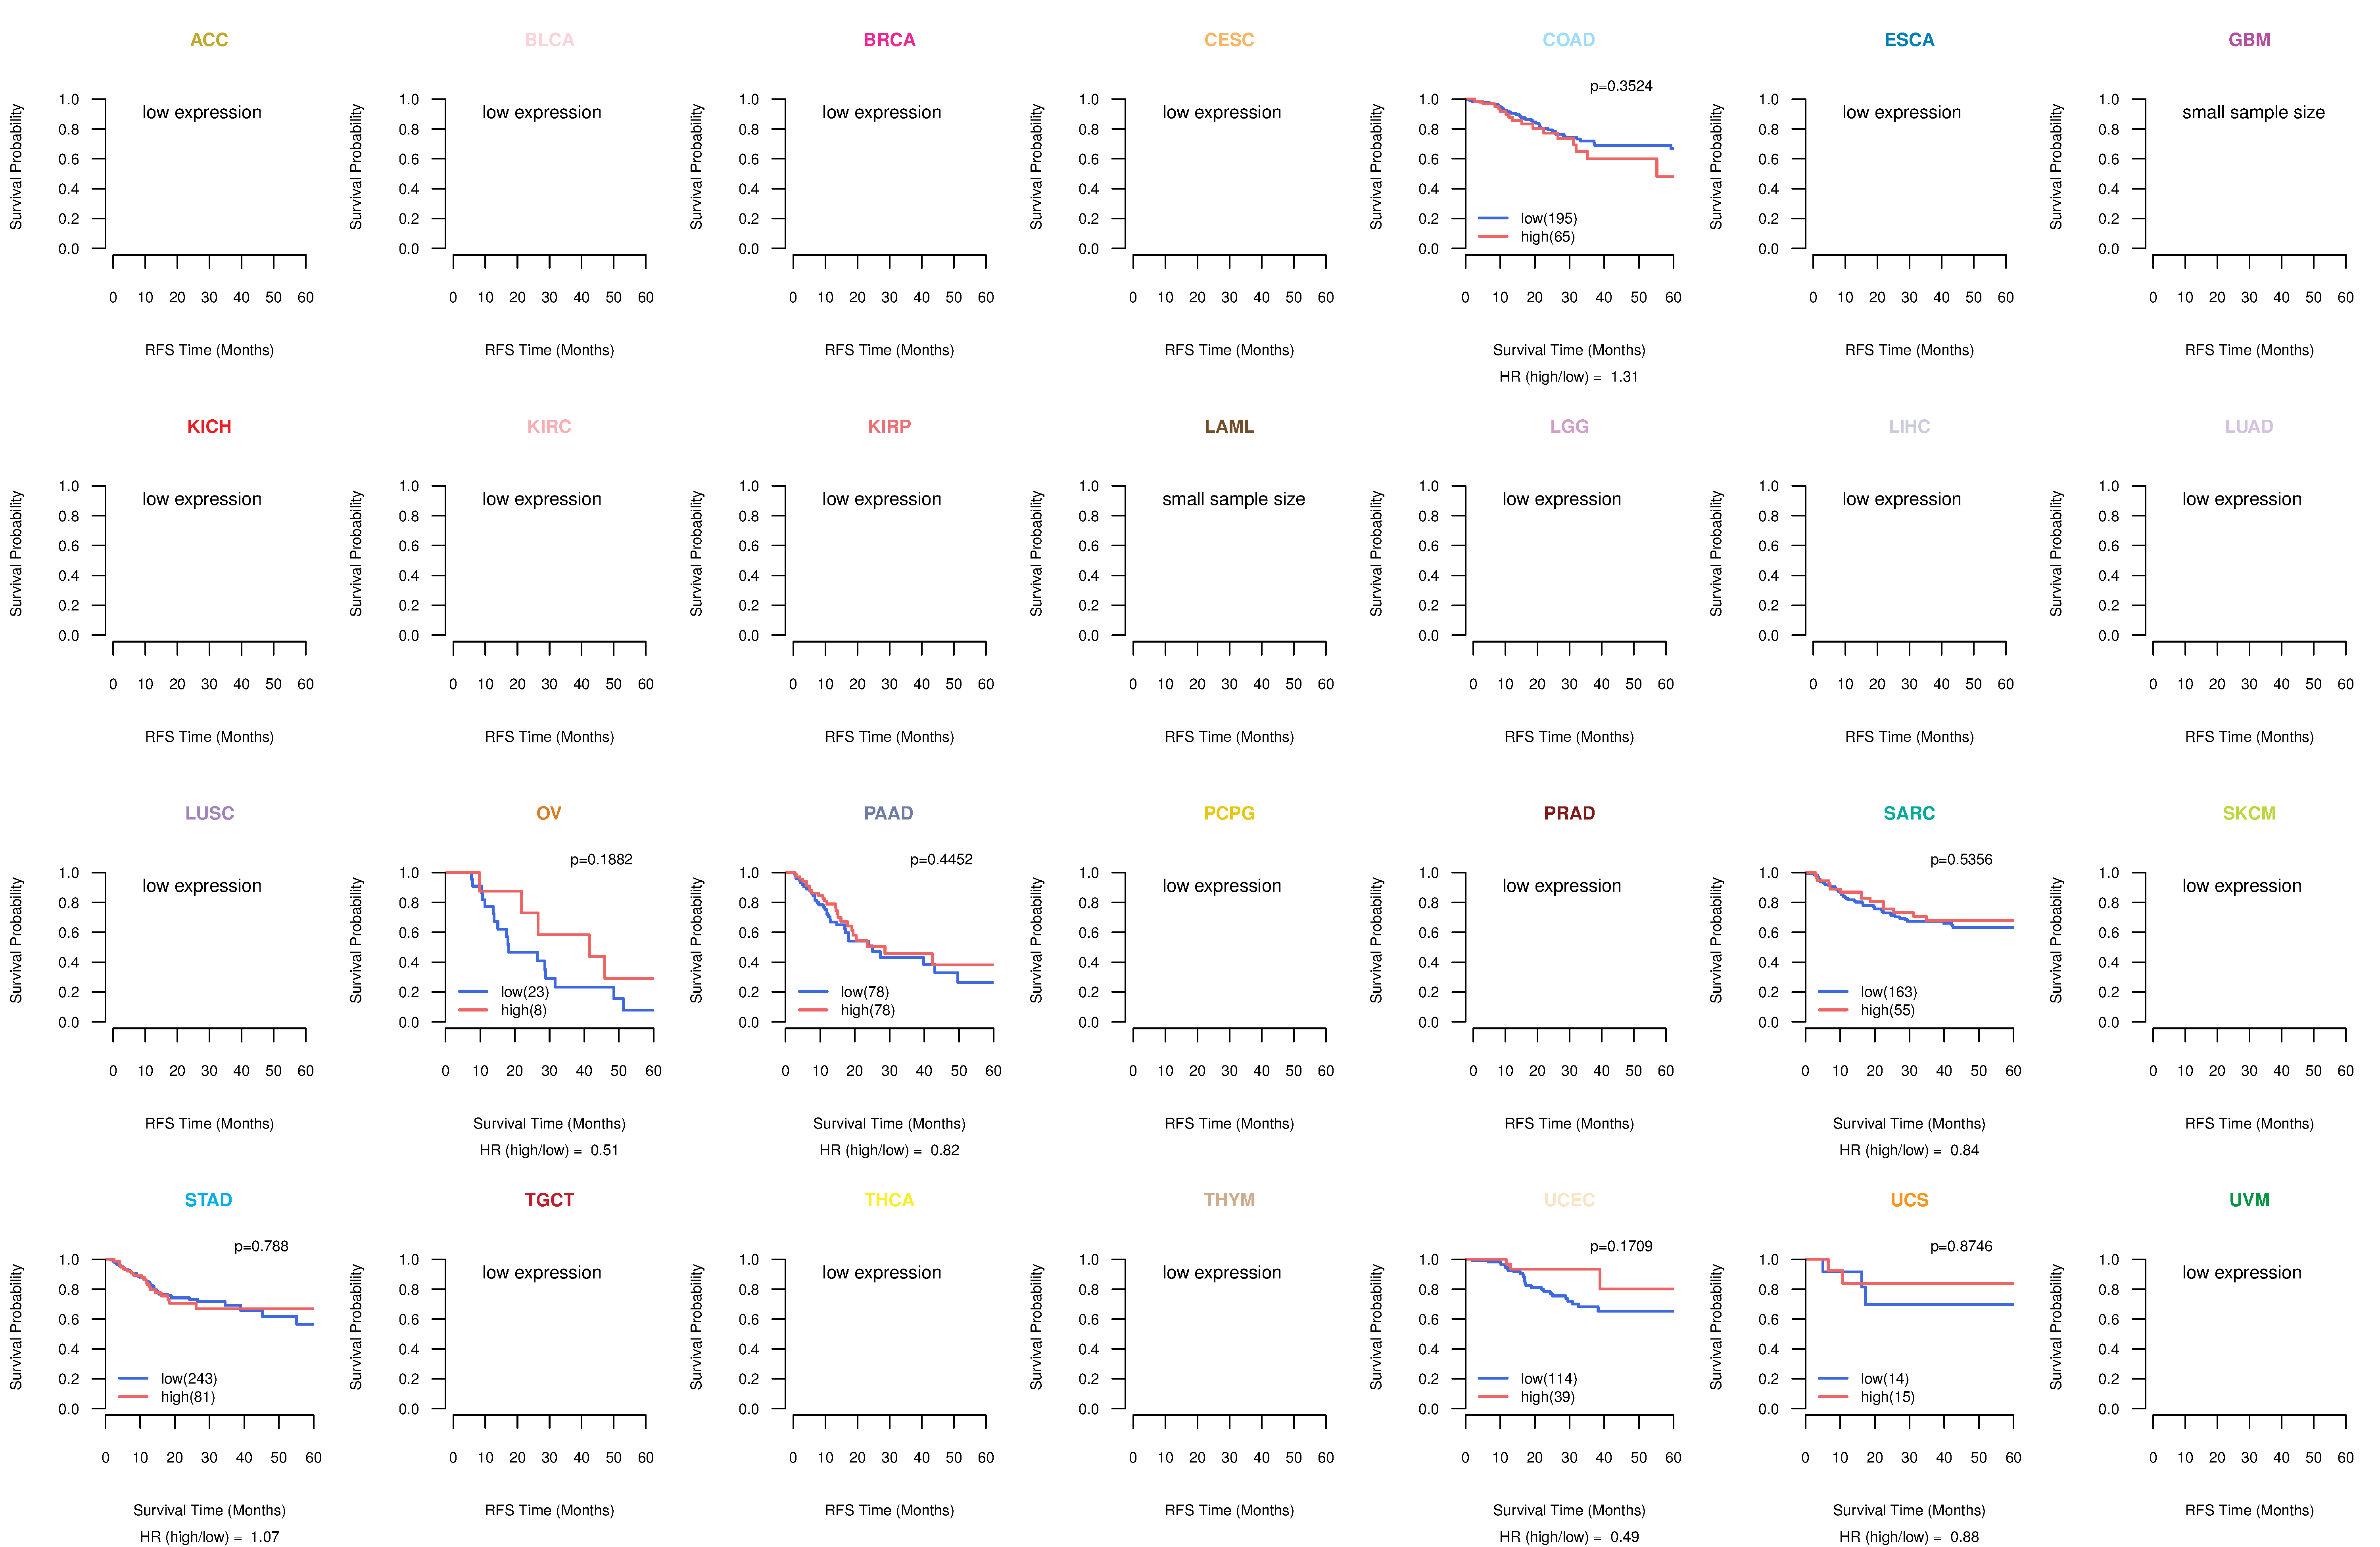
| Kaplan-Meier plots with logrank test of relapse free survival (RFS) using 28 cancer types (TCGA IlluminaHiSeq_RNASeqV2, pan-cancer normalized log2(norm_counts+1) data, version 2016-08-16) (TCGA clinicalMatrix, phenotype data, version 2016-04-27) * Click on the image enlarge it in a new window. |
 |
| Forest plot of Cox proportional hazard ratio (HR) and 95% CI of overall survival (OS) using 28 cancer types (TCGA IlluminaHiSeq_RNASeqV2, pan-cancer normalized log2(norm_counts+1) data, version 2016-08-16) (TCGA clinicalMatrix, phenotype data, version 2016-04-27) * Click on the image enlarge it in a new window. |
 |
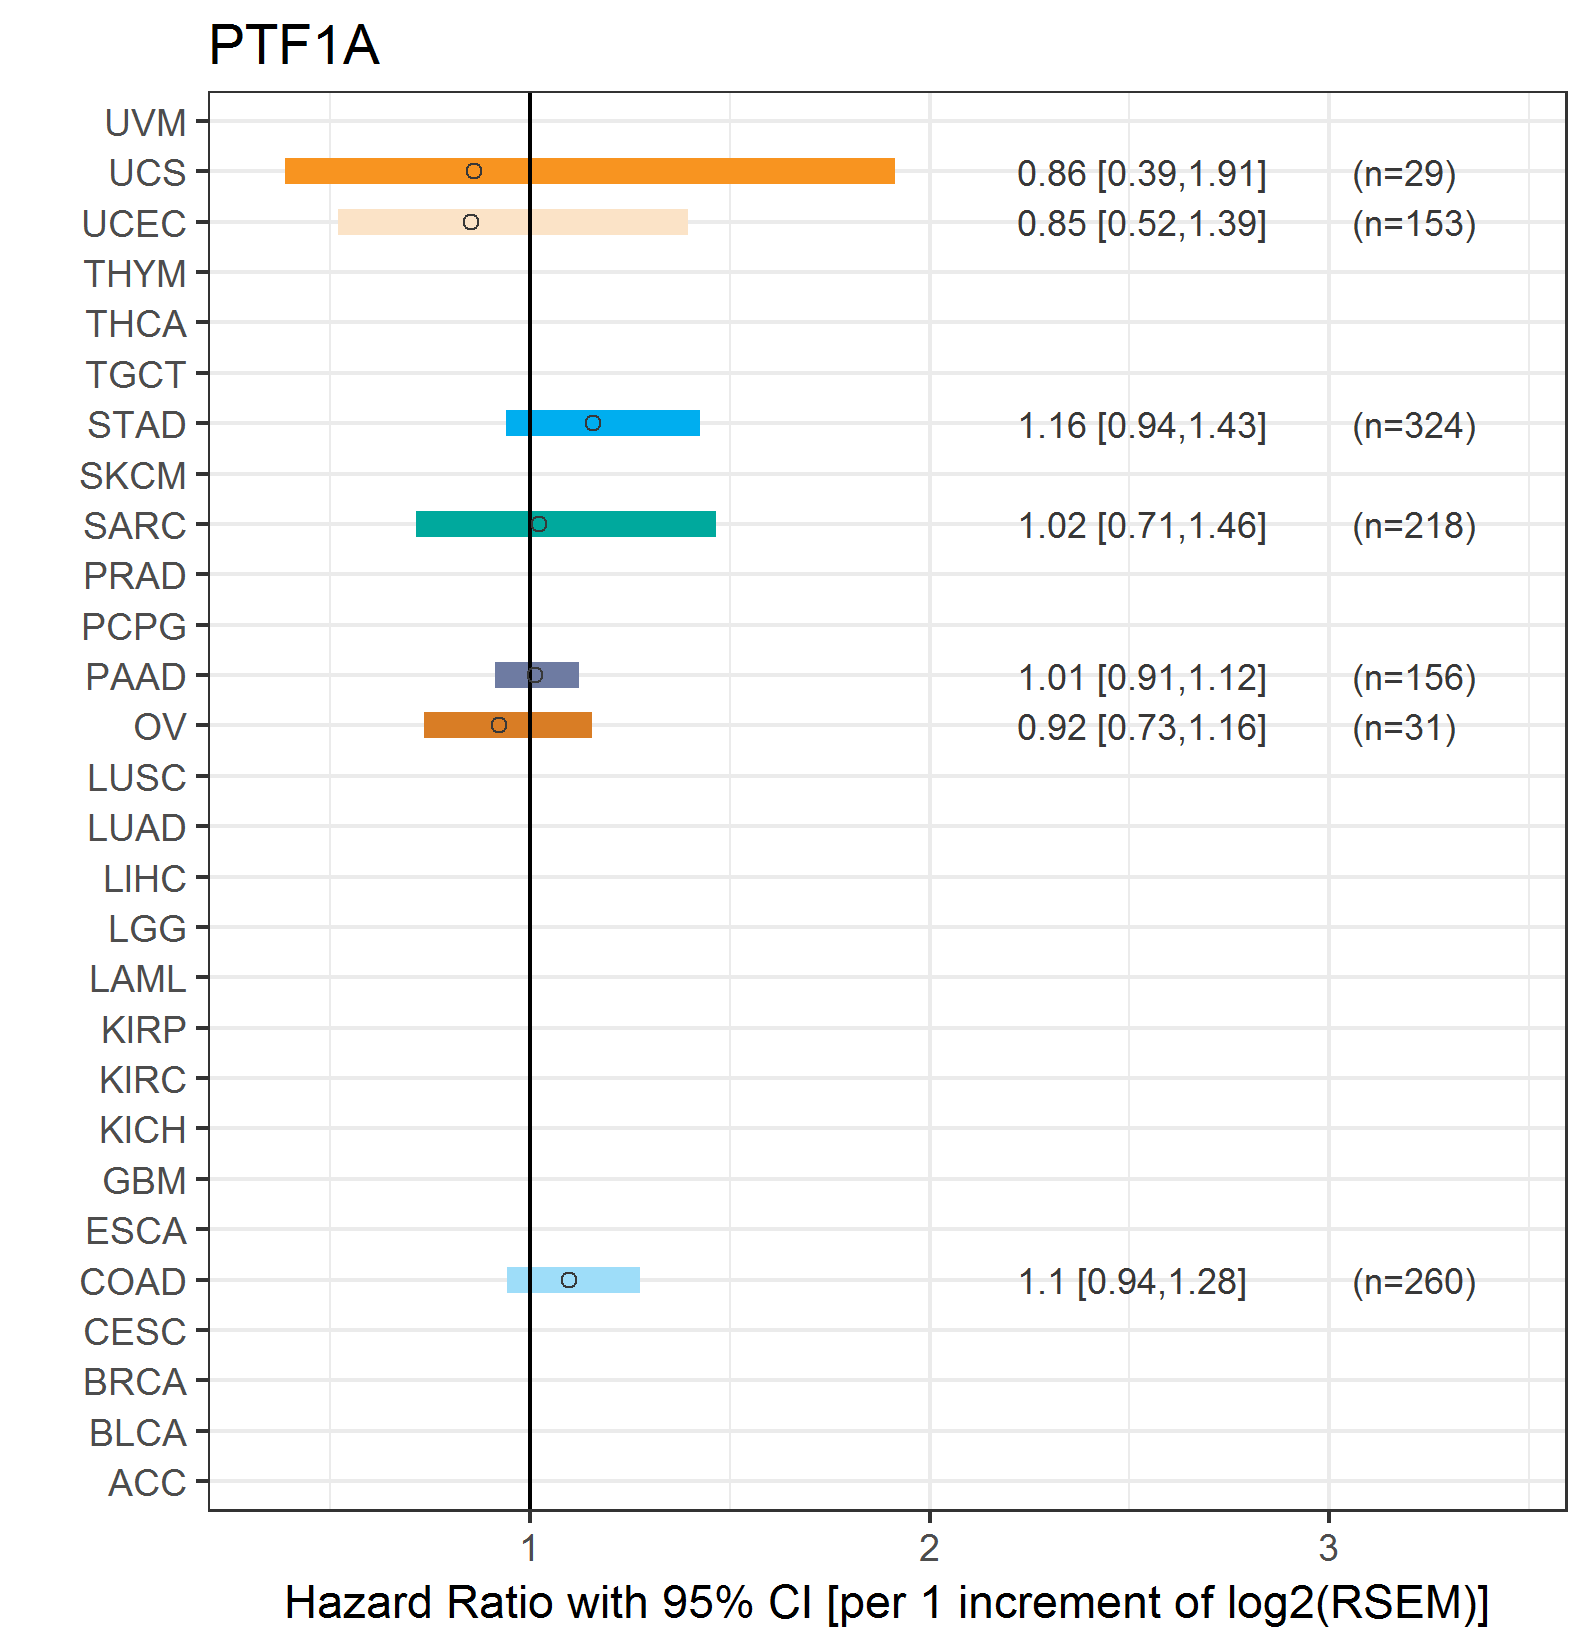
| Forest plot of Cox proportional hazard ratio (HR) and 95% CI of relapse free survival (RFS) using 28 cancer types (TCGA IlluminaHiSeq_RNASeqV2, pan-cancer normalized log2(norm_counts+1) data, version 2016-08-16) (TCGA clinicalMatrix, phenotype data, version 2016-04-27) * Click on the image enlarge it in a new window. |
 |
| Top |
| TissGeneClin for PTF1A |
| TissGeneDrug for PTF1A |
| Drug information targeting TissGene (DrugBank Version 5.0.6, 2017-04-01) |
| DrugBank ID | Drug name | Drug activity | Drug type | Drug status |
| Top |
| TissGeneDisease for PTF1A |
| Disease information associated with TissGene (DisGeNet, 2016-06-01) |
| Disease ID | Disease name | # pubmeds | Source |
| umls:C0158981 | Neonatal diabetes mellitus | 3 | BeFree |
| umls:C0007760 | Cerebellar Diseases | 2 | CTD_human |
| umls:C0596263 | Carcinogenesis | 2 | BeFree |
| umls:C1335302 | Pancreatic Ductal Adenocarcinoma | 2 | BeFree |
| umls:C1836780 | PANCREATIC AND CEREBELLAR AGENESIS | 2 | BeFree,CLINVAR,CTD_human,ORPHANET |
| umls:C1850096 | Pancreatic Agenesis, Congenital | 2 | CTD_human |
| umls:C0000768 | Congenital Abnormality | 1 | BeFree |
| umls:C0221219 | Ectopic pancreas | 1 | BeFree |
| umls:C0235974 | Pancreatic carcinoma | 1 | BeFree |
| umls:C0281361 | Adenocarcinoma of pancreas | 1 | BeFree |
| umls:C0346647 | Malignant neoplasm of pancreas | 1 | BeFree |
| umls:C0860207 | Drug-Induced Liver Injury | 1 | CTD_human |
| umls:C1735591 | VACTERL Association | 1 | BeFree |
| umls:C1737329 | Dysmorphism | 1 | BeFree |
|
Copyright 2016-Present - The University of Texas Health Science Center at Houston (UTHealth) Web File Viewing | How to Report, Fraud, Waste and Abuse | State of Texas | Statewide Search | Texas Homeland Security | Site Policies |