 |
| |
| |
| |
| |
| |
| |
|

| TissGeneSummary for CCDC110 |
 Gene summary Gene summary |
| Basic gene information | Gene symbol | CCDC110 |
| Gene name | coiled-coil domain containing 110 | |
| Synonyms | CT52|KM-HN-1|KMHN1 | |
| Cytomap | UCSC genome browser: 4q35.1 | |
| Type of gene | protein-coding | |
| RefGenes | NM_001145411.1, NM_152775.3, | |
| Description | cancer/testis antigen 52cancer/testis antigen KM-HN-1coiled-coil domain-containing protein 110 | |
| Modification date | 20141207 | |
| dbXrefs | MIM : 609488 | |
| HGNC : HGNC | ||
| Ensembl : ENSG00000168491 | ||
| HPRD : 11335 | ||
| Vega : OTTHUMG00000160415 | ||
| Protein | UniProt: go to UniProt's Cross Reference DB Table | |
| Expression | CleanEX: HS_CCDC110 | |
| BioGPS: 256309 | ||
| Pathway | NCI Pathway Interaction Database: CCDC110 | |
| KEGG: CCDC110 | ||
| REACTOME: CCDC110 | ||
| Pathway Commons: CCDC110 | ||
| Context | iHOP: CCDC110 | |
| ligand binding site mutation search in PubMed: CCDC110 | ||
| UCL Cancer Institute: CCDC110 | ||
| Assigned class in TissGDB* | B | |
| Included tissue-specific gene expression resources | ||
| Specific-tissues in normal samples (assigned by TissGDB using HPA, TiGER, and GTEx) | Testis | |
| Cancer types related to the specific-tissues in cancer samples (assigned by TissGDB using TCGA) | TGCT | |
| Reference showing the relevant tissue of CCDC110 | ||
| Description by TissGene annotations | ||
| * Class A consists of genes with literature evidence and is part of the cTissGenes. Class B consists of only cTissGenes without additional evidence. The remaining genes belong to Class C. |
| Gene ontology having evidence of Inferred from Direct Assay (IDA) from Entrez |
| GO ID | GO term | PubMed ID |
| Top |
| TissGeneExp for CCDC110 |
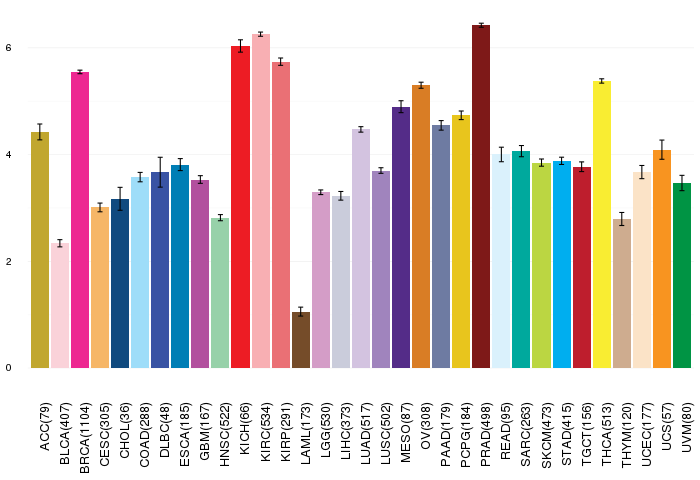
| Gene expressions across 28 cancer types (X-axis: cancer type and Y-axis: log2(norm_counts+1)) (TCGA IlluminaHiSeq_RNASeqV2, pan-cancer normalized log2(norm_counts+1) data, version 2016-08-16) |
 |
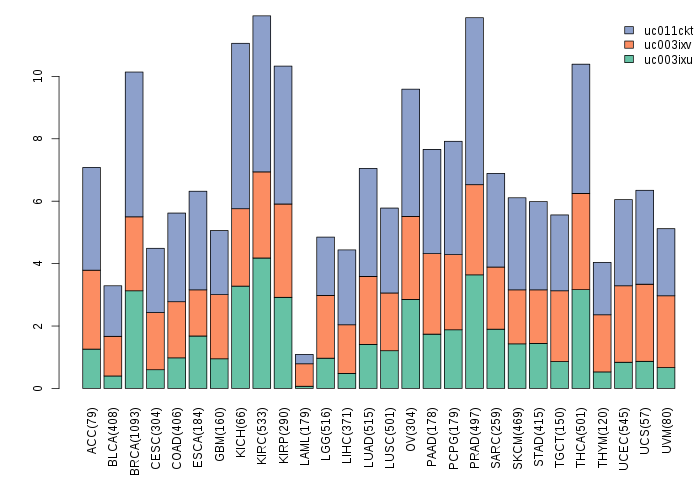
| Gene isoform expressions across 28 cancer types (X-axis: cancer type and Y-axis: log2(norm_counts+1)) (TCGA pan-cancer tcga_rsem_isoform_tpm, version 2016-09-01) |
 |
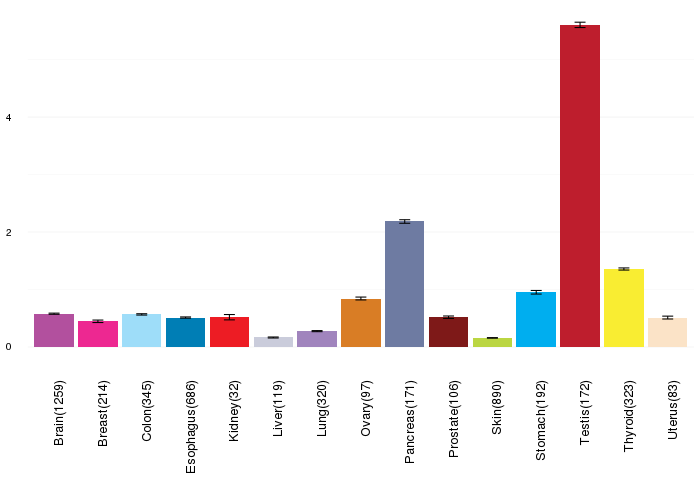
| Gene expressions across normal tissues of GTEx data (GTEx GTEx_Analysis_v6_RNA-seq_RNA-SeQCv1.1.8_gene_rpkm.gct) - Here, we shows the matched tissue types only among our 28 cancer types. |
 |
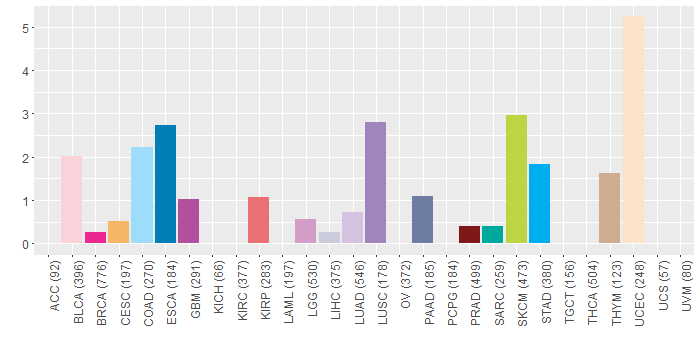
| Different expressions across 14 cancer types with more than 10 samples between matched tumors and normals (X-axis: cancer type and Y-axis: log2(norm_counts+1)) (TCGA IlluminaHiSeq_RNASeqV2, pan-cancer normalized log2(norm_counts+1) data, version 2016-08-16) |
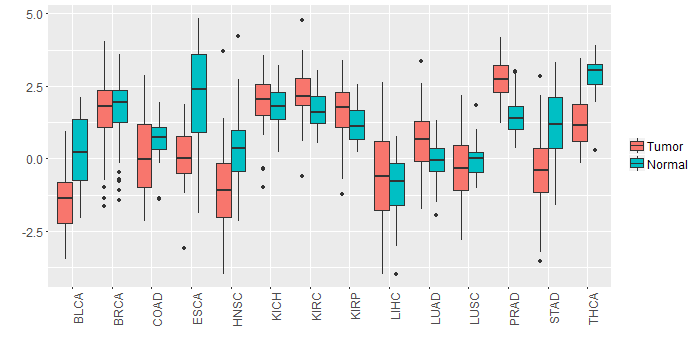 |
| - Significantly differentially expressed cancer types and information. (|Fold change|>1 and FDR<0.05) |
| Cancer type | Mean(exp) in tumor | Mean(exp) in matched normal | Log2FC | P-val. | FDR |
| PRAD | 2.771942197 | 1.449326812 | 1.322615385 | 3.05E-17 | 6.84E-15 |
| HNSC | -1.014212455 | 0.360124755 | -1.374337209 | 8.36E-06 | 4.85E-05 |
| THCA | 1.306351519 | 2.91022101 | -1.603869492 | 2.53E-20 | 1.06E-18 |
| BLCA | -1.378355172 | 0.190071144 | -1.568426316 | 0.000535 | 0.004342482 |
| STAD | -0.343248428 | 1.180242197 | -1.523490625 | 4.76E-05 | 0.00041333 |
| Top |
| TissGene-miRNA for CCDC110 |
| Significantly anti-correlated miRNAs of TissGene across 28 cancer types (Gene-miRNA relations from TargetScanHuman Relsease 7.1, Conserved_Site_Context_Scores.txt.zip, 06.01.2016) (TCGA IlluminaHiSeq_miRNASeq, log2(RPM+1) data, version 2016-11-21) (TCGA IlluminaHiSeq_RNASeqV2, log2(normalized_count+1) data, version 2016-08-16) (Spearman’s Rank Correlation (p-value<0.05 and coefficient<-0.25)) |
| Cancer type | miRNA id | miRNA accession | P-val. | Coeff. | # samples |
| Top |
| TissGeneMut for CCDC110 |
| TissGeneSNV for CCDC110 |
| nsSNV counts per each loci. Different colors of circles represent different cancer types. Circle size denotes number of samples. (TCGA somatic mutation (SNPs and small INDELs) data, version 2016-04-25) * Click on the image to enlarge it in a new window. |
 |
| Somatic nucleotide variants of TissGene across 28 cancer types (X-axis: cancer type and Y-axis: % of mutated samples) The numbers in parentheses are numbers of samples with mutation (nsSNVs). (TCGA somatic mutation (SNPs and small INDELs) data, version 2016-04-25) |
 |
| - nsSNVs sorted by frequency. |
| AAchange | Cancer type | # samples |
| p.R111C | HNSC | 2 |
| p.H551R | BLCA | 2 |
| p.E805K | UCEC | 2 |
| p.E586* | LUSC | 1 |
| p.K353E | ESCA | 1 |
| p.L435Q | ESCA | 1 |
| p.S533F | SKCM | 1 |
| p.H833R | LUAD | 1 |
| p.K342T | STAD | 1 |
| p.R111C | GBM | 1 |
| p.R769* | SARC | 1 |
| p.G603E | BLCA | 1 |
| p.E679* | UCEC | 1 |
| p.E86* | UCEC | 1 |
| p.Q423* | STAD | 1 |
| p.S695* | BLCA | 1 |
| p.E259K | HNSC | 1 |
| p.N564S | BLCA | 1 |
| p.E360A | UCEC | 1 |
| p.E635* | UCEC | 1 |
| p.Q423X | STAD | 1 |
| p.H832L | LIHC | 1 |
| p.S495I | KIRP | 1 |
| p.D776N | BRCA | 1 |
| p.A542T | COAD | 1 |
| p.D827Y | UCEC | 1 |
| p.I428M | LUSC | 1 |
| p.E618D | LUAD | 1 |
| p.V750I | PAAD | 1 |
| p.I363M | BLCA | 1 |
| p.K624N | READ | 1 |
| p.I736N | PAAD | 1 |
| p.T807A | UCEC | 1 |
| p.F384L | LGG | 1 |
| p.G365D | GBM | 1 |
| p.I363T | LUSC | 1 |
| p.F133L | SKCM | 1 |
| p.T226N | STAD | 1 |
| p.N196S | STAD | 1 |
| p.K777T | UCEC | 1 |
| p.E679K | SKCM | 1 |
| p.K509* | PRAD | 1 |
| p.R621T | CESC | 1 |
| p.Q615* | SKCM | 1 |
| p.L299M | COAD | 1 |
| p.S147N | SKCM | 1 |
| p.D221G | GBM | 1 |
| p.S409F | COAD | 1 |
| p.R379G | STAD | 1 |
| p.Q632E | HNSC | 1 |
| p.P209Q | COAD | 1 |
| p.N433I | KIRP | 1 |
| p.Y500D | COAD | 1 |
| p.S817L | SKCM | 1 |
| p.M212I | SKCM | 1 |
| p.I614M | COAD | 1 |
| p.D257V | HNSC | 1 |
| p.Q811E | LUSC | 1 |
| p.R173I | COAD | 1 |
| p.N516D | SKCM | 1 |
| p.N105K | STAD | 1 |
| p.E673K | UCEC | 1 |
| p.S533Y | UCEC | 1 |
| p.E119D | UCEC | 1 |
| p.E805K | COAD | 1 |
| p.V408X | COAD | 1 |
| p.E728* | UCEC | 1 |
| p.Y771N | UCEC | 1 |
| p.A542T | LGG | 1 |
| p.S344C | SKCM | 1 |
| p.L642F | COAD | 1 |
| p.T759S | UCEC | 1 |
| p.T652I | UCEC | 1 |
| p.L630F | LGG | 1 |
| p.Q247H | STAD | 1 |
| p.L435I | LUSC | 1 |
| p.S812G | SKCM | 1 |
| p.E485D | SKCM | 1 |
| p.T740I | LUAD | 1 |
| p.P362S | SKCM | 1 |
| p.R765Q | HNSC | 1 |
| p.V750I | BLCA | 1 |
| p.E251K | ESCA | 1 |
| p.G233E | PRAD | 1 |
| p.N199Y | SKCM | 1 |
| p.L534S | SKCM | 1 |
| p.R311I | COAD | 1 |
| p.A215S | THYM | 1 |
| p.P98A | BLCA | 1 |
| p.T652N | THYM | 1 |
| p.D240V | STAD | 1 |
| p.L385I | BLCA | 1 |
| p.L532V | HNSC | 1 |
| p.I490M | STAD | 1 |
| p.Q538H | UCEC | 1 |
| p.N25H | UCEC | 1 |
| p.P161Q | UCEC | 1 |
| p.L299M | BRCA | 1 |
| p.L819F | LUAD | 1 |
| p.K549N | LUSC | 1 |
| p.S651Y | ESCA | 1 |
| p.I569T | ESCA | 1 |
| p.Q615H | KIRP | 1 |
| Top |
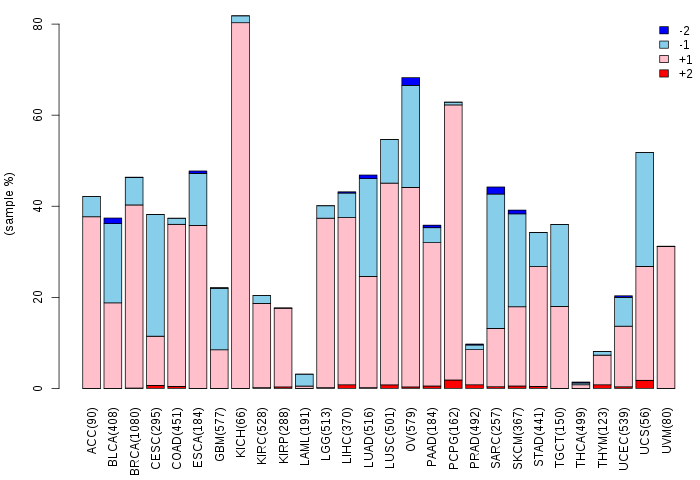
| TissGeneCNV for CCDC110 |
| Copy number variations of TissGene across 28 cancer types (X-axis: cancer type and Y-axis: % of CNV samples) (TCGA Gistic2_CopyNumber_Gistic2_all_data_by_genes, Gistic2 copy number data, version 2016-08-16) |
 |
| Top |
| TissGeneFusions for CCDC110 |
| Fusion genes including TissGene (ChimerDB 3.0, 2016-12-01 and TCGA fusion Portal 2015-12-01) |
| Database | Src | Cancer type | Sample | Fusion gene | ORF | 5'-gene BP | 3'-gene BP |
| Chimerdb3.0 | FusionScan | BRCA | TCGA-E2-A15E-06A | KIAA1430-CCDC110 | In-Frame | chr4:186096939 | chr4:186383862 |
| TCGAfusionPortal | PRADA | BRCA | TCGA-E2-A15E-01A | KIAA1430-CCDC110 | Out-of-frame | Chr4:186096940 | Chr4:186384203 |
| Top |
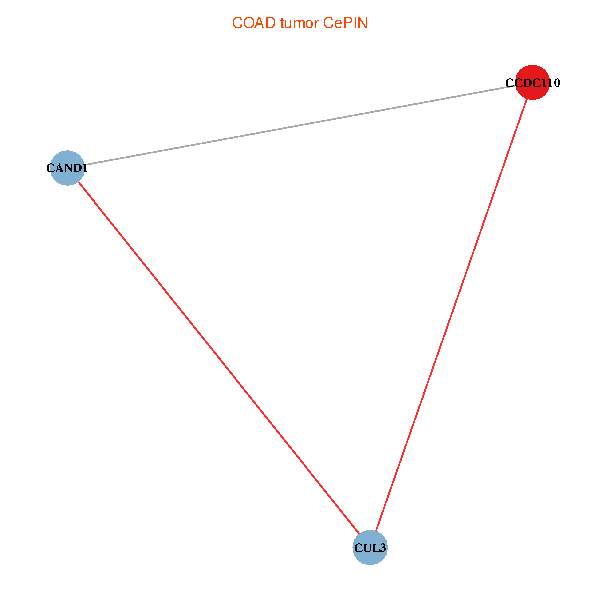
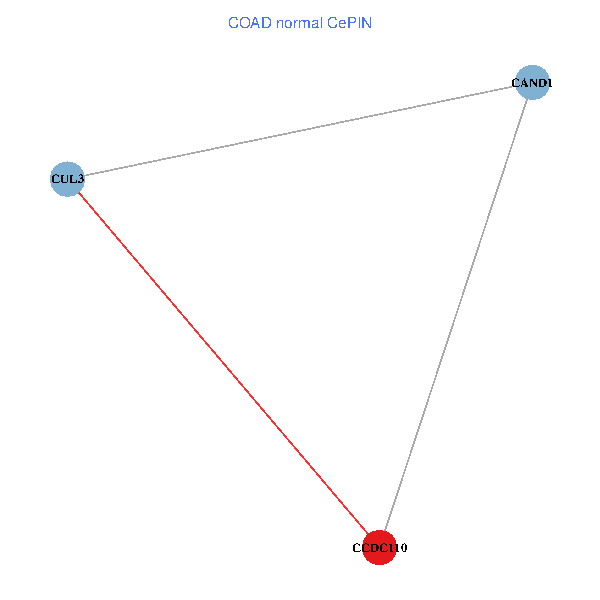
| TissGeneNet for CCDC110 |
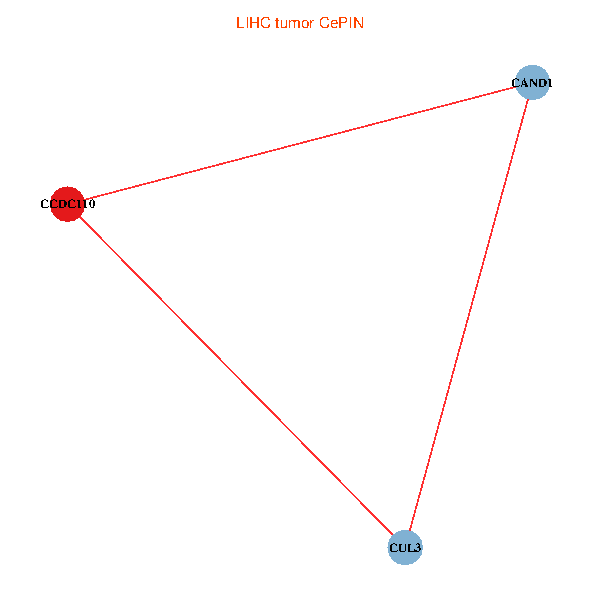
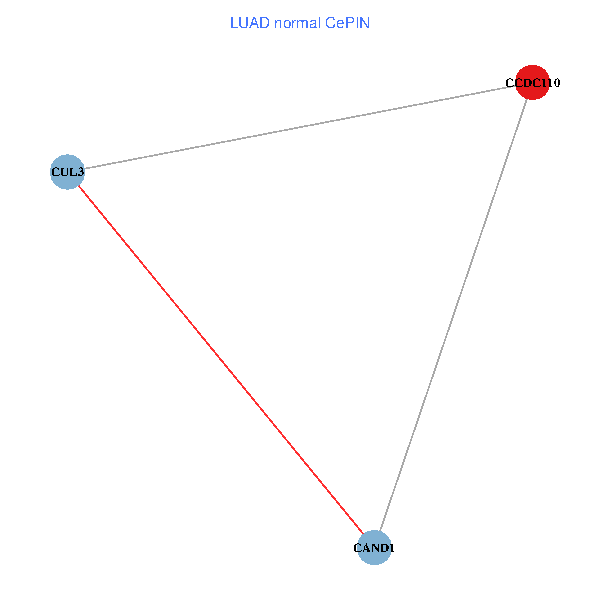
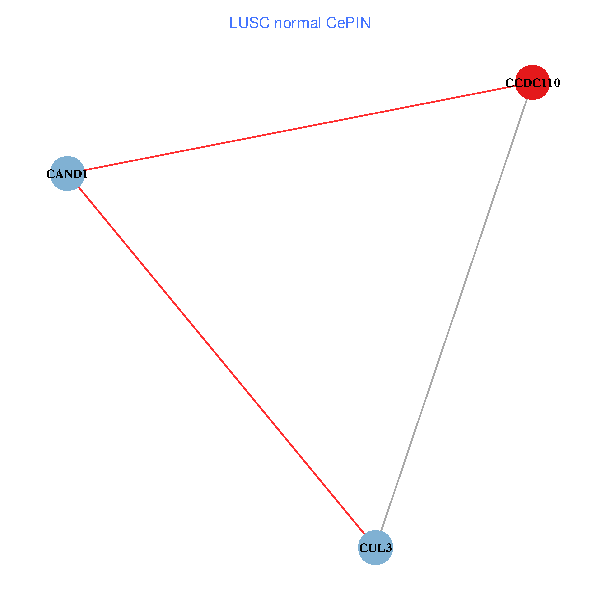
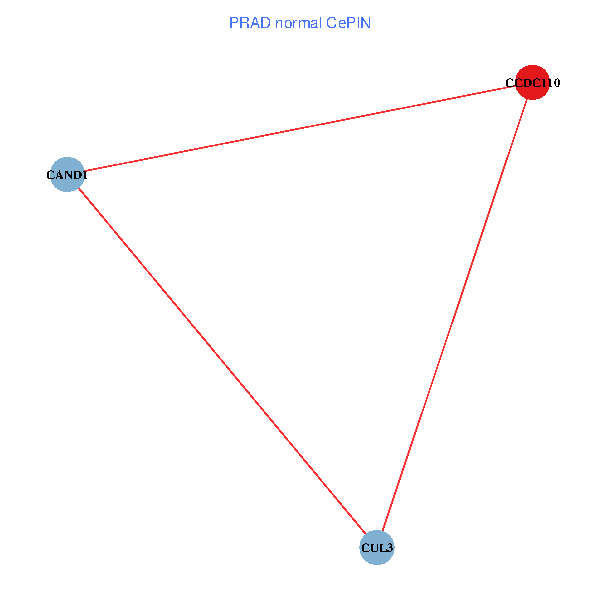
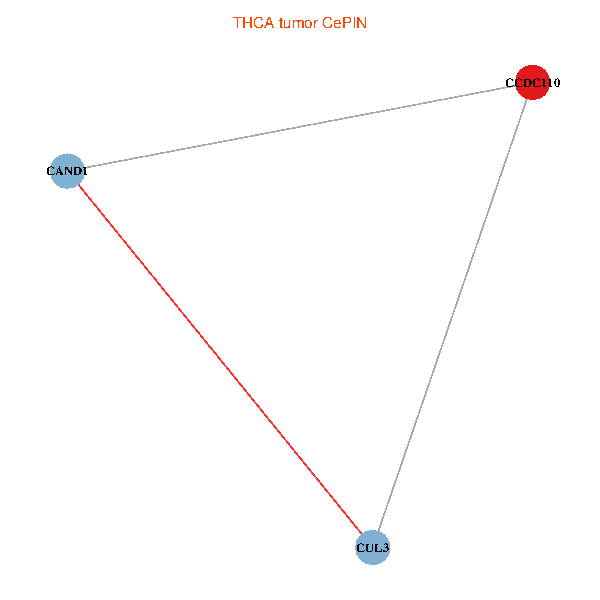
| Co-expressed gene networks based on protein-protein interaction data (CePIN) (TCGA IlluminaHiSeq_RNASeqV2, pan-cancer normalized log2(norm_counts+1) data, version 2016-08-16) (PINA2 ppi data) |
| BRCA (tumor) | BRCA (normal) |
| CCDC110, CAND1, CUL3 (tumor) | CCDC110, CAND1, CUL3 (normal) |
 |  |
| COAD (tumor) | COAD (normal) |
| CCDC110, CAND1, CUL3 (tumor) | CCDC110, CAND1, CUL3 (normal) |
 |  |
| HNSC (tumor) | HNSC (normal) |
| CCDC110, CAND1, CUL3 (tumor) | CCDC110, CAND1, CUL3 (normal) |
 |  |
| KICH (tumor) | KICH (normal) |
| CCDC110, CAND1, CUL3 (tumor) | CCDC110, CAND1, CUL3 (normal) |
 |  |
| KIRC (tumor) | KIRC (normal) |
| CCDC110, CAND1, CUL3 (tumor) | CCDC110, CAND1, CUL3 (normal) |
 |  |
| KIRP (tumor) | KIRP (normal) |
| CCDC110, CAND1, CUL3 (tumor) | CCDC110, CAND1, CUL3 (normal) |
 |  |
| LIHC (tumor) | LIHC (normal) |
| CCDC110, CAND1, CUL3 (tumor) | CCDC110, CAND1, CUL3 (normal) |
 |  |
| LUAD (tumor) | LUAD (normal) |
| CCDC110, CAND1, CUL3 (tumor) | CCDC110, CAND1, CUL3 (normal) |
 |  |
| LUSC (tumor) | LUSC (normal) |
| CCDC110, CAND1, CUL3 (tumor) | CCDC110, CAND1, CUL3 (normal) |
 |  |
| PRAD (tumor) | PRAD (normal) |
| CCDC110, CAND1, CUL3 (tumor) | CCDC110, CAND1, CUL3 (normal) |
 |  |
| STAD (tumor) | STAD (normal) |
| CCDC110, CAND1, CUL3 (tumor) | CCDC110, CAND1, CUL3 (normal) |
 |  |
| THCA (tumor) | THCA (normal) |
| CCDC110, CAND1, CUL3 (tumor) | CCDC110, CAND1, CUL3 (normal) |
 |  |
| Top |
| TissGeneProg for CCDC110 |
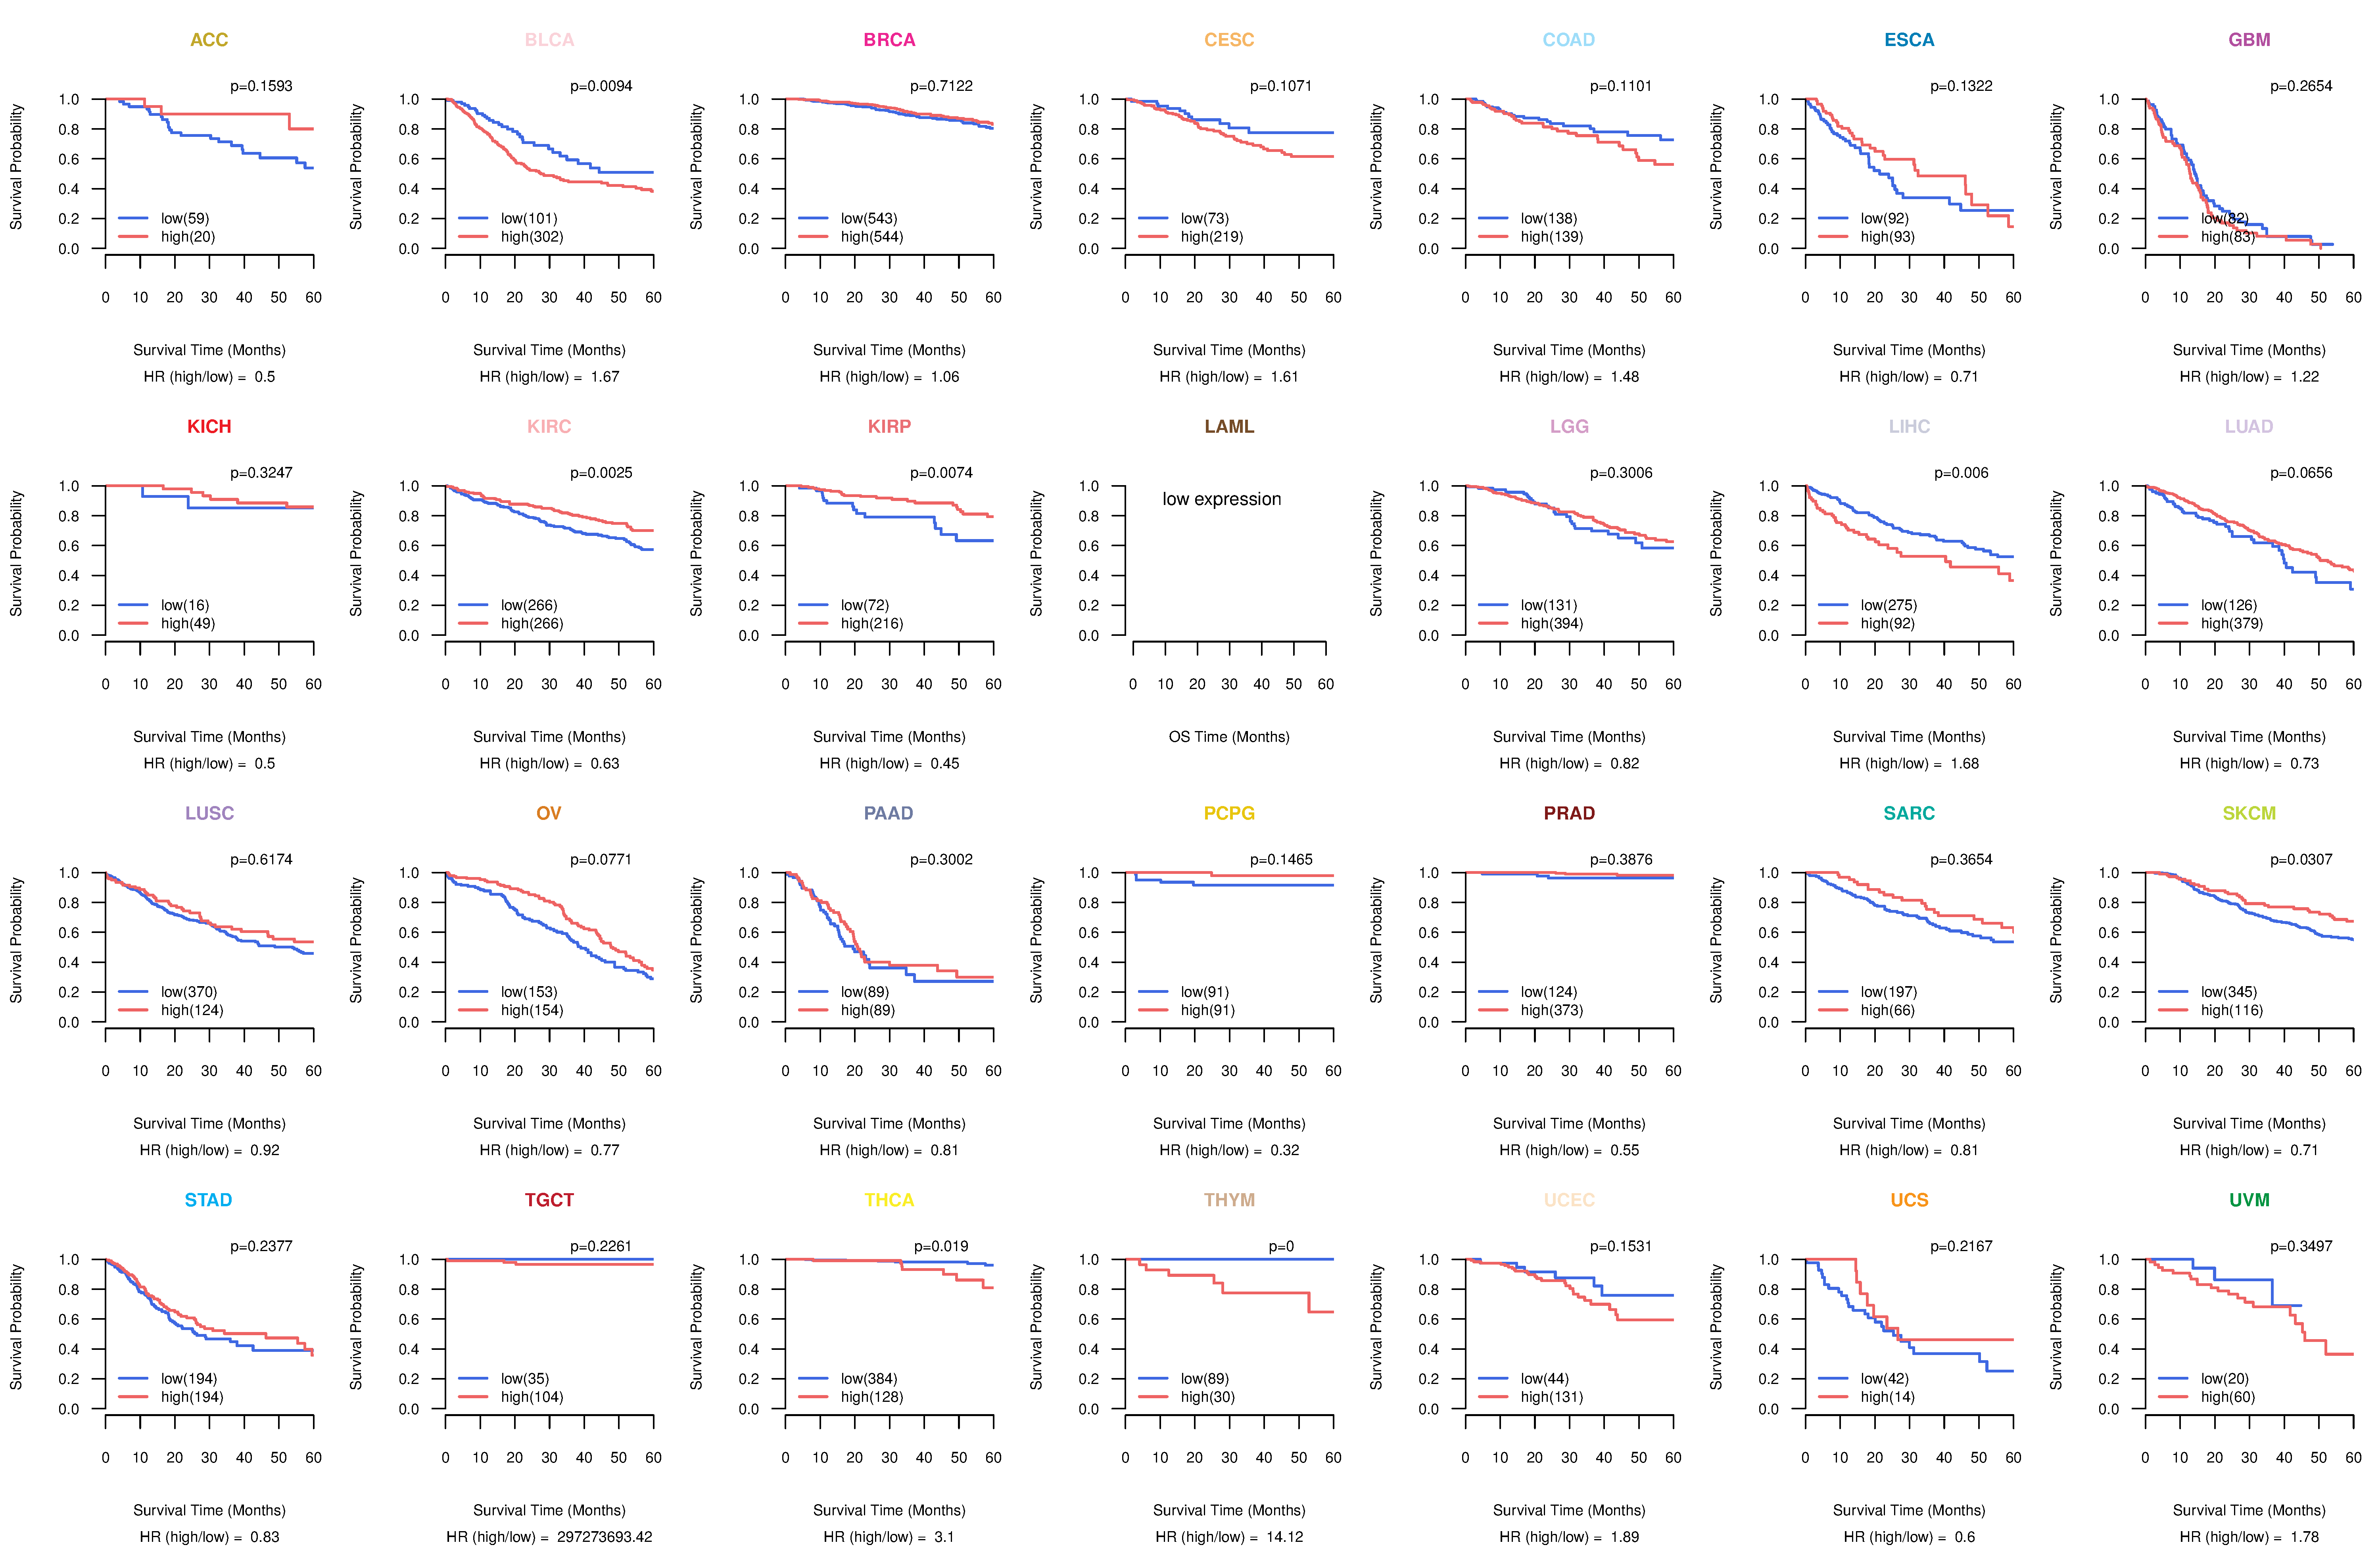
| Kaplan-Meier plots with logrank tests of overall survival (OS) using 28 cancer types (TCGA IlluminaHiSeq_RNASeqV2, pan-cancer normalized log2(norm_counts+1) data, version 2016-08-16) (TCGA clinicalMatrix, phenotype data, version 2016-04-27) * Click on the image to enlarge it in a new window. |
 |
| Kaplan-Meier plots with logrank test of relapse free survival (RFS) using 28 cancer types (TCGA IlluminaHiSeq_RNASeqV2, pan-cancer normalized log2(norm_counts+1) data, version 2016-08-16) (TCGA clinicalMatrix, phenotype data, version 2016-04-27) * Click on the image enlarge it in a new window. |
 |
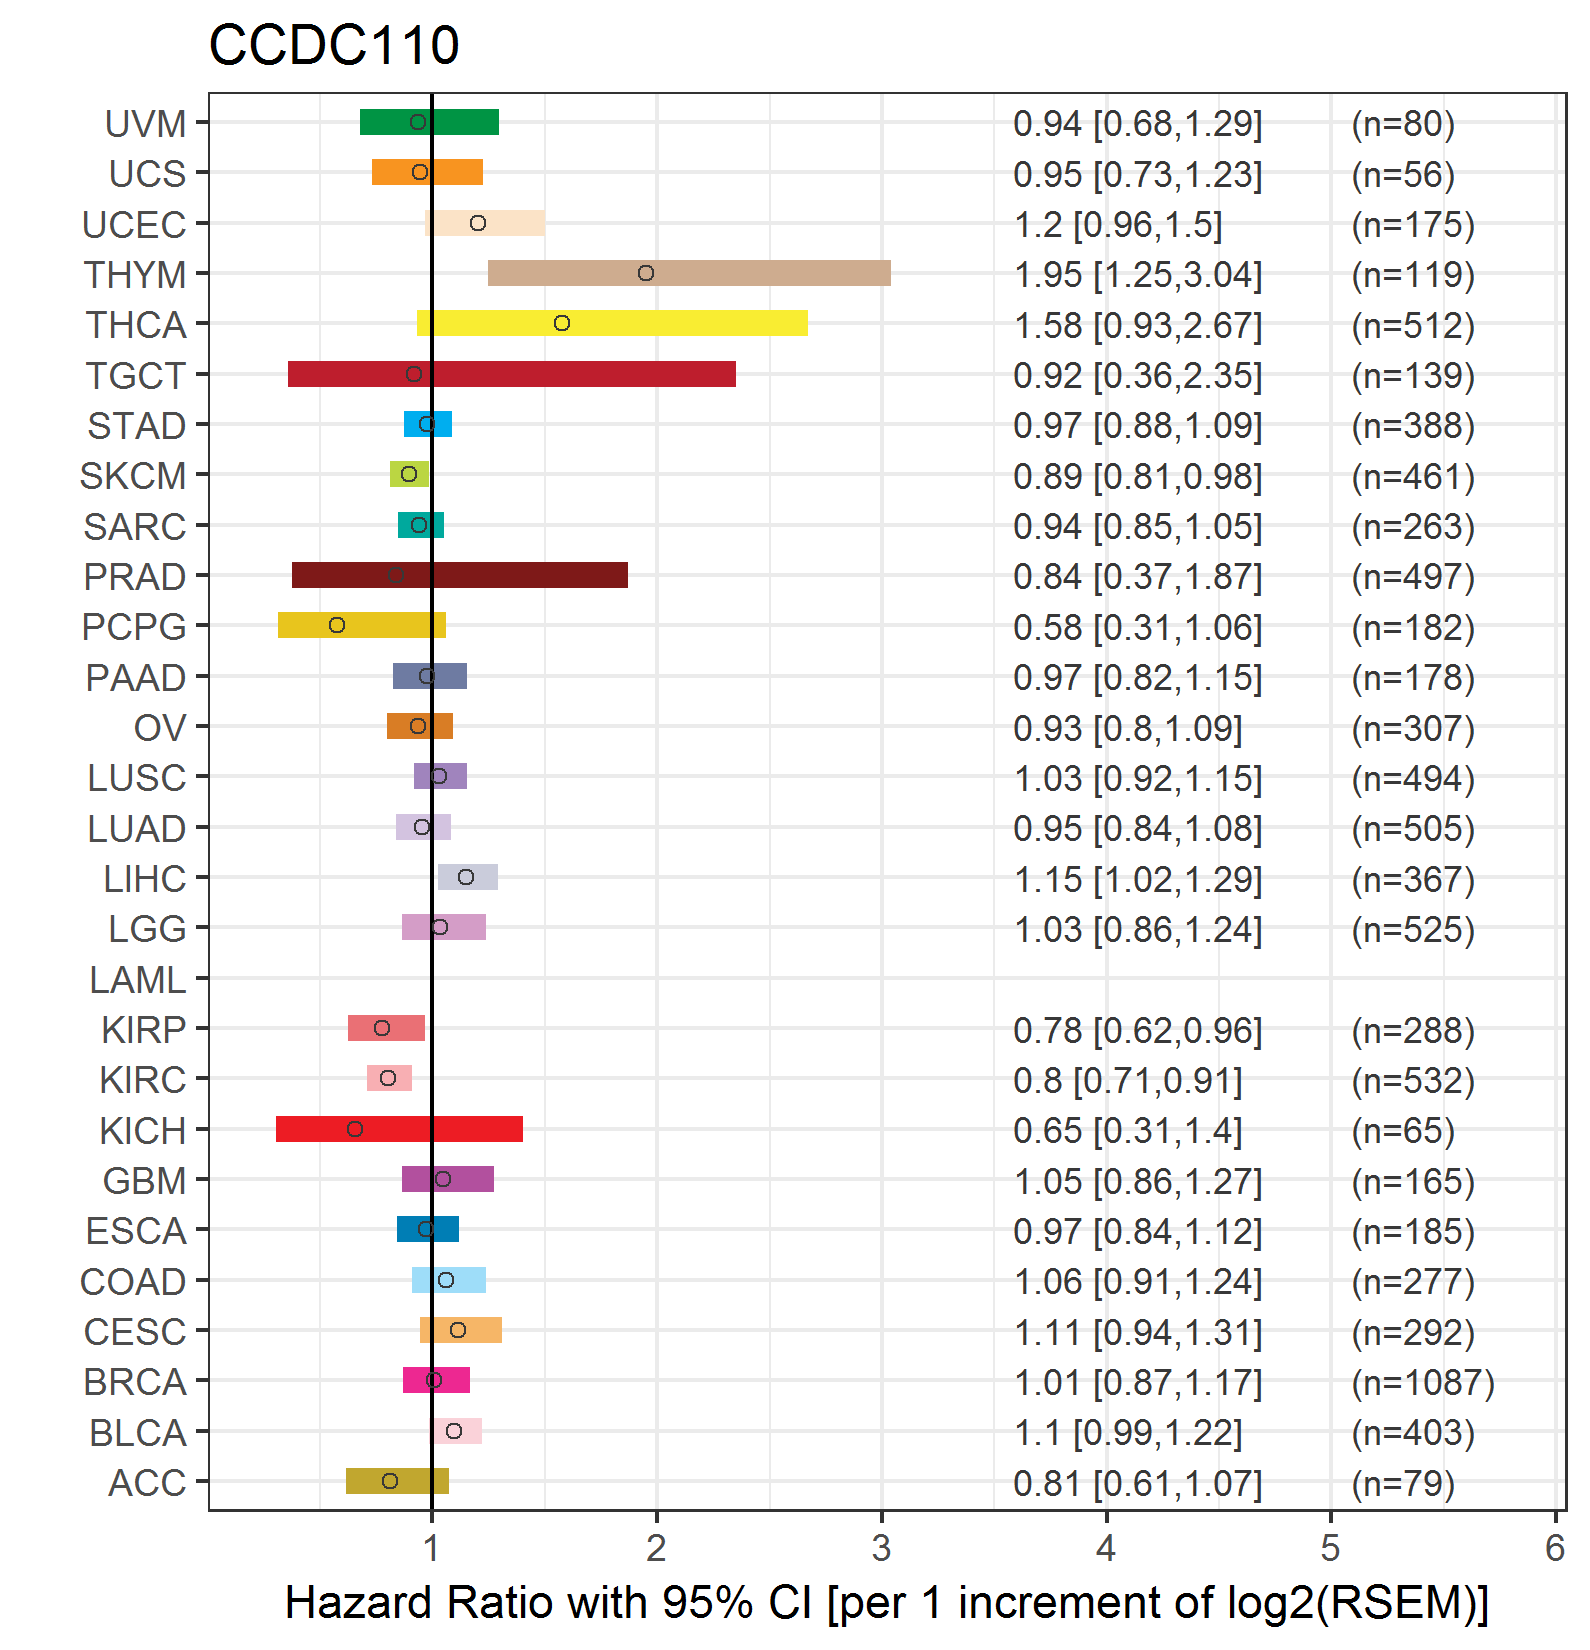
| Forest plot of Cox proportional hazard ratio (HR) and 95% CI of overall survival (OS) using 28 cancer types (TCGA IlluminaHiSeq_RNASeqV2, pan-cancer normalized log2(norm_counts+1) data, version 2016-08-16) (TCGA clinicalMatrix, phenotype data, version 2016-04-27) * Click on the image enlarge it in a new window. |
 |
| Forest plot of Cox proportional hazard ratio (HR) and 95% CI of relapse free survival (RFS) using 28 cancer types (TCGA IlluminaHiSeq_RNASeqV2, pan-cancer normalized log2(norm_counts+1) data, version 2016-08-16) (TCGA clinicalMatrix, phenotype data, version 2016-04-27) * Click on the image enlarge it in a new window. |
 |
| Top |
| TissGeneClin for CCDC110 |
| TissGeneDrug for CCDC110 |
| Drug information targeting TissGene (DrugBank Version 5.0.6, 2017-04-01) |
| DrugBank ID | Drug name | Drug activity | Drug type | Drug status |
| Top |
| TissGeneDisease for CCDC110 |
| Disease information associated with TissGene (DisGeNet, 2016-06-01) |
| Disease ID | Disease name | # pubmeds | Source |
|
Copyright 2016-Present - The University of Texas Health Science Center at Houston (UTHealth) Web File Viewing | How to Report, Fraud, Waste and Abuse | State of Texas | Statewide Search | Texas Homeland Security | Site Policies |