 |
| |
| |
| |
| |
| |
| |
|

| TissGeneSummary for DNAI1 |
 Gene summary Gene summary |
| Basic gene information | Gene symbol | DNAI1 |
| Gene name | dynein, axonemal, intermediate chain 1 | |
| Synonyms | CILD1|DIC1|ICS1|PCD | |
| Cytomap | UCSC genome browser: 9p13.3 | |
| Type of gene | protein-coding | |
| RefGenes | NM_001281428.1, NM_012144.3, | |
| Description | dynein intermediate chain 1, axonemaldynein, axonemal, intermediate polypeptide 1immotile cilia syndrome 1 | |
| Modification date | 20141219 | |
| dbXrefs | MIM : 604366 | |
| HGNC : HGNC | ||
| Ensembl : ENSG00000122735 | ||
| HPRD : 05080 | ||
| Vega : OTTHUMG00000019825 | ||
| Protein | UniProt: go to UniProt's Cross Reference DB Table | |
| Expression | CleanEX: HS_DNAI1 | |
| BioGPS: 27019 | ||
| Pathway | NCI Pathway Interaction Database: DNAI1 | |
| KEGG: DNAI1 | ||
| REACTOME: DNAI1 | ||
| Pathway Commons: DNAI1 | ||
| Context | iHOP: DNAI1 | |
| ligand binding site mutation search in PubMed: DNAI1 | ||
| UCL Cancer Institute: DNAI1 | ||
| Assigned class in TissGDB* | C | |
| Included tissue-specific gene expression resources | TiGER,GTEx | |
| Specific-tissues in normal samples (assigned by TissGDB using HPA, TiGER, and GTEx) | Testis | |
| Cancer types related to the specific-tissues in cancer samples (assigned by TissGDB using TCGA) | TGCT | |
| Reference showing the relevant tissue of DNAI1 | ||
| Description by TissGene annotations | Fused withTSGene | |
| * Class A consists of genes with literature evidence and is part of the cTissGenes. Class B consists of only cTissGenes without additional evidence. The remaining genes belong to Class C. |
| Gene ontology having evidence of Inferred from Direct Assay (IDA) from Entrez |
| GO ID | GO term | PubMed ID |
| Top |
| TissGeneExp for DNAI1 |
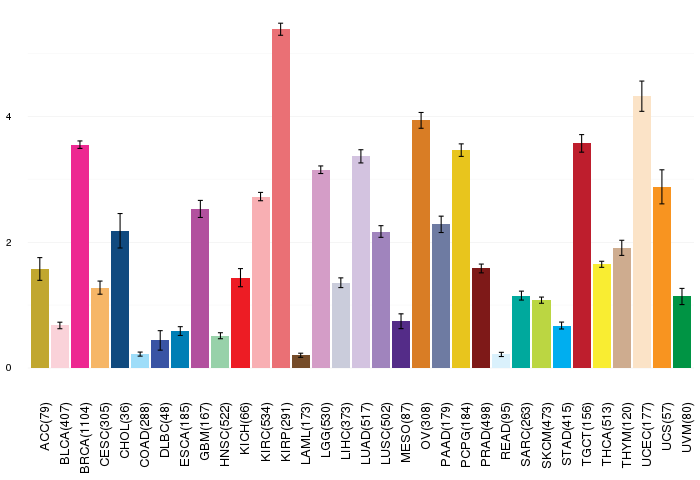
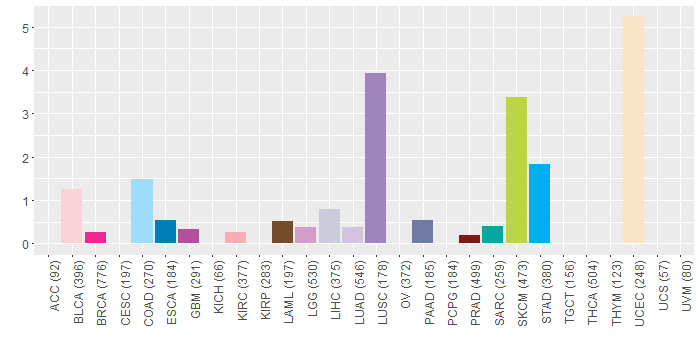
| Gene expressions across 28 cancer types (X-axis: cancer type and Y-axis: log2(norm_counts+1)) (TCGA IlluminaHiSeq_RNASeqV2, pan-cancer normalized log2(norm_counts+1) data, version 2016-08-16) |
 |
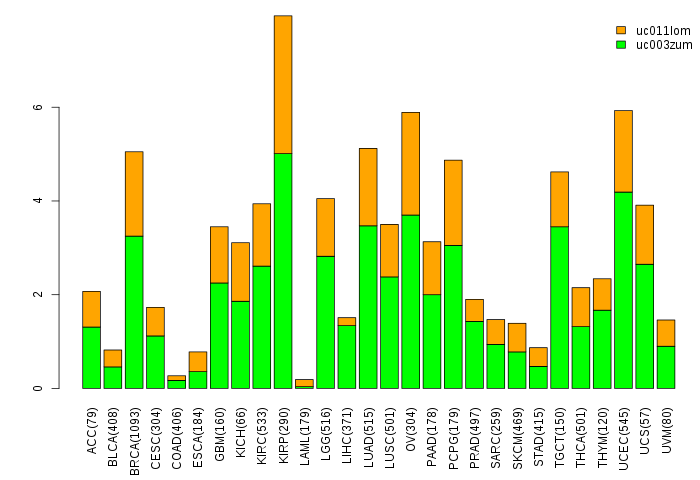
| Gene isoform expressions across 28 cancer types (X-axis: cancer type and Y-axis: log2(norm_counts+1)) (TCGA pan-cancer tcga_rsem_isoform_tpm, version 2016-09-01) |
 |
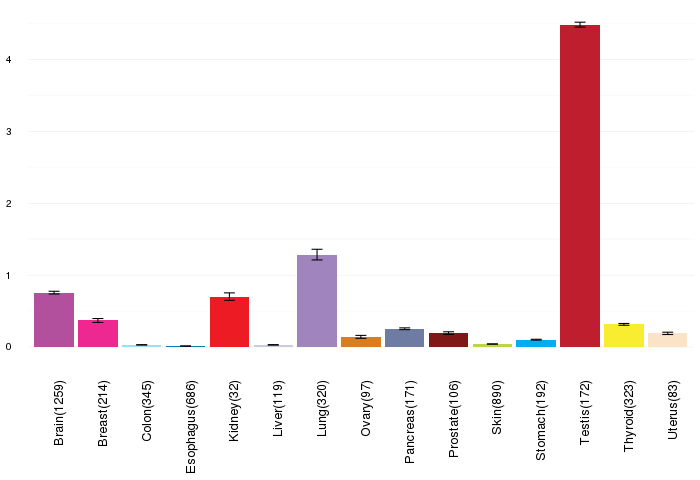
| Gene expressions across normal tissues of GTEx data (GTEx GTEx_Analysis_v6_RNA-seq_RNA-SeQCv1.1.8_gene_rpkm.gct) - Here, we shows the matched tissue types only among our 28 cancer types. |
 |
| Different expressions across 14 cancer types with more than 10 samples between matched tumors and normals (X-axis: cancer type and Y-axis: log2(norm_counts+1)) (TCGA IlluminaHiSeq_RNASeqV2, pan-cancer normalized log2(norm_counts+1) data, version 2016-08-16) |
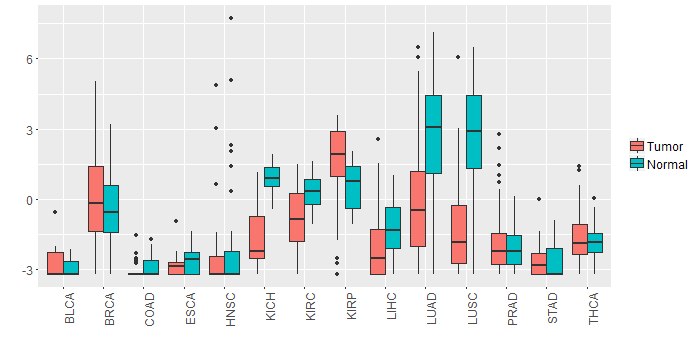 |
| - Significantly differentially expressed cancer types and information. (|Fold change|>1 and FDR<0.05) |
| Cancer type | Mean(exp) in tumor | Mean(exp) in matched normal | Log2FC | P-val. | FDR |
| KIRC | -0.81871056 | 0.312343607 | -1.131054167 | 8.09E-09 | 2.48E-08 |
| KICH | -1.748847393 | 0.914300607 | -2.663148 | 2.56E-11 | 2.24E-10 |
| LUAD | -0.120024496 | 2.625511711 | -2.745536207 | 4.34E-08 | 1.79E-07 |
| LUSC | -1.203121589 | 2.541723509 | -3.744845098 | 2.92E-12 | 1.30E-11 |
| KIRP | 1.562912357 | 0.528502982 | 1.034409375 | 0.00707 | 0.016125066 |
| Top |
| TissGene-miRNA for DNAI1 |
| Significantly anti-correlated miRNAs of TissGene across 28 cancer types (Gene-miRNA relations from TargetScanHuman Relsease 7.1, Conserved_Site_Context_Scores.txt.zip, 06.01.2016) (TCGA IlluminaHiSeq_miRNASeq, log2(RPM+1) data, version 2016-11-21) (TCGA IlluminaHiSeq_RNASeqV2, log2(normalized_count+1) data, version 2016-08-16) (Spearman’s Rank Correlation (p-value<0.05 and coefficient<-0.25)) |
| Cancer type | miRNA id | miRNA accession | P-val. | Coeff. | # samples |
| Top |
| TissGeneMut for DNAI1 |
| TissGeneSNV for DNAI1 |
| nsSNV counts per each loci. Different colors of circles represent different cancer types. Circle size denotes number of samples. (TCGA somatic mutation (SNPs and small INDELs) data, version 2016-04-25) * Click on the image to enlarge it in a new window. |
 |
 |
| Somatic nucleotide variants of TissGene across 28 cancer types (X-axis: cancer type and Y-axis: % of mutated samples) The numbers in parentheses are numbers of samples with mutation (nsSNVs). (TCGA somatic mutation (SNPs and small INDELs) data, version 2016-04-25) |
 |
| - nsSNVs sorted by frequency. |
| AAchange | Cancer type | # samples |
| p.G519E | SKCM | 2 |
| p.V393M | UCEC | 1 |
| p.R663H | HNSC | 1 |
| p.W323X | LIHC | 1 |
| p.A600E | HNSC | 1 |
| p.A538T | LUSC | 1 |
| p.G353S | SKCM | 1 |
| p.S381N | UCEC | 1 |
| p.R650C | COAD | 1 |
| p.Q241H | LUSC | 1 |
| p.V386I | LIHC | 1 |
| p.E64K | SKCM | 1 |
| p.S542* | BRCA | 1 |
| p.E176Q | READ | 1 |
| p.G515S | LUSC | 1 |
| p.R650H | UCEC | 1 |
| p.D356G | HNSC | 1 |
| p.S131F | KIRC | 1 |
| p.I460M | UCEC | 1 |
| p.V135A | READ | 1 |
| p.A262T | UCEC | 1 |
| p.S595Y | LGG | 1 |
| p.G118A | BLCA | 1 |
| p.D648N | PRAD | 1 |
| p.A426V | LIHC | 1 |
| p.V496A | UCEC | 1 |
| p.G142R | SKCM | 1 |
| p.H539Y | STAD | 1 |
| p.K256E | BLCA | 1 |
| p.D611Y | SKCM | 1 |
| p.E517K | SKCM | 1 |
| p.I654V | BLCA | 1 |
| p.A198D | UCEC | 1 |
| p.T252A | LUSC | 1 |
| p.R650C | UCEC | 1 |
| p.M263I | LUSC | 1 |
| p.S134Y | UCEC | 1 |
| p.R264K | SKCM | 1 |
| p.N407H | LUSC | 1 |
| p.A599T | UCEC | 1 |
| p.S374R | UCEC | 1 |
| p.H552D | LUAD | 1 |
| p.I572M | BLCA | 1 |
| p.S131Y | UCEC | 1 |
| p.E174K | SKCM | 1 |
| p.T603K | LUSC | 1 |
| p.A337V | SKCM | 1 |
| p.A233V | SKCM | 1 |
| p.T485M | READ | 1 |
| p.F221V | STAD | 1 |
| p.W323C | LIHC | 1 |
| p.K414T | STAD | 1 |
| p.V35M | HNSC | 1 |
| p.T564I | LGG | 1 |
| p.E517V | SKCM | 1 |
| p.L367F | READ | 1 |
| p.D125N | READ | 1 |
| p.E270K | SKCM | 1 |
| p.A599T | STAD | 1 |
| p.F221V | ESCA | 1 |
| p.G490W | COAD | 1 |
| p.S131Y | COAD | 1 |
| p.R264G | HNSC | 1 |
| p.H392N | PAAD | 1 |
| p.A627T | SKCM | 1 |
| p.E287D | SARC | 1 |
| p.R124C | READ | 1 |
| p.P150S | SKCM | 1 |
| p.R663C | COAD | 1 |
| p.P488S | SKCM | 1 |
| p.G142E | SKCM | 1 |
| p.S453F | SKCM | 1 |
| p.R120W | COAD | 1 |
| p.F532L | LAML | 1 |
| p.R663H | UCEC | 1 |
| p.R264K | LGG | 1 |
| p.W563* | BRCA | 1 |
| p.D125H | BLCA | 1 |
| p.T213M | STAD | 1 |
| p.K251N | UCEC | 1 |
| p.D208_splice | UCEC | 1 |
| p.R663H | STAD | 1 |
| p.M541V | LUAD | 1 |
| p.S271Y | UCEC | 1 |
| p.D116E | GBM | 1 |
| p.K343Q | UCEC | 1 |
| p.I572T | STAD | 1 |
| p.V635M | LGG | 1 |
| p.C339R | CHOL | 1 |
| Top |
| TissGeneCNV for DNAI1 |
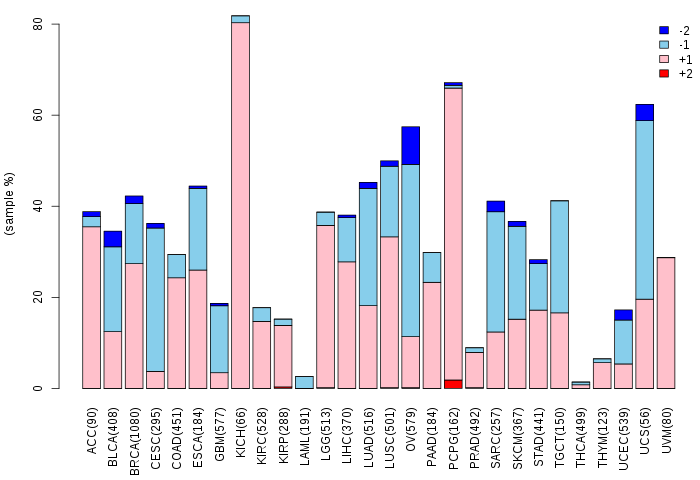
| Copy number variations of TissGene across 28 cancer types (X-axis: cancer type and Y-axis: % of CNV samples) (TCGA Gistic2_CopyNumber_Gistic2_all_data_by_genes, Gistic2 copy number data, version 2016-08-16) |
 |
| Top |
| TissGeneFusions for DNAI1 |
| Fusion genes including TissGene (ChimerDB 3.0, 2016-12-01 and TCGA fusion Portal 2015-12-01) |
| Database | Src | Cancer type | Sample | Fusion gene | ORF | 5'-gene BP | 3'-gene BP |
| Chimerdb3.0 | ChiTaRs | NA | BE143970 | DNAI1-MSH2 | chr9:34485935 | chr2:47624999 |
| Top |
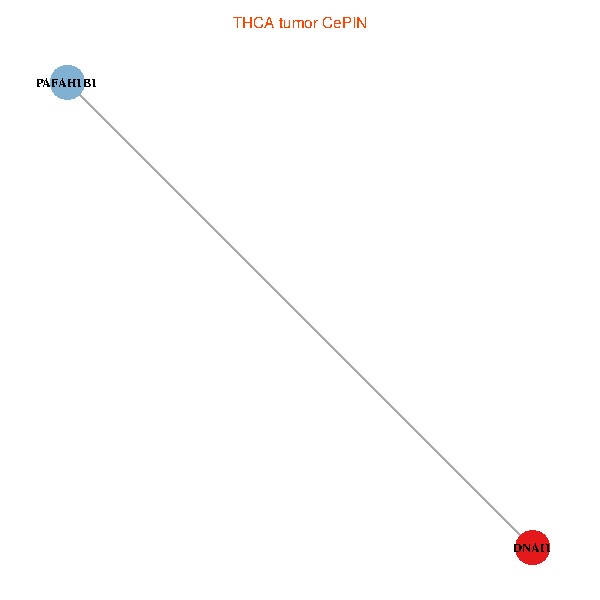
| TissGeneNet for DNAI1 |
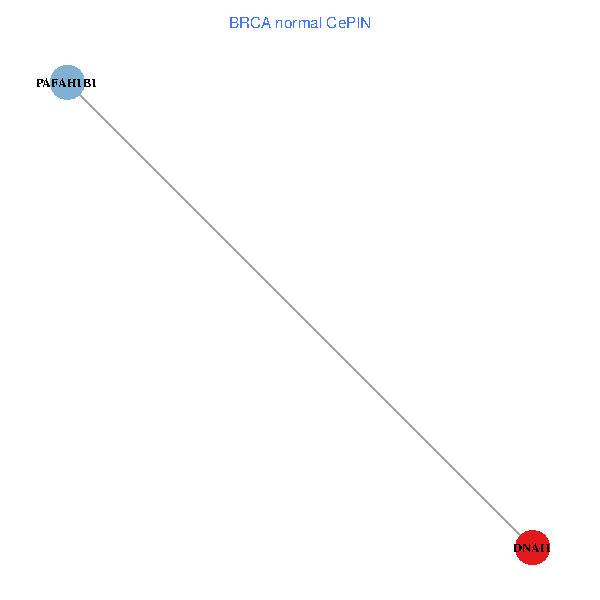
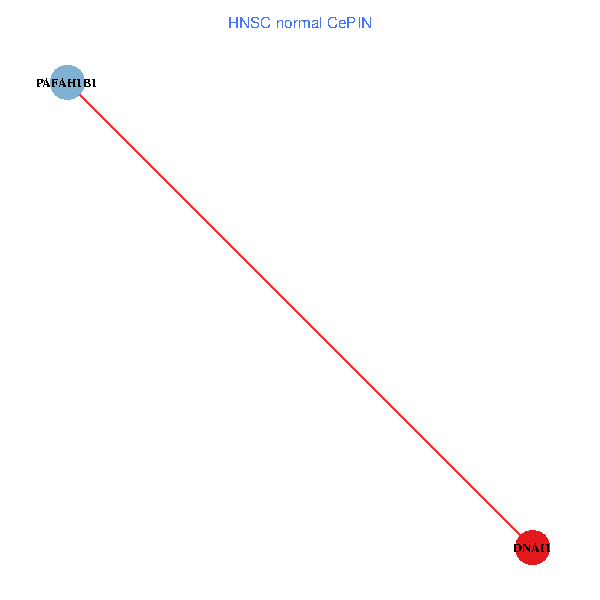
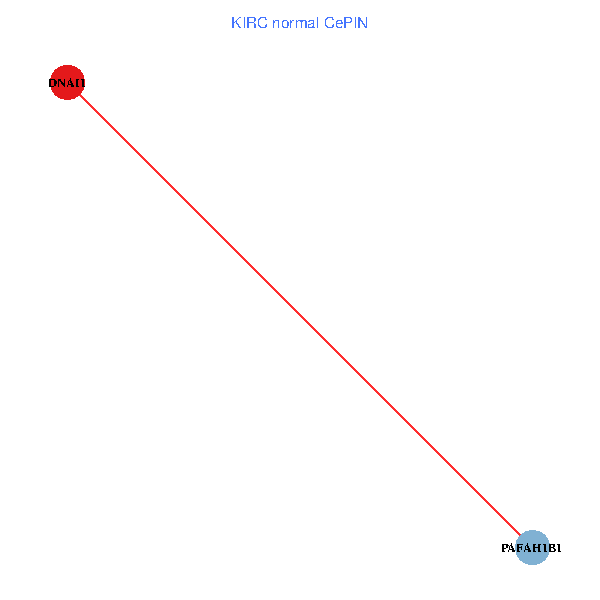
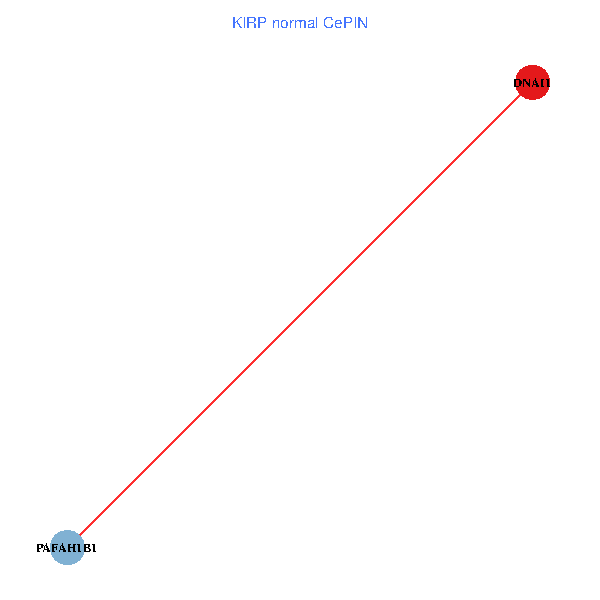
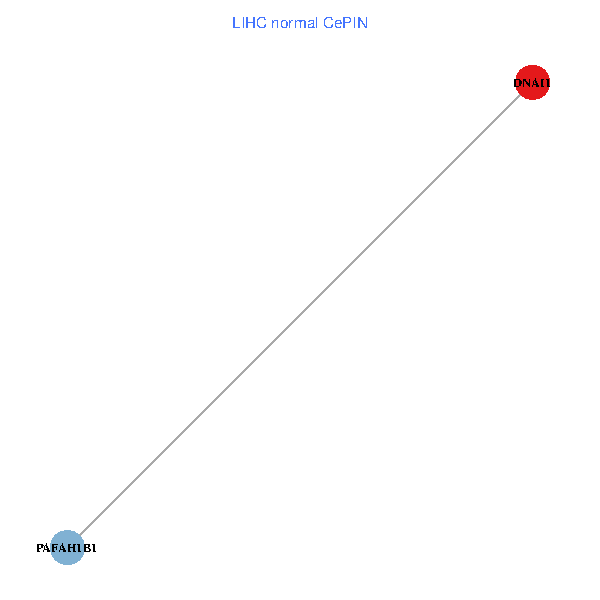
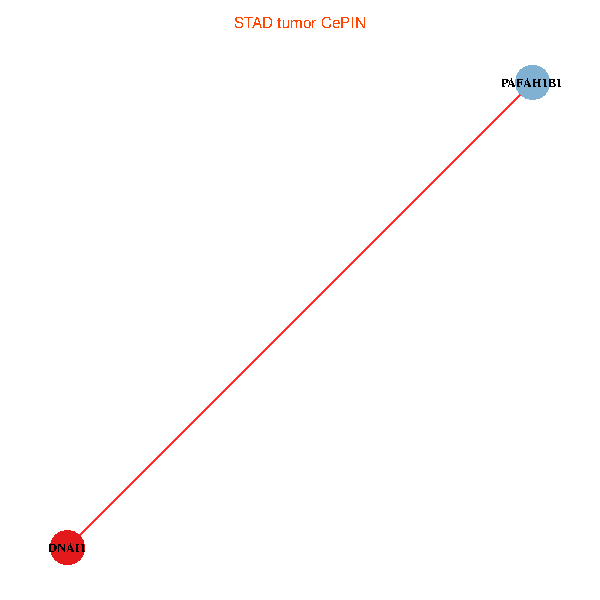
| Co-expressed gene networks based on protein-protein interaction data (CePIN) (TCGA IlluminaHiSeq_RNASeqV2, pan-cancer normalized log2(norm_counts+1) data, version 2016-08-16) (PINA2 ppi data) |
| BRCA (tumor) | BRCA (normal) |
| DNAI1, PAFAH1B1 (tumor) | DNAI1, PAFAH1B1 (normal) |
 |  |
| COAD (tumor) | COAD (normal) |
| DNAI1, PAFAH1B1 (tumor) | DNAI1, PAFAH1B1 (normal) |
 |  |
| HNSC (tumor) | HNSC (normal) |
| DNAI1, PAFAH1B1 (tumor) | DNAI1, PAFAH1B1 (normal) |
 |  |
| KICH (tumor) | KICH (normal) |
| DNAI1, PAFAH1B1 (tumor) | DNAI1, PAFAH1B1 (normal) |
 |  |
| KIRC (tumor) | KIRC (normal) |
| DNAI1, PAFAH1B1 (tumor) | DNAI1, PAFAH1B1 (normal) |
 |  |
| KIRP (tumor) | KIRP (normal) |
| DNAI1, PAFAH1B1 (tumor) | DNAI1, PAFAH1B1 (normal) |
 |  |
| LIHC (tumor) | LIHC (normal) |
| DNAI1, PAFAH1B1 (tumor) | DNAI1, PAFAH1B1 (normal) |
 |  |
| LUAD (tumor) | LUAD (normal) |
| DNAI1, PAFAH1B1 (tumor) | DNAI1, PAFAH1B1 (normal) |
 |  |
| LUSC (tumor) | LUSC (normal) |
| DNAI1, PAFAH1B1 (tumor) | DNAI1, PAFAH1B1 (normal) |
 |  |
| PRAD (tumor) | PRAD (normal) |
| DNAI1, PAFAH1B1 (tumor) | DNAI1, PAFAH1B1 (normal) |
 |  |
| STAD (tumor) | STAD (normal) |
| DNAI1, PAFAH1B1 (tumor) | DNAI1, PAFAH1B1 (normal) |
 |  |
| THCA (tumor) | THCA (normal) |
| DNAI1, PAFAH1B1 (tumor) | DNAI1, PAFAH1B1 (normal) |
 |  |
| Top |
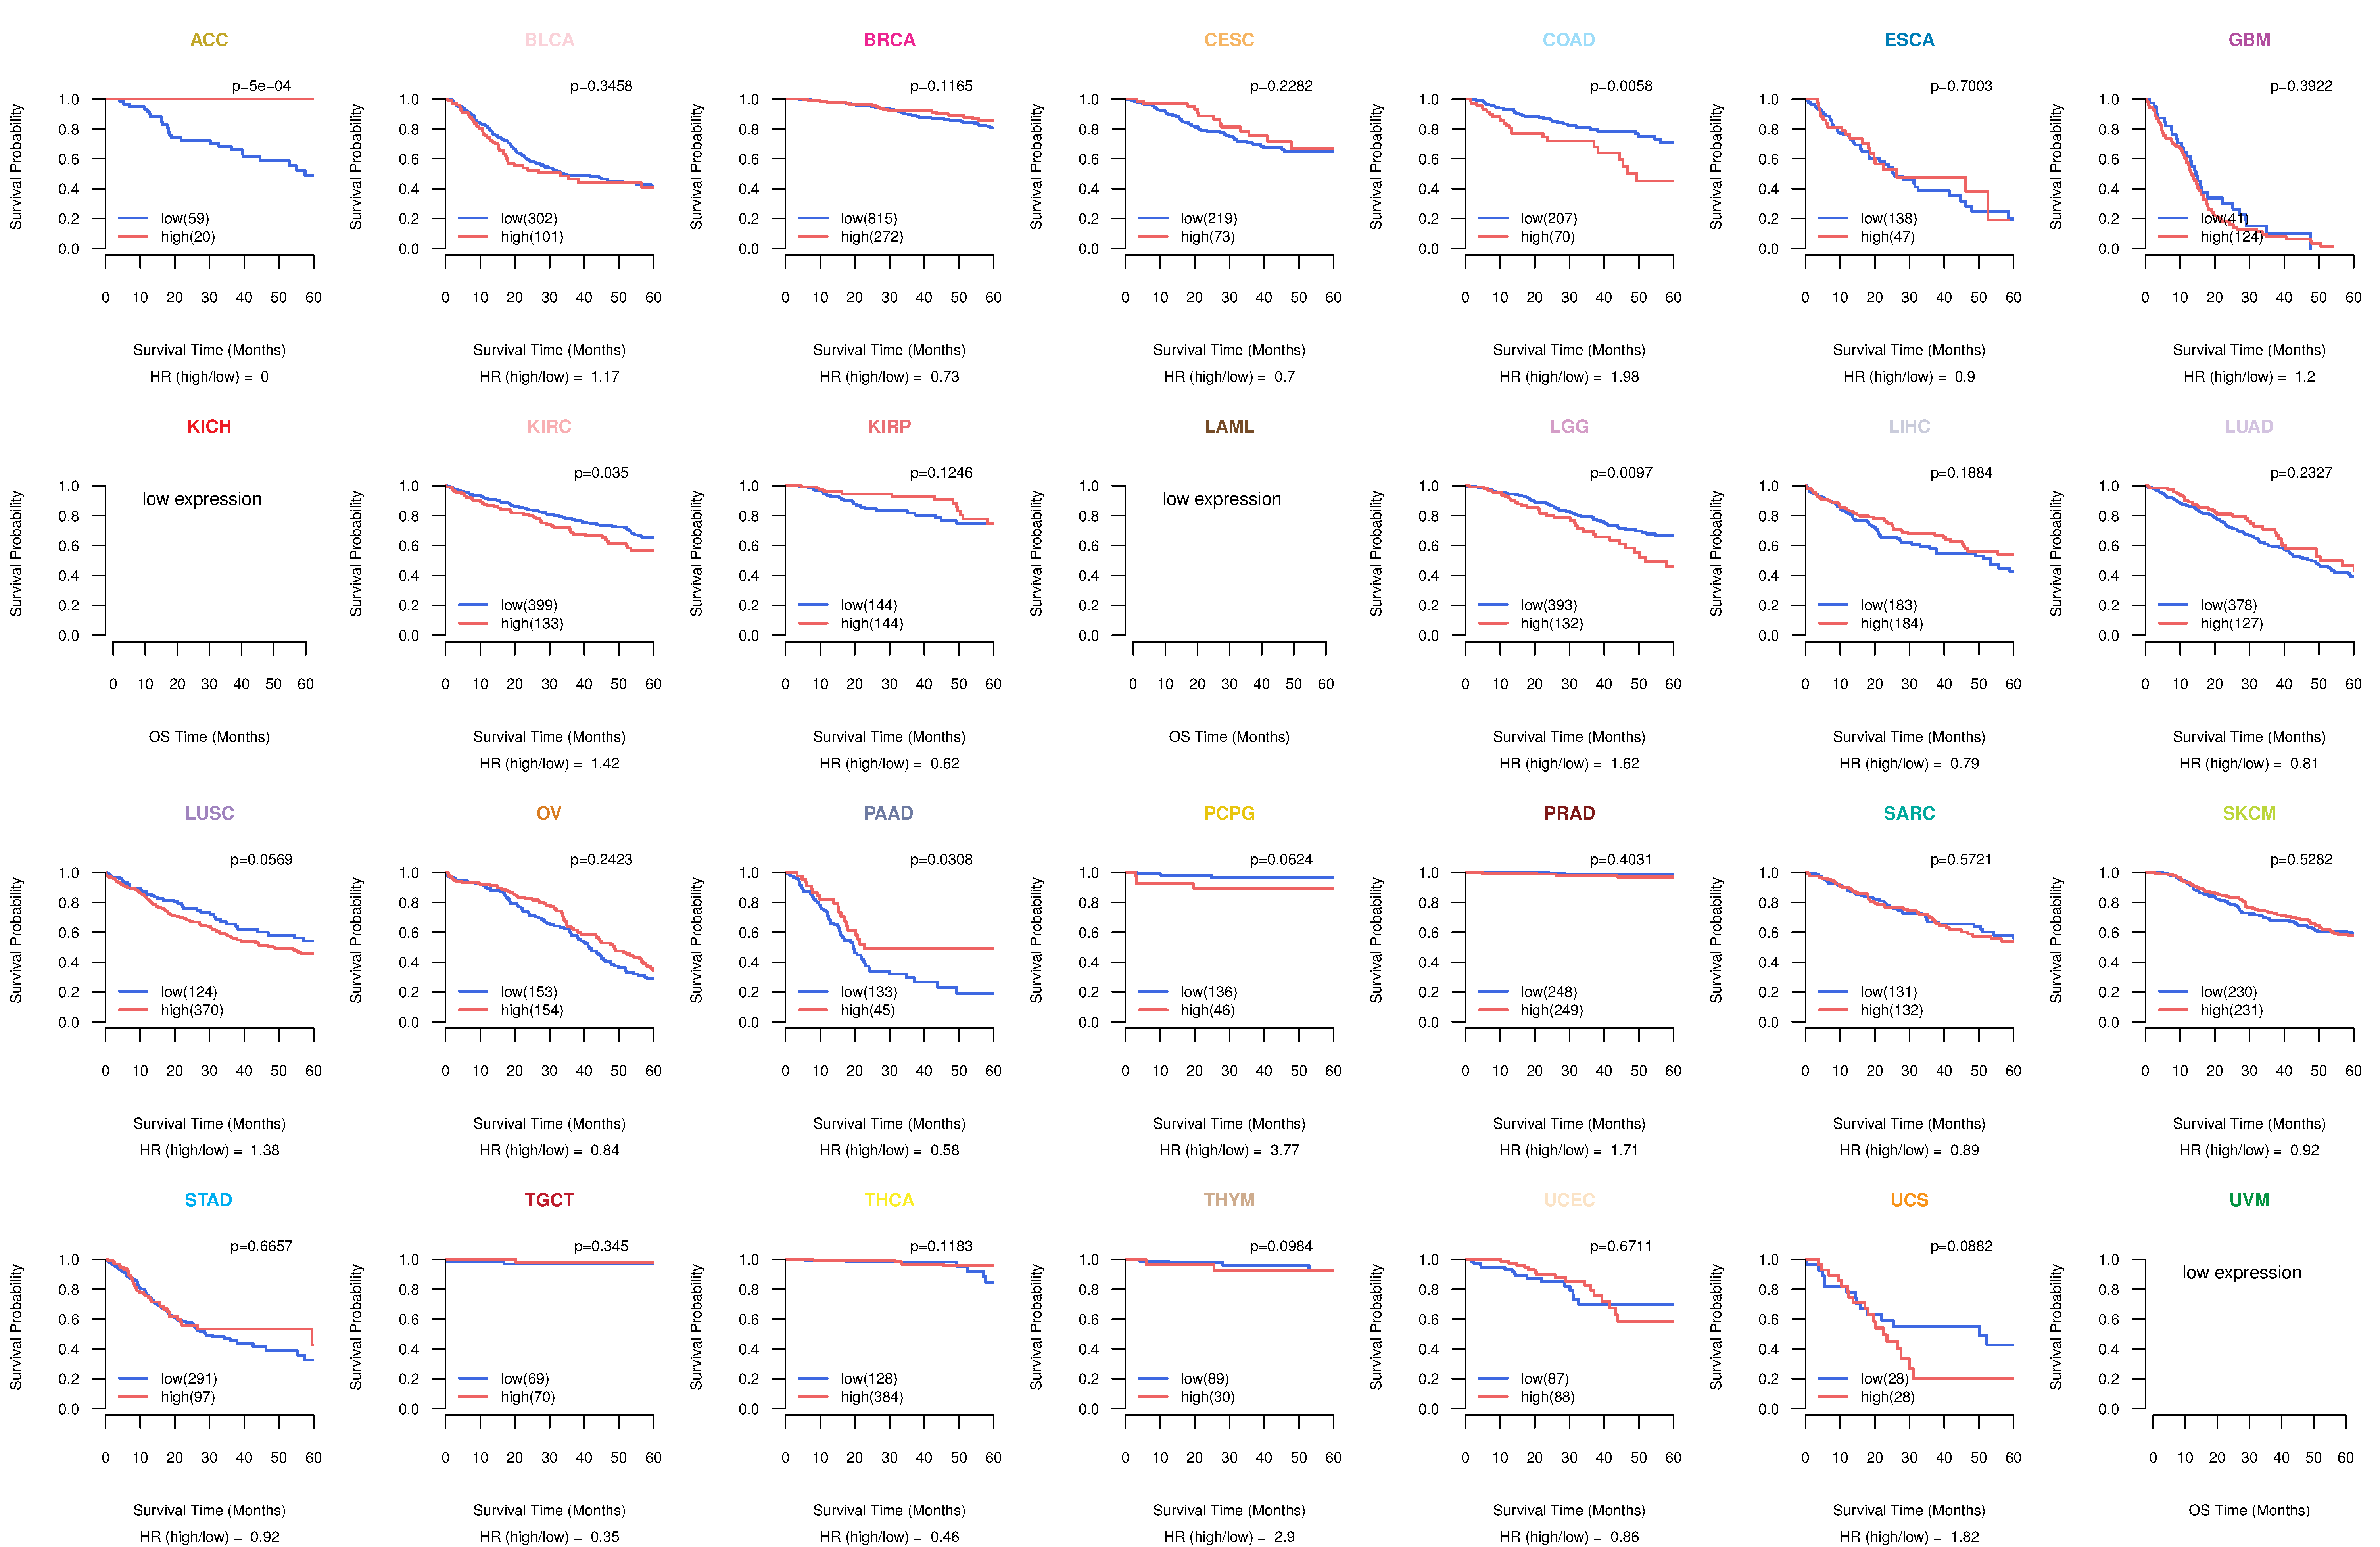
| TissGeneProg for DNAI1 |
| Kaplan-Meier plots with logrank tests of overall survival (OS) using 28 cancer types (TCGA IlluminaHiSeq_RNASeqV2, pan-cancer normalized log2(norm_counts+1) data, version 2016-08-16) (TCGA clinicalMatrix, phenotype data, version 2016-04-27) * Click on the image to enlarge it in a new window. |
 |
| Kaplan-Meier plots with logrank test of relapse free survival (RFS) using 28 cancer types (TCGA IlluminaHiSeq_RNASeqV2, pan-cancer normalized log2(norm_counts+1) data, version 2016-08-16) (TCGA clinicalMatrix, phenotype data, version 2016-04-27) * Click on the image enlarge it in a new window. |
 |
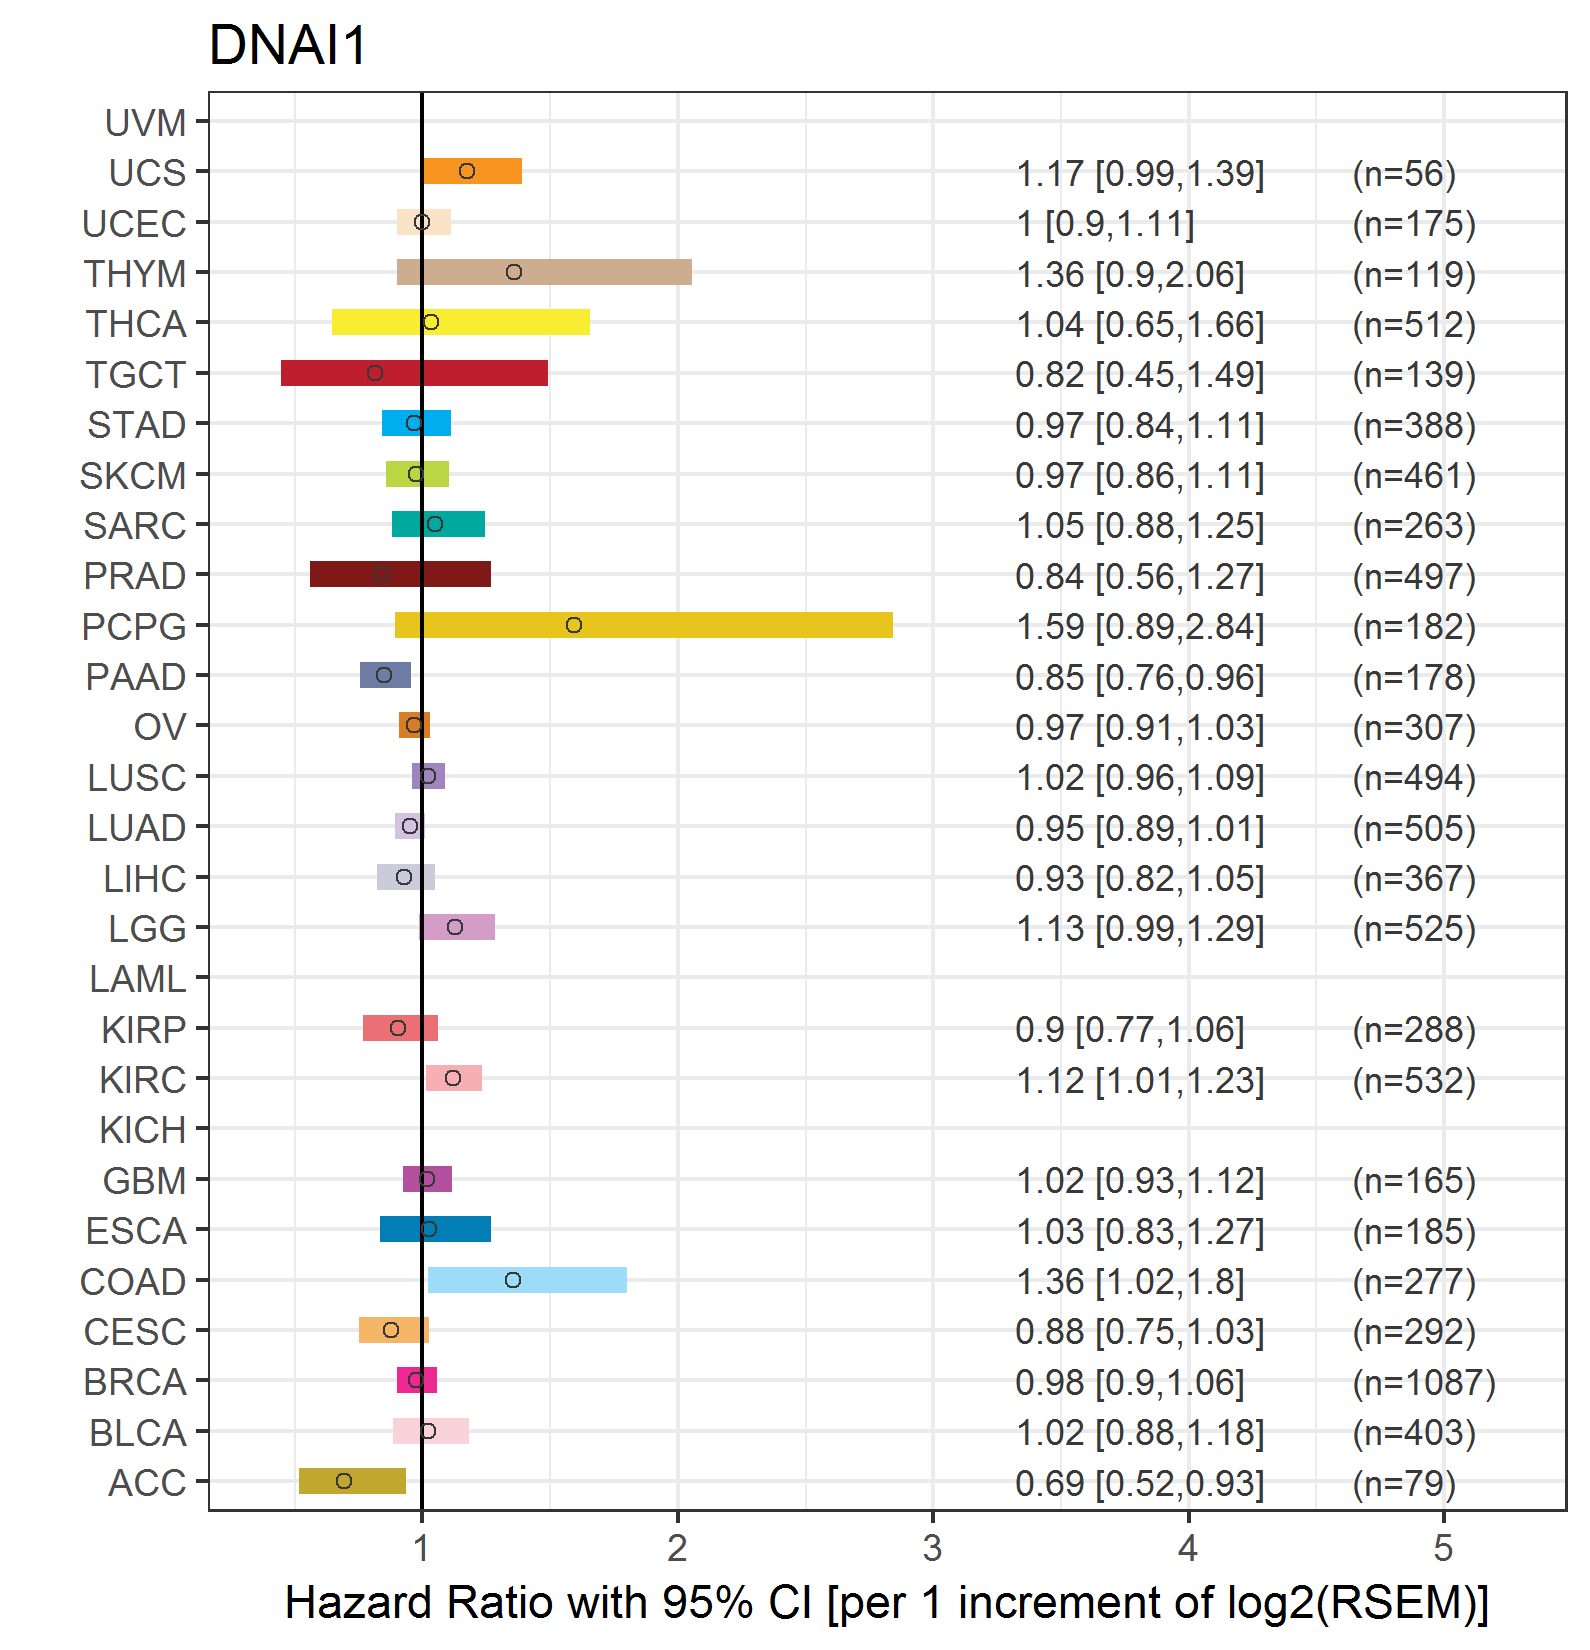
| Forest plot of Cox proportional hazard ratio (HR) and 95% CI of overall survival (OS) using 28 cancer types (TCGA IlluminaHiSeq_RNASeqV2, pan-cancer normalized log2(norm_counts+1) data, version 2016-08-16) (TCGA clinicalMatrix, phenotype data, version 2016-04-27) * Click on the image enlarge it in a new window. |
 |
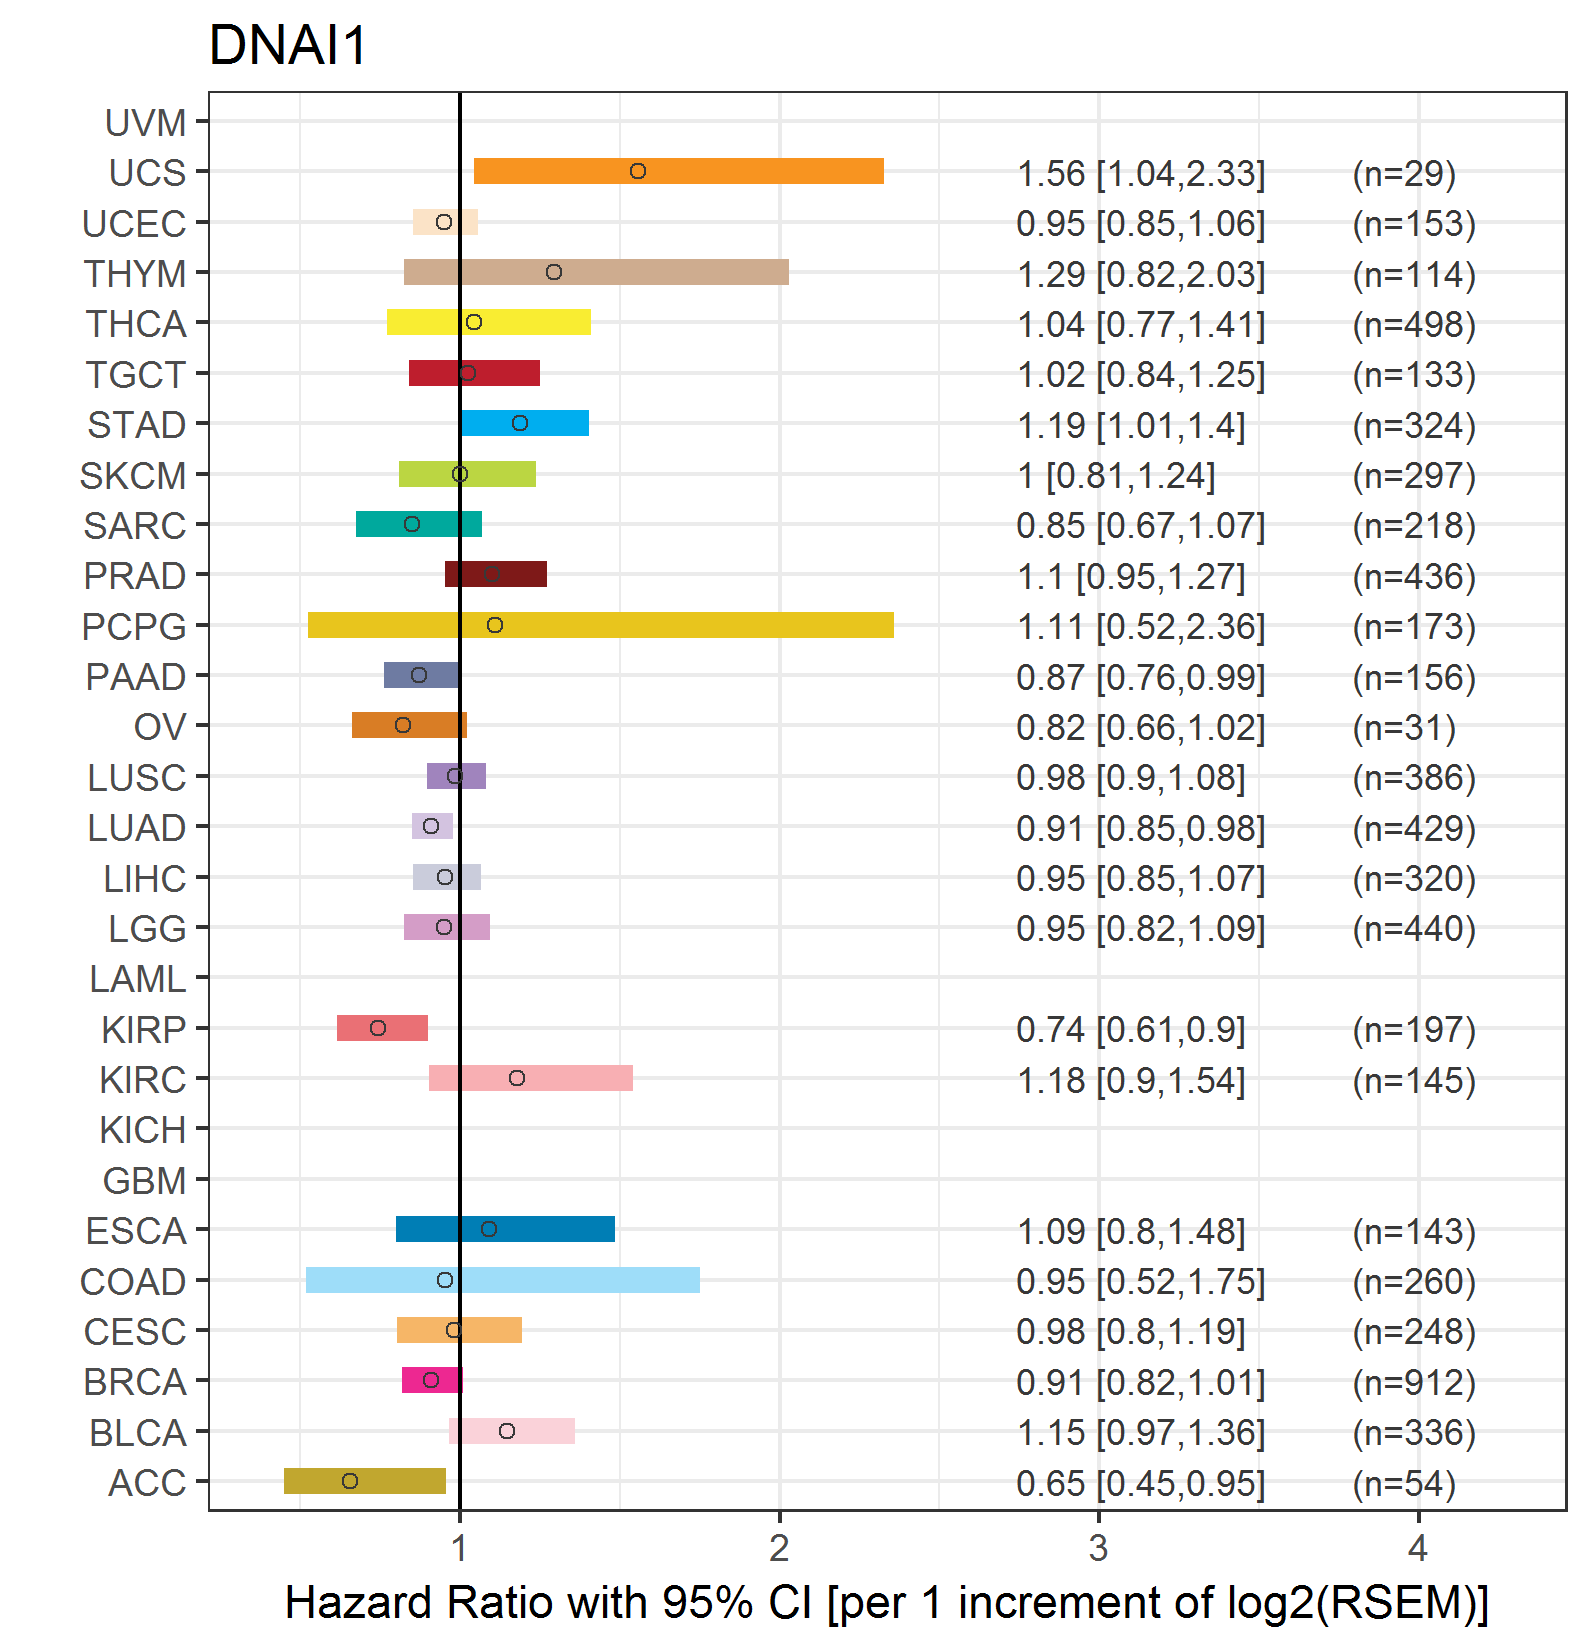
| Forest plot of Cox proportional hazard ratio (HR) and 95% CI of relapse free survival (RFS) using 28 cancer types (TCGA IlluminaHiSeq_RNASeqV2, pan-cancer normalized log2(norm_counts+1) data, version 2016-08-16) (TCGA clinicalMatrix, phenotype data, version 2016-04-27) * Click on the image enlarge it in a new window. |
 |
| Top |
| TissGeneClin for DNAI1 |
| TissGeneDrug for DNAI1 |
| Drug information targeting TissGene (DrugBank Version 5.0.6, 2017-04-01) |
| DrugBank ID | Drug name | Drug activity | Drug type | Drug status |
| Top |
| TissGeneDisease for DNAI1 |
| Disease information associated with TissGene (DisGeNet, 2016-06-01) |
| Disease ID | Disease name | # pubmeds | Source |
| umls:C0022521 | Kartagener Syndrome | 17 | BeFree,CLINVAR,CTD_human,GAD,MGD,UNIPROT |
| umls:C0008780 | Ciliary Motility Disorders | 7 | BeFree,GAD |
| umls:C0033027 | Preleukemia | 2 | BeFree |
| umls:C0041107 | Trisomy | 2 | BeFree |
| umls:C3463824 | MYELODYSPLASTIC SYNDROME | 2 | BeFree |
| umls:C0020255 | Hydrocephalus | 1 | BeFree |
| umls:C0024305 | Lymphoma, Non-Hodgkin | 1 | BeFree |
| umls:C0025322 | Premature Menopause | 1 | BeFree |
| umls:C0026764 | Multiple Myeloma | 1 | BeFree |
| umls:C0037221 | Situs Inversus | 1 | BeFree |
| umls:C0040038 | Thromboembolism | 1 | BeFree |
| umls:C0040336 | Tobacco Use Disorder | 1 | GAD |
| umls:C0079745 | Lymphoma, Large-Cell, Follicular | 1 | BeFree |
| umls:C0085215 | Ovarian Failure, Premature | 1 | BeFree |
| umls:C0235974 | Pancreatic carcinoma | 1 | BeFree |
| umls:C0266999 | Vesicular Stomatitis | 1 | BeFree |
| umls:C0278619 | Extramedullary Plasmacytoma | 1 | BeFree |
| umls:C0346647 | Malignant neoplasm of pancreas | 1 | BeFree |
| umls:C0398625 | Protein C Deficiency | 1 | BeFree |
| umls:C0403823 | Asthenozoospermia | 1 | GAD |
| umls:C0699949 | airway disease | 1 | BeFree |
| umls:C1274290 | Neonatal purpura fulminans (homozygous protein C deficiency) | 1 | BeFree |
| umls:C1328504 | Hormone refractory prostate cancer | 1 | BeFree |
|
Copyright 2016-Present - The University of Texas Health Science Center at Houston (UTHealth) Web File Viewing | How to Report, Fraud, Waste and Abuse | State of Texas | Statewide Search | Texas Homeland Security | Site Policies |