 |
| |
| |
| |
| |
| |
| |
|

| TissGeneSummary for ZBTB32 |
 Gene summary Gene summary |
| Basic gene information | Gene symbol | ZBTB32 |
| Gene name | zinc finger and BTB domain containing 32 | |
| Synonyms | FAXF|FAZF|Rog|TZFP|ZNF538 | |
| Cytomap | UCSC genome browser: 19q13.1 | |
| Type of gene | protein-coding | |
| RefGenes | NM_014383.1, | |
| Description | FANCC-interacting proteinfanconi anemia zinc finger proteinrepressor of GATAtestis zinc finger proteinzinc finger and BTB domain-containing protein 32zinc finger protein 538 | |
| Modification date | 20141207 | |
| dbXrefs | MIM : 605859 | |
| HGNC : HGNC | ||
| Ensembl : ENSG00000011590 | ||
| HPRD : 12055 | ||
| Vega : OTTHUMG00000048118 | ||
| Protein | UniProt: go to UniProt's Cross Reference DB Table | |
| Expression | CleanEX: HS_ZBTB32 | |
| BioGPS: 27033 | ||
| Pathway | NCI Pathway Interaction Database: ZBTB32 | |
| KEGG: ZBTB32 | ||
| REACTOME: ZBTB32 | ||
| Pathway Commons: ZBTB32 | ||
| Context | iHOP: ZBTB32 | |
| ligand binding site mutation search in PubMed: ZBTB32 | ||
| UCL Cancer Institute: ZBTB32 | ||
| Assigned class in TissGDB* | A | |
| Included tissue-specific gene expression resources | HPA,TiGER,GTEx | |
| Specific-tissues in normal samples (assigned by TissGDB using HPA, TiGER, and GTEx) | Testis | |
| Cancer types related to the specific-tissues in cancer samples (assigned by TissGDB using TCGA) | TGCT | |
| Reference showing the relevant tissue of ZBTB32 | Tzfp represses the androgen receptor in mouse testis.PLoS One. 2013 Apr 25;8(4):e62314. (pmid:3634227) go to article | |
| Description by TissGene annotations | ||
| * Class A consists of genes with literature evidence and is part of the cTissGenes. Class B consists of only cTissGenes without additional evidence. The remaining genes belong to Class C. |
| Gene ontology having evidence of Inferred from Direct Assay (IDA) from Entrez |
| GO ID | GO term | PubMed ID |
| Top |
| TissGeneExp for ZBTB32 |
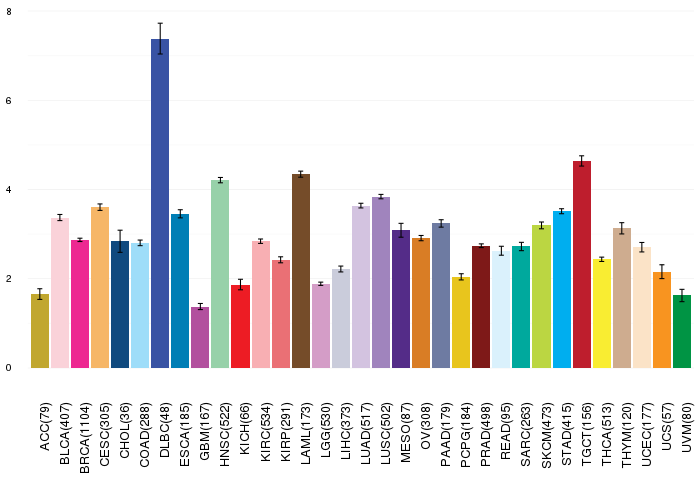
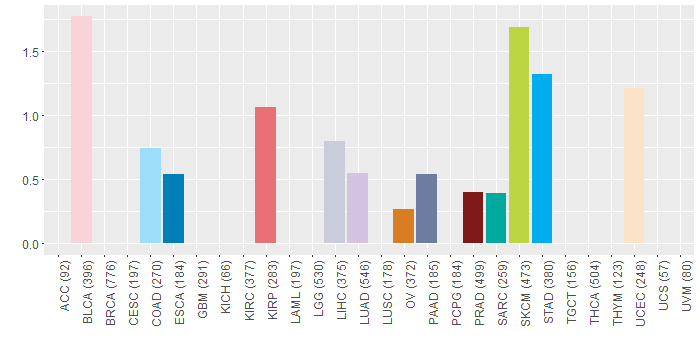
| Gene expressions across 28 cancer types (X-axis: cancer type and Y-axis: log2(norm_counts+1)) (TCGA IlluminaHiSeq_RNASeqV2, pan-cancer normalized log2(norm_counts+1) data, version 2016-08-16) |
 |
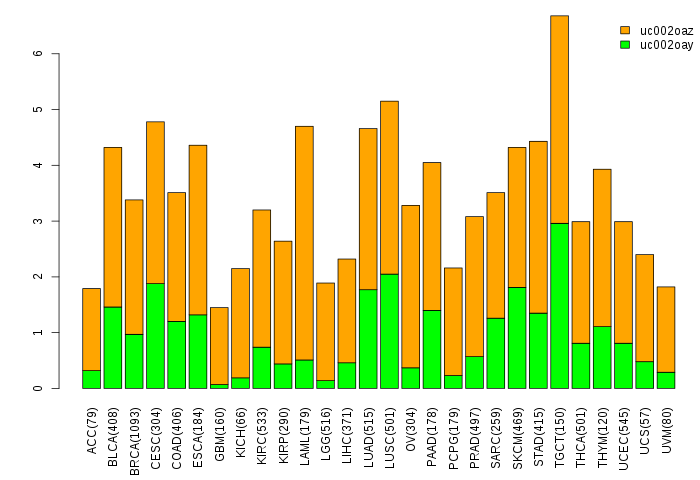
| Gene isoform expressions across 28 cancer types (X-axis: cancer type and Y-axis: log2(norm_counts+1)) (TCGA pan-cancer tcga_rsem_isoform_tpm, version 2016-09-01) |
 |
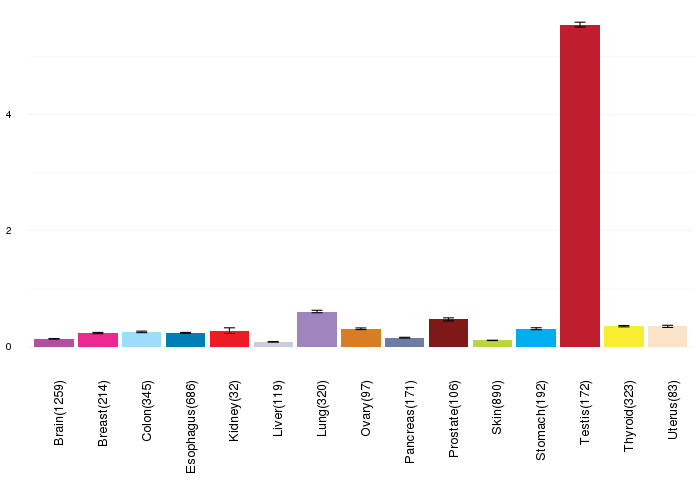
| Gene expressions across normal tissues of GTEx data (GTEx GTEx_Analysis_v6_RNA-seq_RNA-SeQCv1.1.8_gene_rpkm.gct) - Here, we shows the matched tissue types only among our 28 cancer types. |
 |
| Different expressions across 14 cancer types with more than 10 samples between matched tumors and normals (X-axis: cancer type and Y-axis: log2(norm_counts+1)) (TCGA IlluminaHiSeq_RNASeqV2, pan-cancer normalized log2(norm_counts+1) data, version 2016-08-16) |
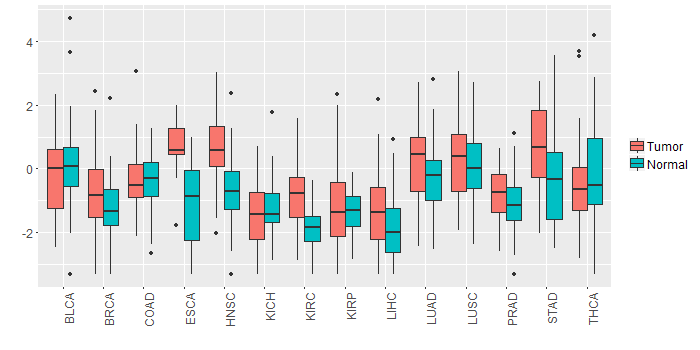 |
| - Significantly differentially expressed cancer types and information. (|Fold change|>1 and FDR<0.05) |
| Cancer type | Mean(exp) in tumor | Mean(exp) in matched normal | Log2FC | P-val. | FDR |
| KIRC | -0.821504841 | -1.857010397 | 1.035505556 | 1.57E-11 | 6.02E-11 |
| HNSC | 0.642443706 | -0.720312108 | 1.362755814 | 4.87E-07 | 4.03E-06 |
| ESCA | 0.630384932 | -1.064242341 | 1.694627273 | 0.00512 | 0.040094648 |
| Top |
| TissGene-miRNA for ZBTB32 |
| Significantly anti-correlated miRNAs of TissGene across 28 cancer types (Gene-miRNA relations from TargetScanHuman Relsease 7.1, Conserved_Site_Context_Scores.txt.zip, 06.01.2016) (TCGA IlluminaHiSeq_miRNASeq, log2(RPM+1) data, version 2016-11-21) (TCGA IlluminaHiSeq_RNASeqV2, log2(normalized_count+1) data, version 2016-08-16) (Spearman’s Rank Correlation (p-value<0.05 and coefficient<-0.25)) |
| Cancer type | miRNA id | miRNA accession | P-val. | Coeff. | # samples |
| Top |
| TissGeneMut for ZBTB32 |
| TissGeneSNV for ZBTB32 |
| nsSNV counts per each loci. Different colors of circles represent different cancer types. Circle size denotes number of samples. (TCGA somatic mutation (SNPs and small INDELs) data, version 2016-04-25) * Click on the image to enlarge it in a new window. |
 |
 |
| Somatic nucleotide variants of TissGene across 28 cancer types (X-axis: cancer type and Y-axis: % of mutated samples) The numbers in parentheses are numbers of samples with mutation (nsSNVs). (TCGA somatic mutation (SNPs and small INDELs) data, version 2016-04-25) |
 |
| - nsSNVs sorted by frequency. |
| AAchange | Cancer type | # samples |
| p.G284E | BLCA | 1 |
| p.H43D | LUAD | 1 |
| p.D206N | SKCM | 1 |
| p.R113X | COAD | 1 |
| p.R25W | STAD | 1 |
| p.S248X | STAD | 1 |
| p.P427S | BLCA | 1 |
| p.T346A | STAD | 1 |
| p.L420M | LUAD | 1 |
| p.R195C | COAD | 1 |
| p.E129K | KIRP | 1 |
| p.G434W | BLCA | 1 |
| p.E132D | UCEC | 1 |
| p.D121N | HNSC | 1 |
| p.R16W | SKCM | 1 |
| p.E147* | PAAD | 1 |
| p.R136K | SKCM | 1 |
| p.S313F | UCEC | 1 |
| p.E147X | PAAD | 1 |
| p.P260H | PRAD | 1 |
| p.A42T | LUAD | 1 |
| p.P479T | LIHC | 1 |
| p.Q387L | LIHC | 1 |
| p.R136M | READ | 1 |
| p.G273S | STAD | 1 |
| p.S442F | SKCM | 1 |
| p.E139K | BLCA | 1 |
| p.A117T | UCEC | 1 |
| p.G13D | SKCM | 1 |
| p.A117V | KIRP | 1 |
| p.S104F | SKCM | 1 |
| p.S222F | KIRP | 1 |
| p.R371L | ESCA | 1 |
| p.P260T | LIHC | 1 |
| p.P438T | OV | 1 |
| p.K125T | BLCA | 1 |
| p.S483F | BLCA | 1 |
| p.G146R | SKCM | 1 |
| p.A252S | SARC | 1 |
| p.T422A | STAD | 1 |
| p.S476L | HNSC | 1 |
| p.C480G | SKCM | 1 |
| p.Y428* | PRAD | 1 |
| p.Q408L | BLCA | 1 |
| Top |
| TissGeneCNV for ZBTB32 |
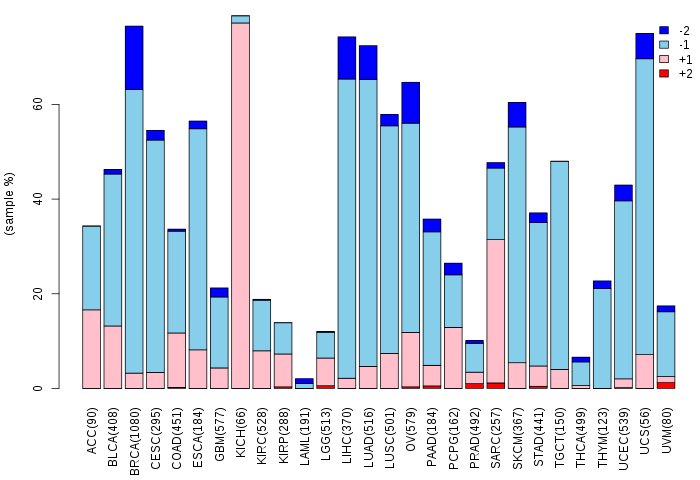
| Copy number variations of TissGene across 28 cancer types (X-axis: cancer type and Y-axis: % of CNV samples) (TCGA Gistic2_CopyNumber_Gistic2_all_data_by_genes, Gistic2 copy number data, version 2016-08-16) |
 |
| Top |
| TissGeneFusions for ZBTB32 |
| Fusion genes including TissGene (ChimerDB 3.0, 2016-12-01 and TCGA fusion Portal 2015-12-01) |
| Database | Src | Cancer type | Sample | Fusion gene | ORF | 5'-gene BP | 3'-gene BP |
| Top |
| TissGeneNet for ZBTB32 |
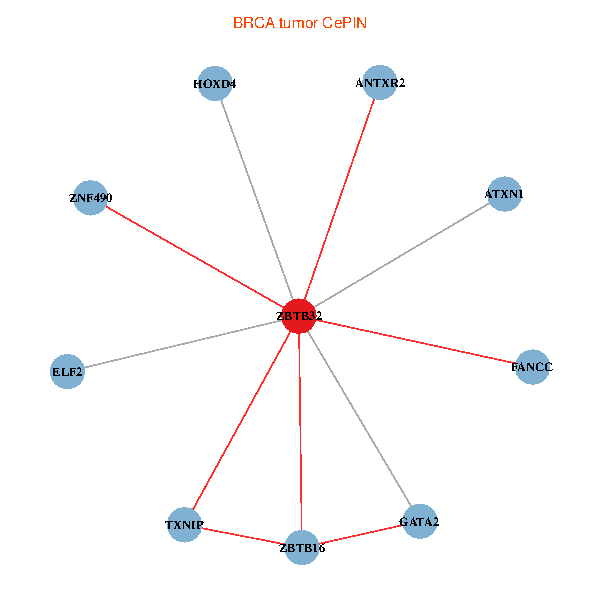
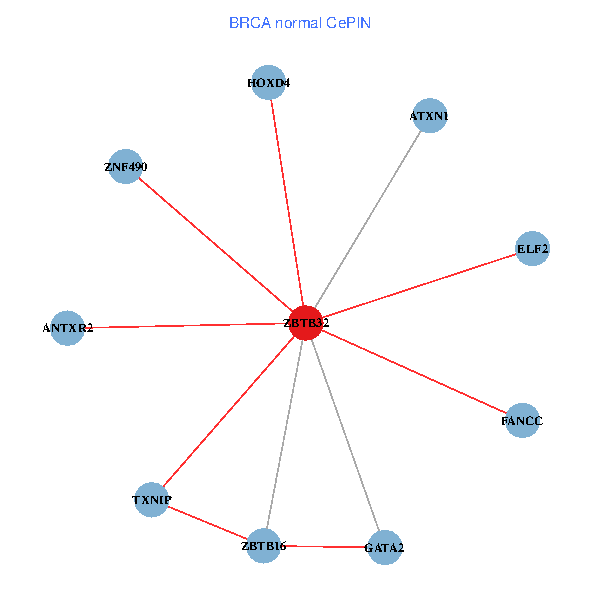
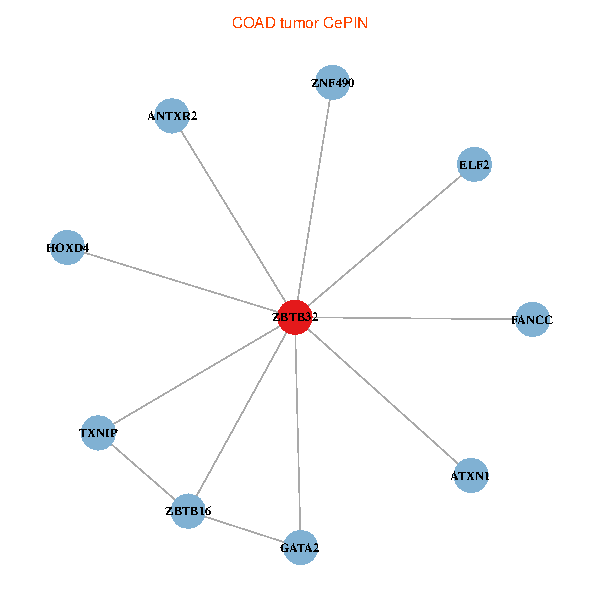
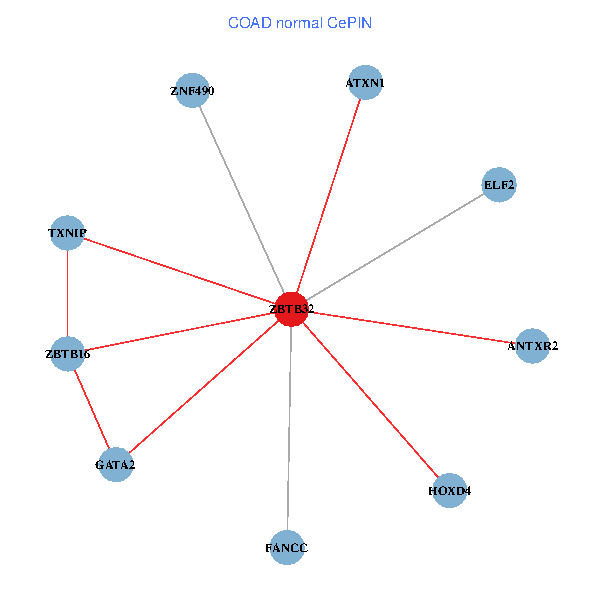
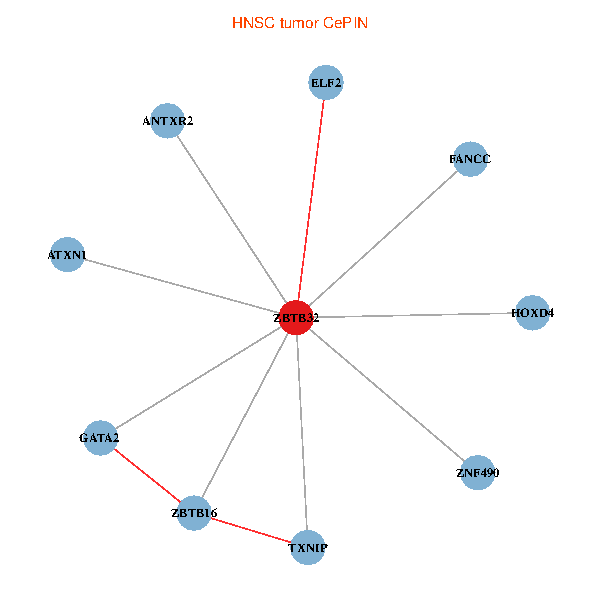
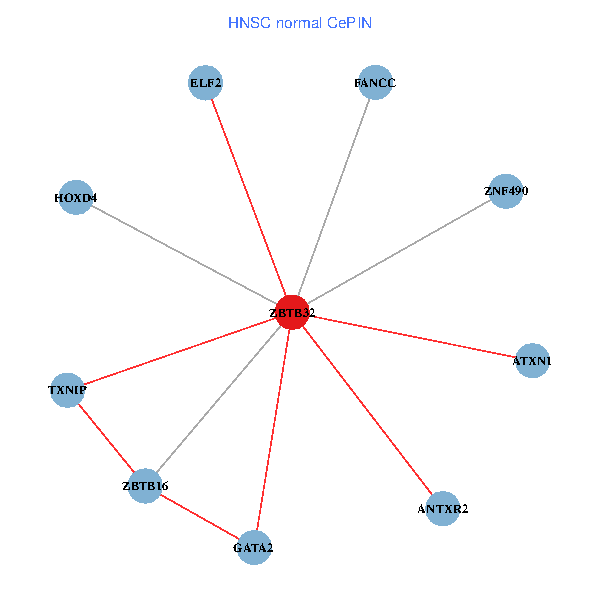
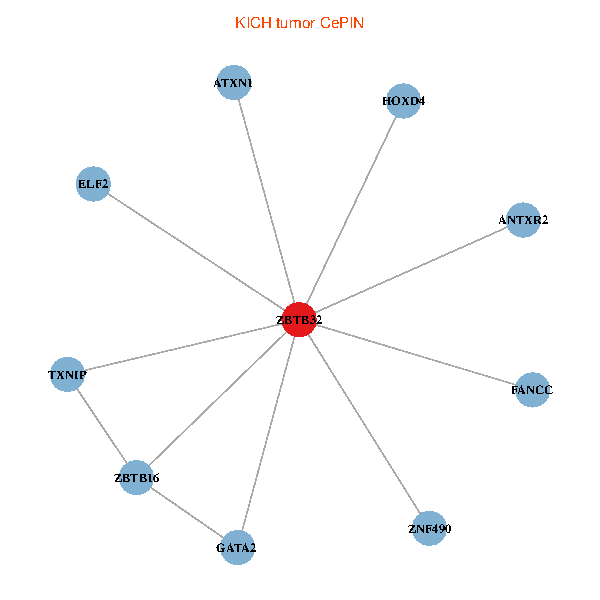
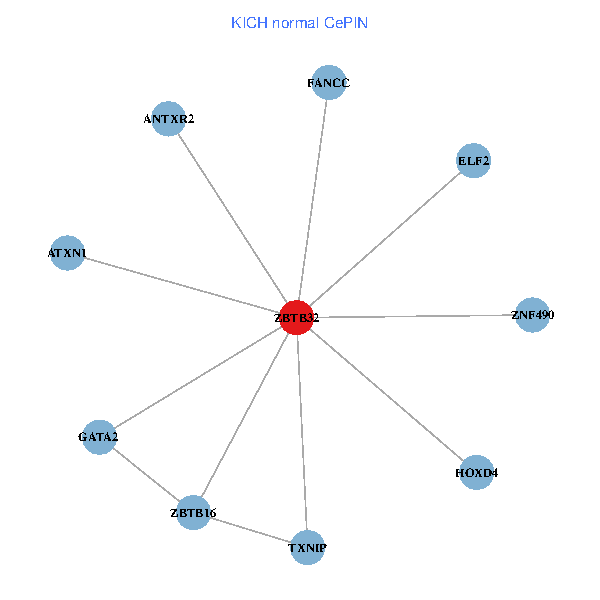
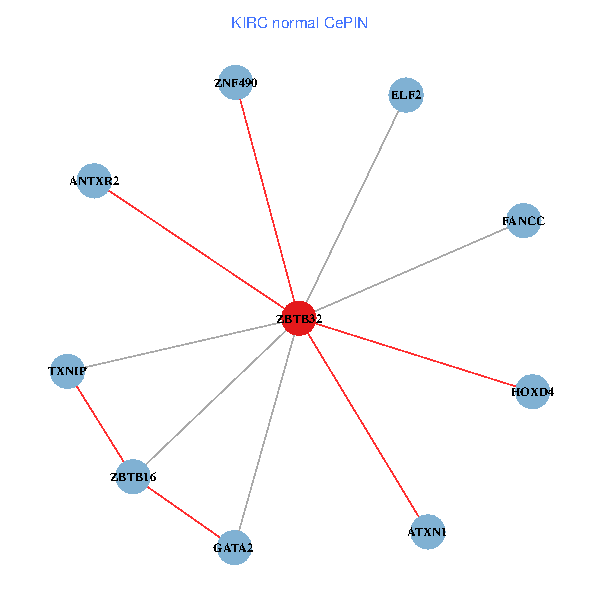
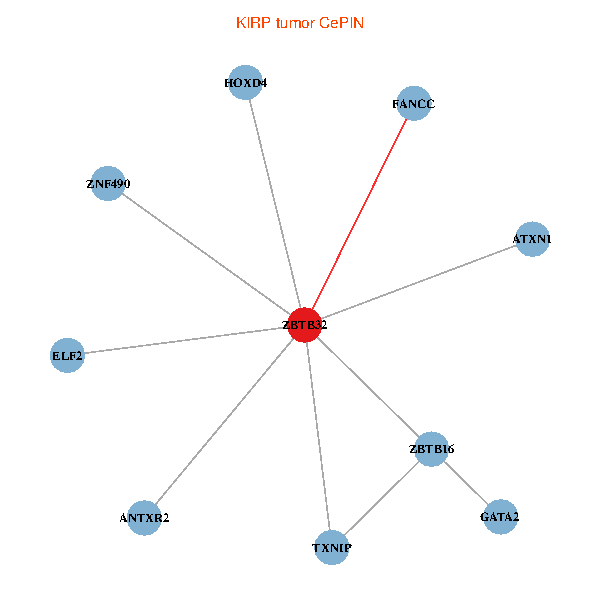
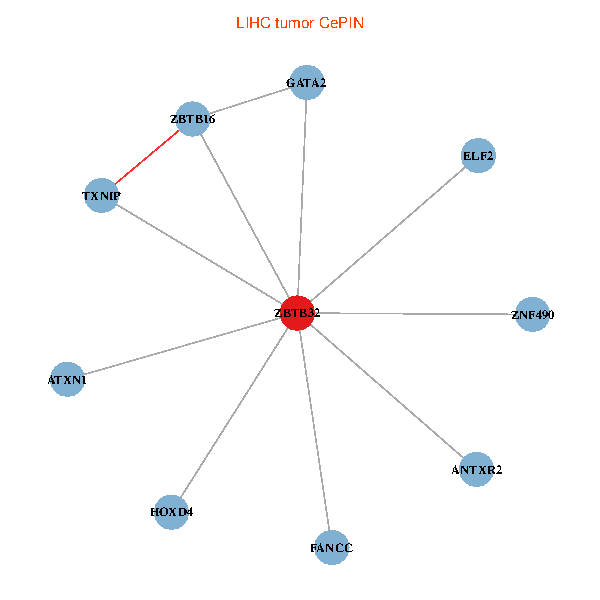
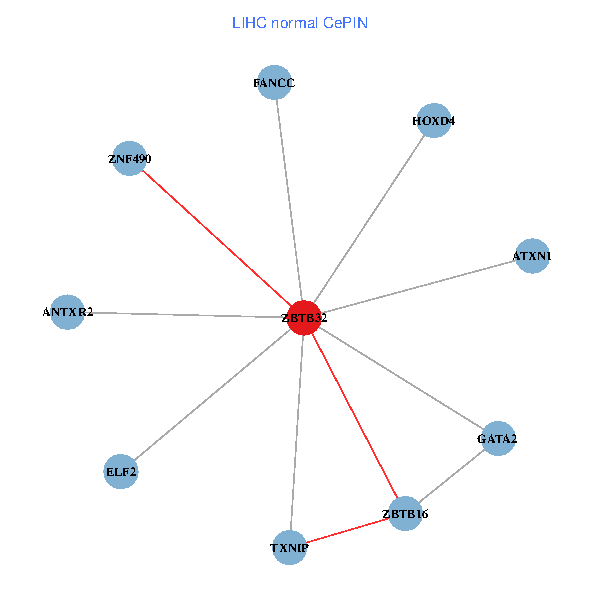
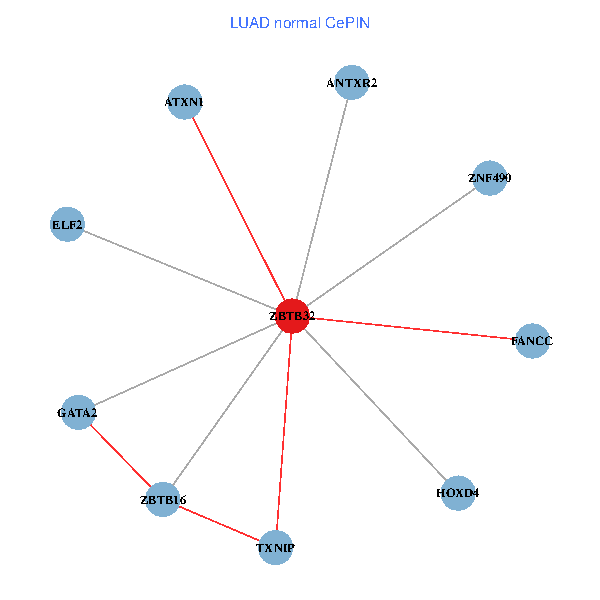
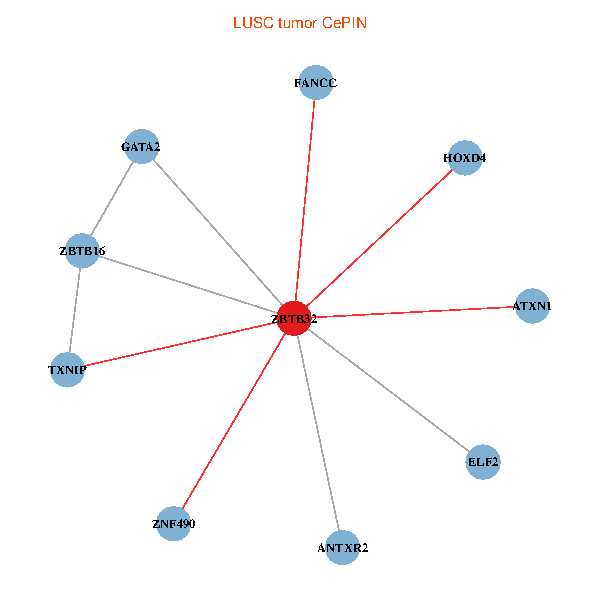
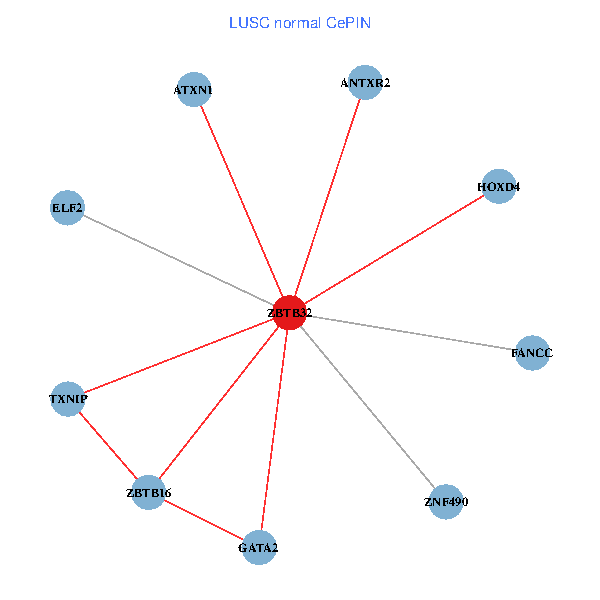
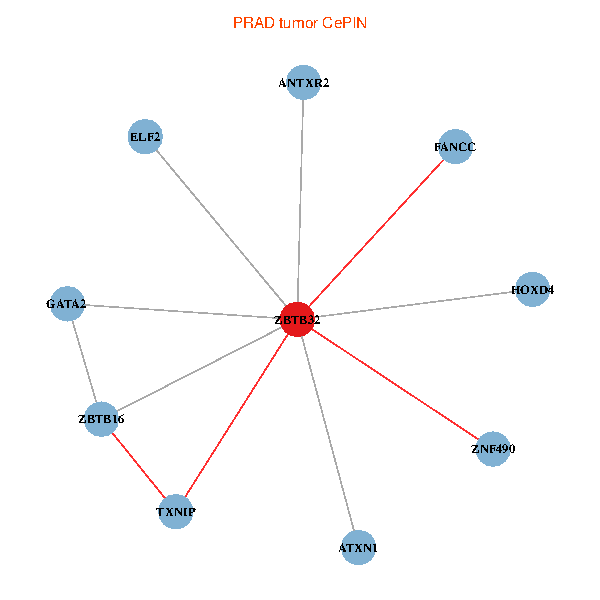
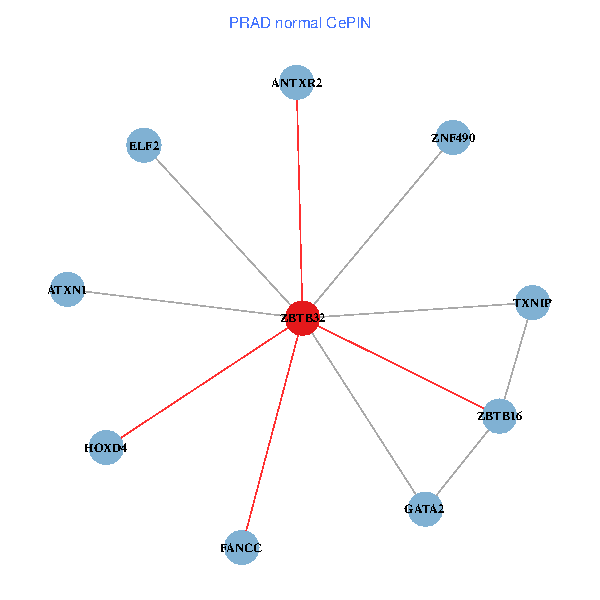
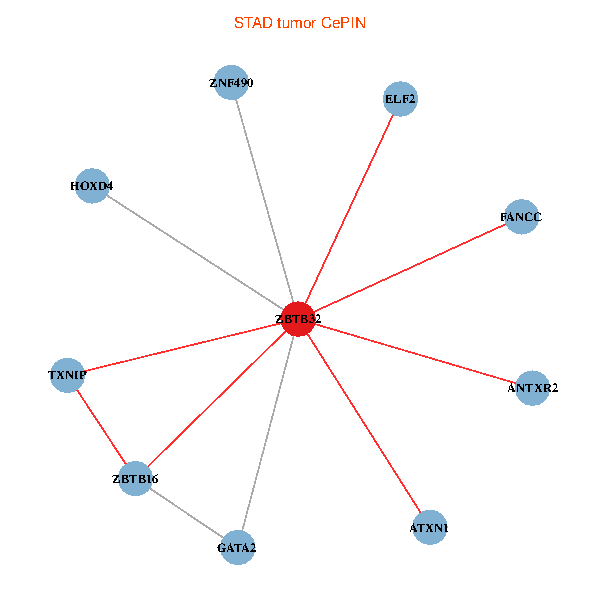
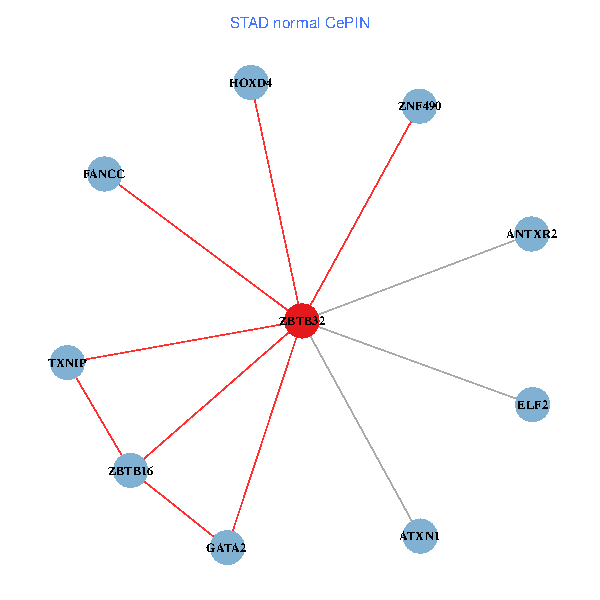
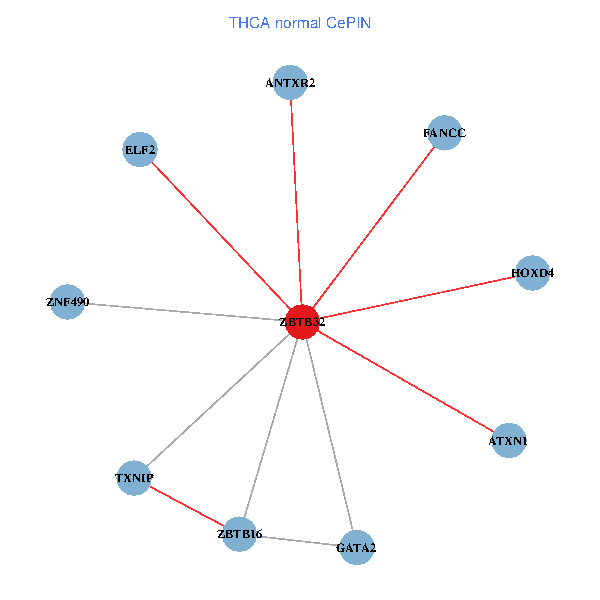
| Co-expressed gene networks based on protein-protein interaction data (CePIN) (TCGA IlluminaHiSeq_RNASeqV2, pan-cancer normalized log2(norm_counts+1) data, version 2016-08-16) (PINA2 ppi data) |
| BRCA (tumor) | BRCA (normal) |
| ZBTB32, GATA2, ZBTB16, ATXN1, HOXD4, FANCC, ANTXR2, ELF2, TXNIP, ZNF490 (tumor) | ZBTB32, GATA2, ZBTB16, ATXN1, HOXD4, FANCC, ANTXR2, ELF2, TXNIP, ZNF490 (normal) |
 |  |
| COAD (tumor) | COAD (normal) |
| ZBTB32, GATA2, ZBTB16, ATXN1, HOXD4, FANCC, ANTXR2, ELF2, TXNIP, ZNF490 (tumor) | ZBTB32, GATA2, ZBTB16, ATXN1, HOXD4, FANCC, ANTXR2, ELF2, TXNIP, ZNF490 (normal) |
 |  |
| HNSC (tumor) | HNSC (normal) |
| ZBTB32, GATA2, ZBTB16, ATXN1, HOXD4, FANCC, ANTXR2, ELF2, TXNIP, ZNF490 (tumor) | ZBTB32, GATA2, ZBTB16, ATXN1, HOXD4, FANCC, ANTXR2, ELF2, TXNIP, ZNF490 (normal) |
 |  |
| KICH (tumor) | KICH (normal) |
| ZBTB32, GATA2, ZBTB16, ATXN1, HOXD4, FANCC, ANTXR2, ELF2, TXNIP, ZNF490 (tumor) | ZBTB32, GATA2, ZBTB16, ATXN1, HOXD4, FANCC, ANTXR2, ELF2, TXNIP, ZNF490 (normal) |
 |  |
| KIRC (tumor) | KIRC (normal) |
| ZBTB32, GATA2, ZBTB16, ATXN1, HOXD4, FANCC, ANTXR2, ELF2, TXNIP, ZNF490 (tumor) | ZBTB32, GATA2, ZBTB16, ATXN1, HOXD4, FANCC, ANTXR2, ELF2, TXNIP, ZNF490 (normal) |
 |  |
| KIRP (tumor) | KIRP (normal) |
| ZBTB32, GATA2, ZBTB16, ATXN1, HOXD4, FANCC, ANTXR2, ELF2, TXNIP, ZNF490 (tumor) | ZBTB32, GATA2, ZBTB16, ATXN1, HOXD4, FANCC, ANTXR2, ELF2, TXNIP, ZNF490 (normal) |
 |  |
| LIHC (tumor) | LIHC (normal) |
| ZBTB32, GATA2, ZBTB16, ATXN1, HOXD4, FANCC, ANTXR2, ELF2, TXNIP, ZNF490 (tumor) | ZBTB32, GATA2, ZBTB16, ATXN1, HOXD4, FANCC, ANTXR2, ELF2, TXNIP, ZNF490 (normal) |
 |  |
| LUAD (tumor) | LUAD (normal) |
| ZBTB32, GATA2, ZBTB16, ATXN1, HOXD4, FANCC, ANTXR2, ELF2, TXNIP, ZNF490 (tumor) | ZBTB32, GATA2, ZBTB16, ATXN1, HOXD4, FANCC, ANTXR2, ELF2, TXNIP, ZNF490 (normal) |
 |  |
| LUSC (tumor) | LUSC (normal) |
| ZBTB32, GATA2, ZBTB16, ATXN1, HOXD4, FANCC, ANTXR2, ELF2, TXNIP, ZNF490 (tumor) | ZBTB32, GATA2, ZBTB16, ATXN1, HOXD4, FANCC, ANTXR2, ELF2, TXNIP, ZNF490 (normal) |
 |  |
| PRAD (tumor) | PRAD (normal) |
| ZBTB32, GATA2, ZBTB16, ATXN1, HOXD4, FANCC, ANTXR2, ELF2, TXNIP, ZNF490 (tumor) | ZBTB32, GATA2, ZBTB16, ATXN1, HOXD4, FANCC, ANTXR2, ELF2, TXNIP, ZNF490 (normal) |
 |  |
| STAD (tumor) | STAD (normal) |
| ZBTB32, GATA2, ZBTB16, ATXN1, HOXD4, FANCC, ANTXR2, ELF2, TXNIP, ZNF490 (tumor) | ZBTB32, GATA2, ZBTB16, ATXN1, HOXD4, FANCC, ANTXR2, ELF2, TXNIP, ZNF490 (normal) |
 |  |
| THCA (tumor) | THCA (normal) |
| ZBTB32, GATA2, ZBTB16, ATXN1, HOXD4, FANCC, ANTXR2, ELF2, TXNIP, ZNF490 (tumor) | ZBTB32, GATA2, ZBTB16, ATXN1, HOXD4, FANCC, ANTXR2, ELF2, TXNIP, ZNF490 (normal) |
 |  |
| Top |
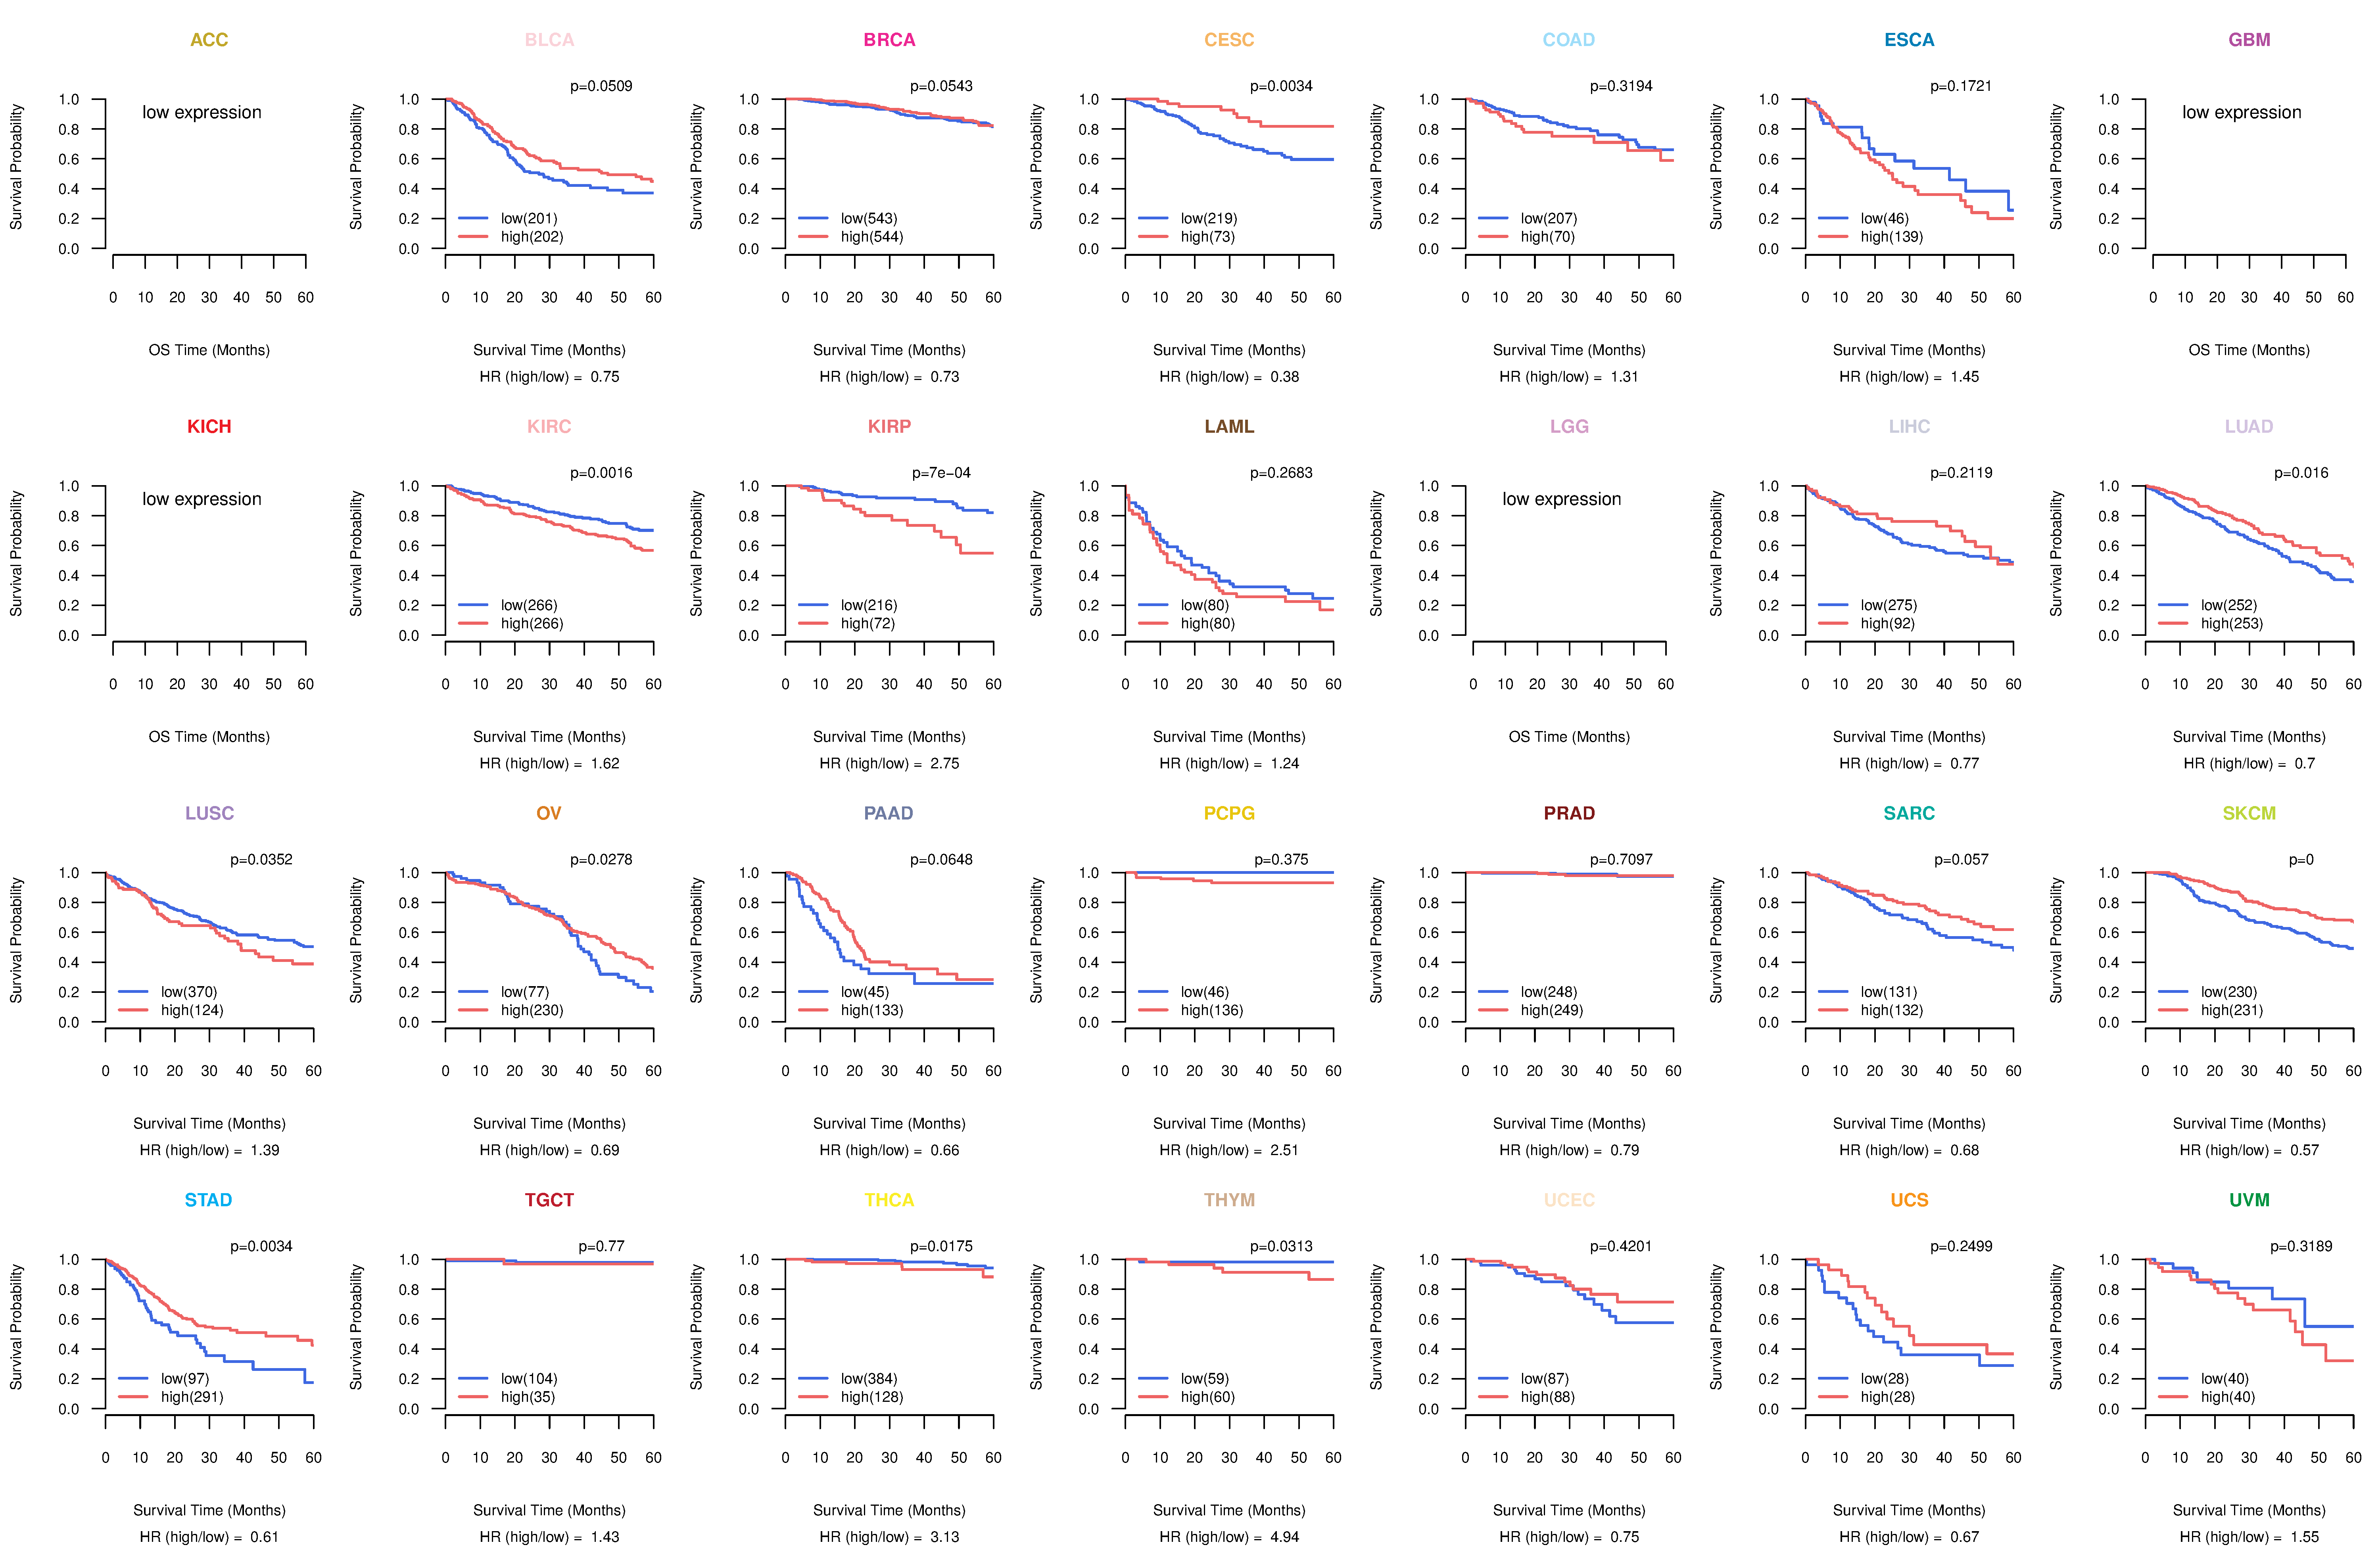
| TissGeneProg for ZBTB32 |
| Kaplan-Meier plots with logrank tests of overall survival (OS) using 28 cancer types (TCGA IlluminaHiSeq_RNASeqV2, pan-cancer normalized log2(norm_counts+1) data, version 2016-08-16) (TCGA clinicalMatrix, phenotype data, version 2016-04-27) * Click on the image to enlarge it in a new window. |
 |
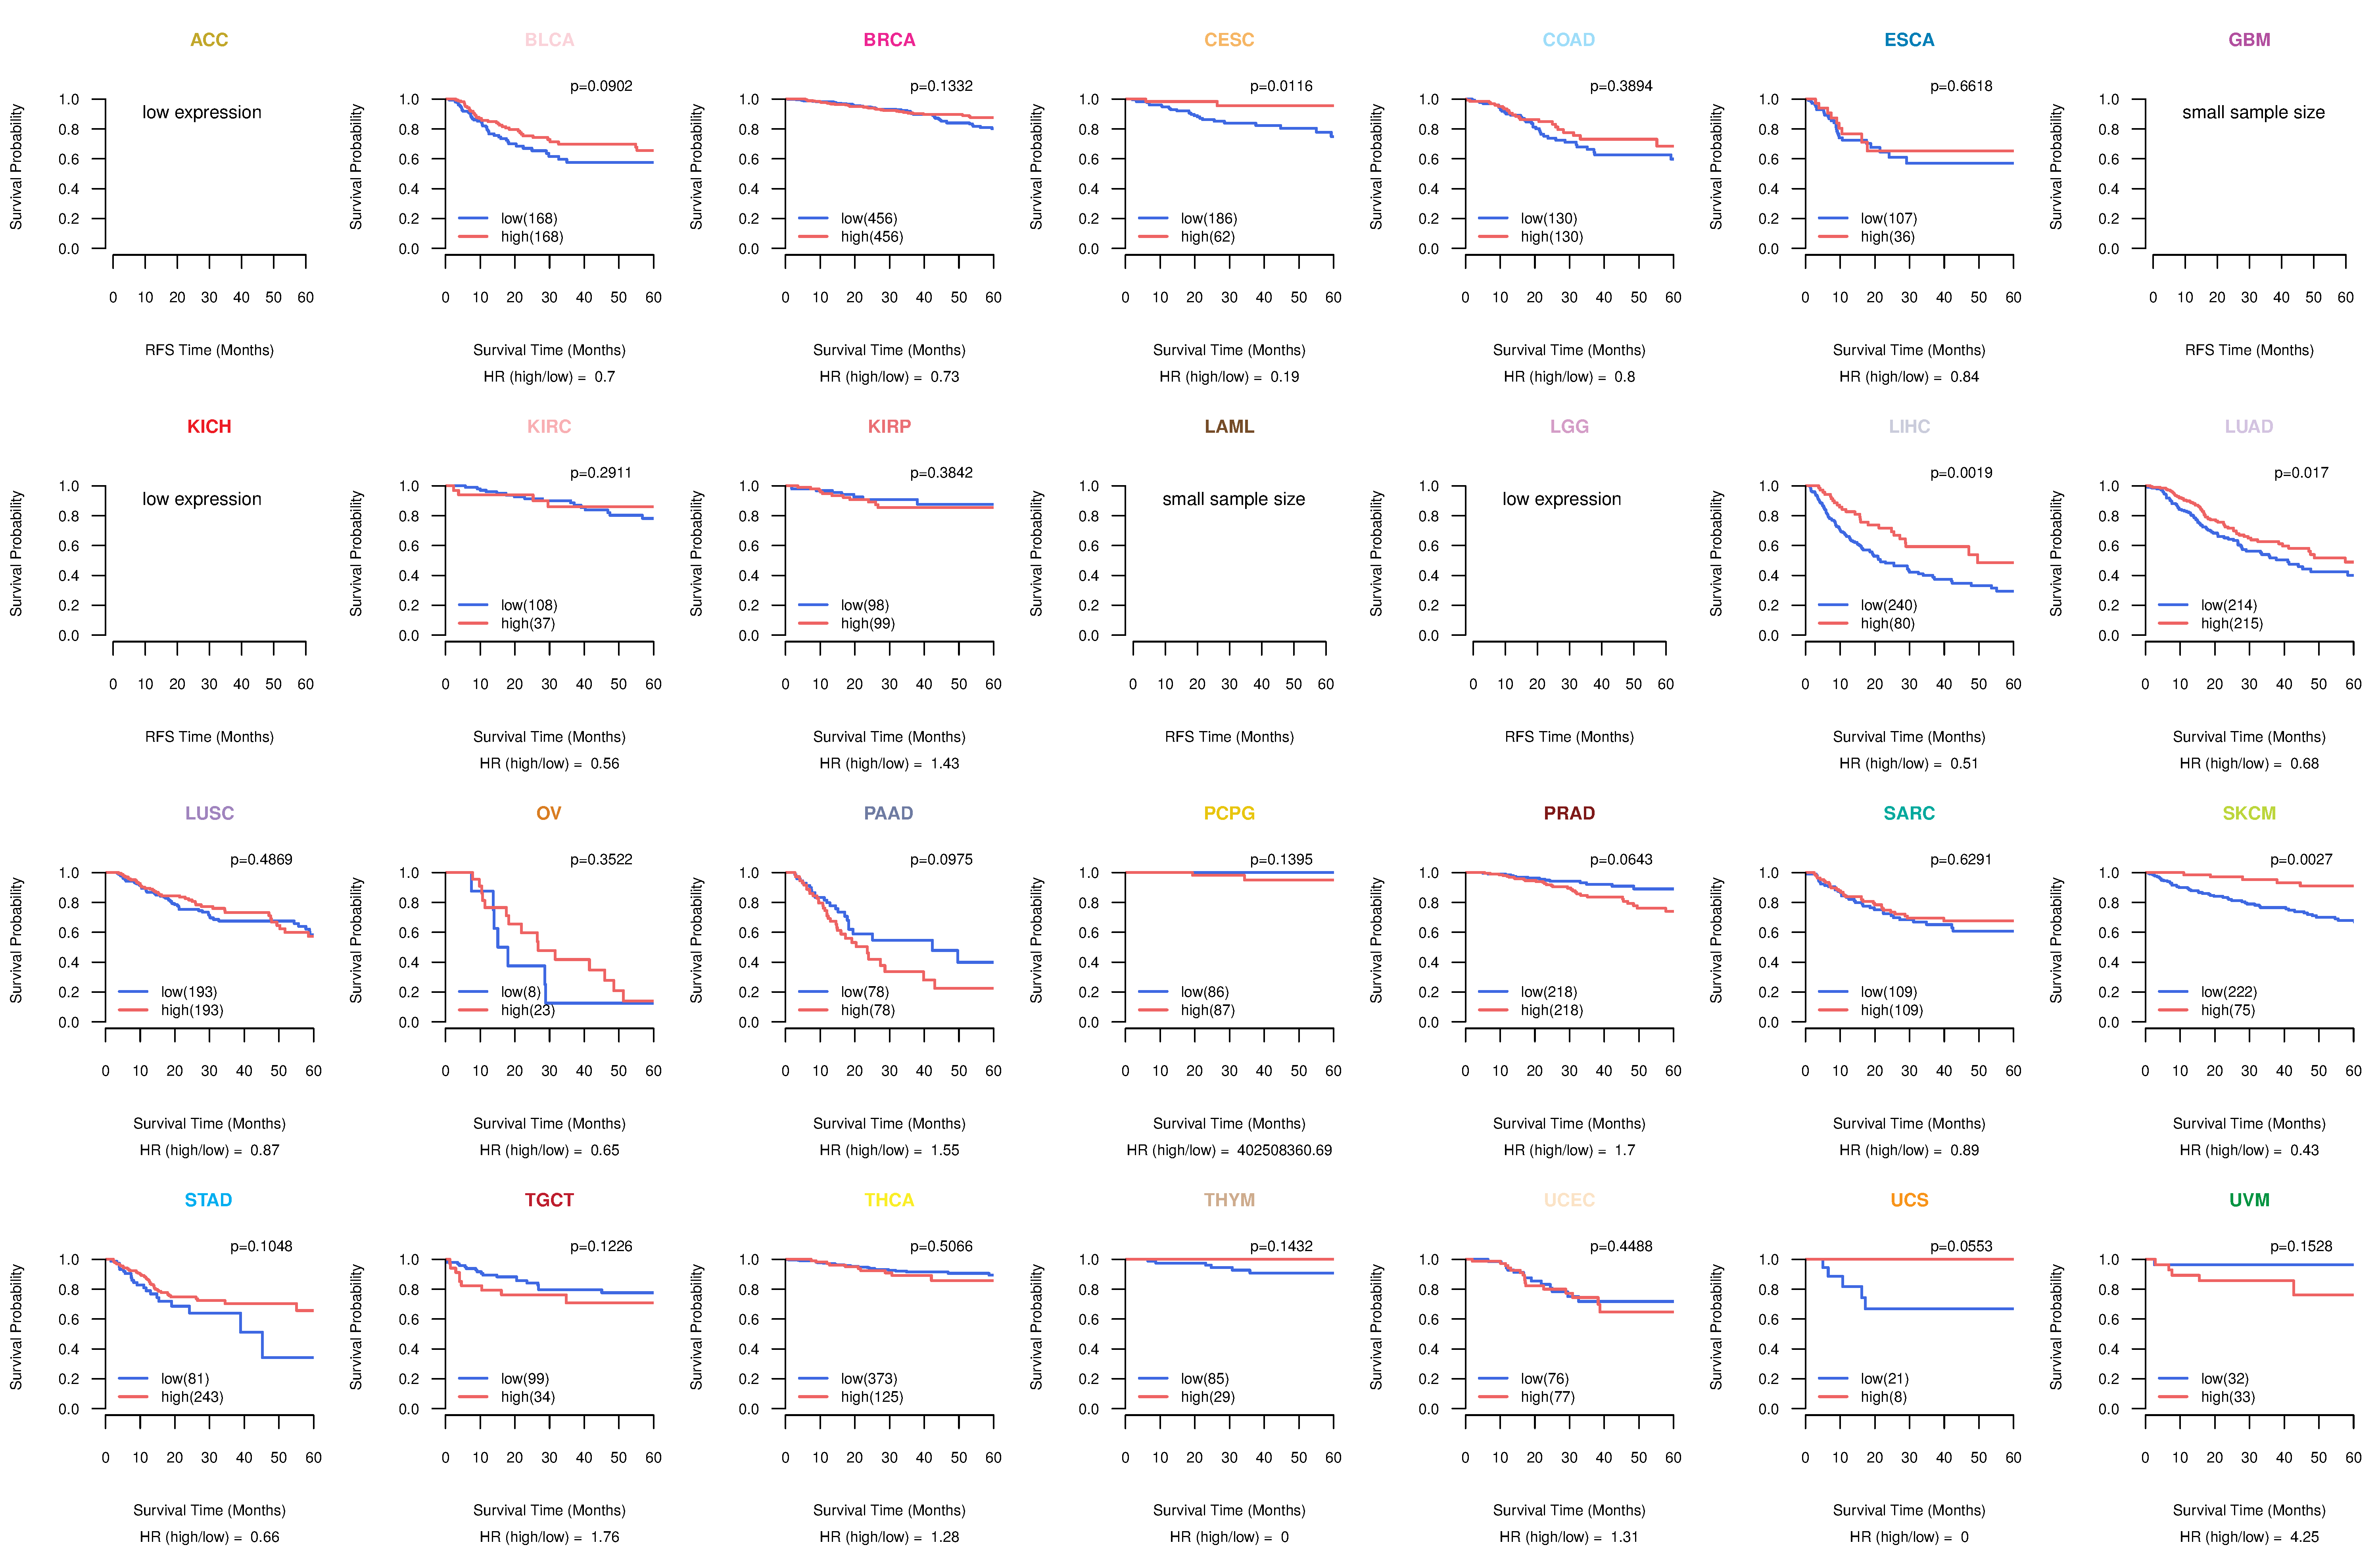
| Kaplan-Meier plots with logrank test of relapse free survival (RFS) using 28 cancer types (TCGA IlluminaHiSeq_RNASeqV2, pan-cancer normalized log2(norm_counts+1) data, version 2016-08-16) (TCGA clinicalMatrix, phenotype data, version 2016-04-27) * Click on the image enlarge it in a new window. |
 |
| Forest plot of Cox proportional hazard ratio (HR) and 95% CI of overall survival (OS) using 28 cancer types (TCGA IlluminaHiSeq_RNASeqV2, pan-cancer normalized log2(norm_counts+1) data, version 2016-08-16) (TCGA clinicalMatrix, phenotype data, version 2016-04-27) * Click on the image enlarge it in a new window. |
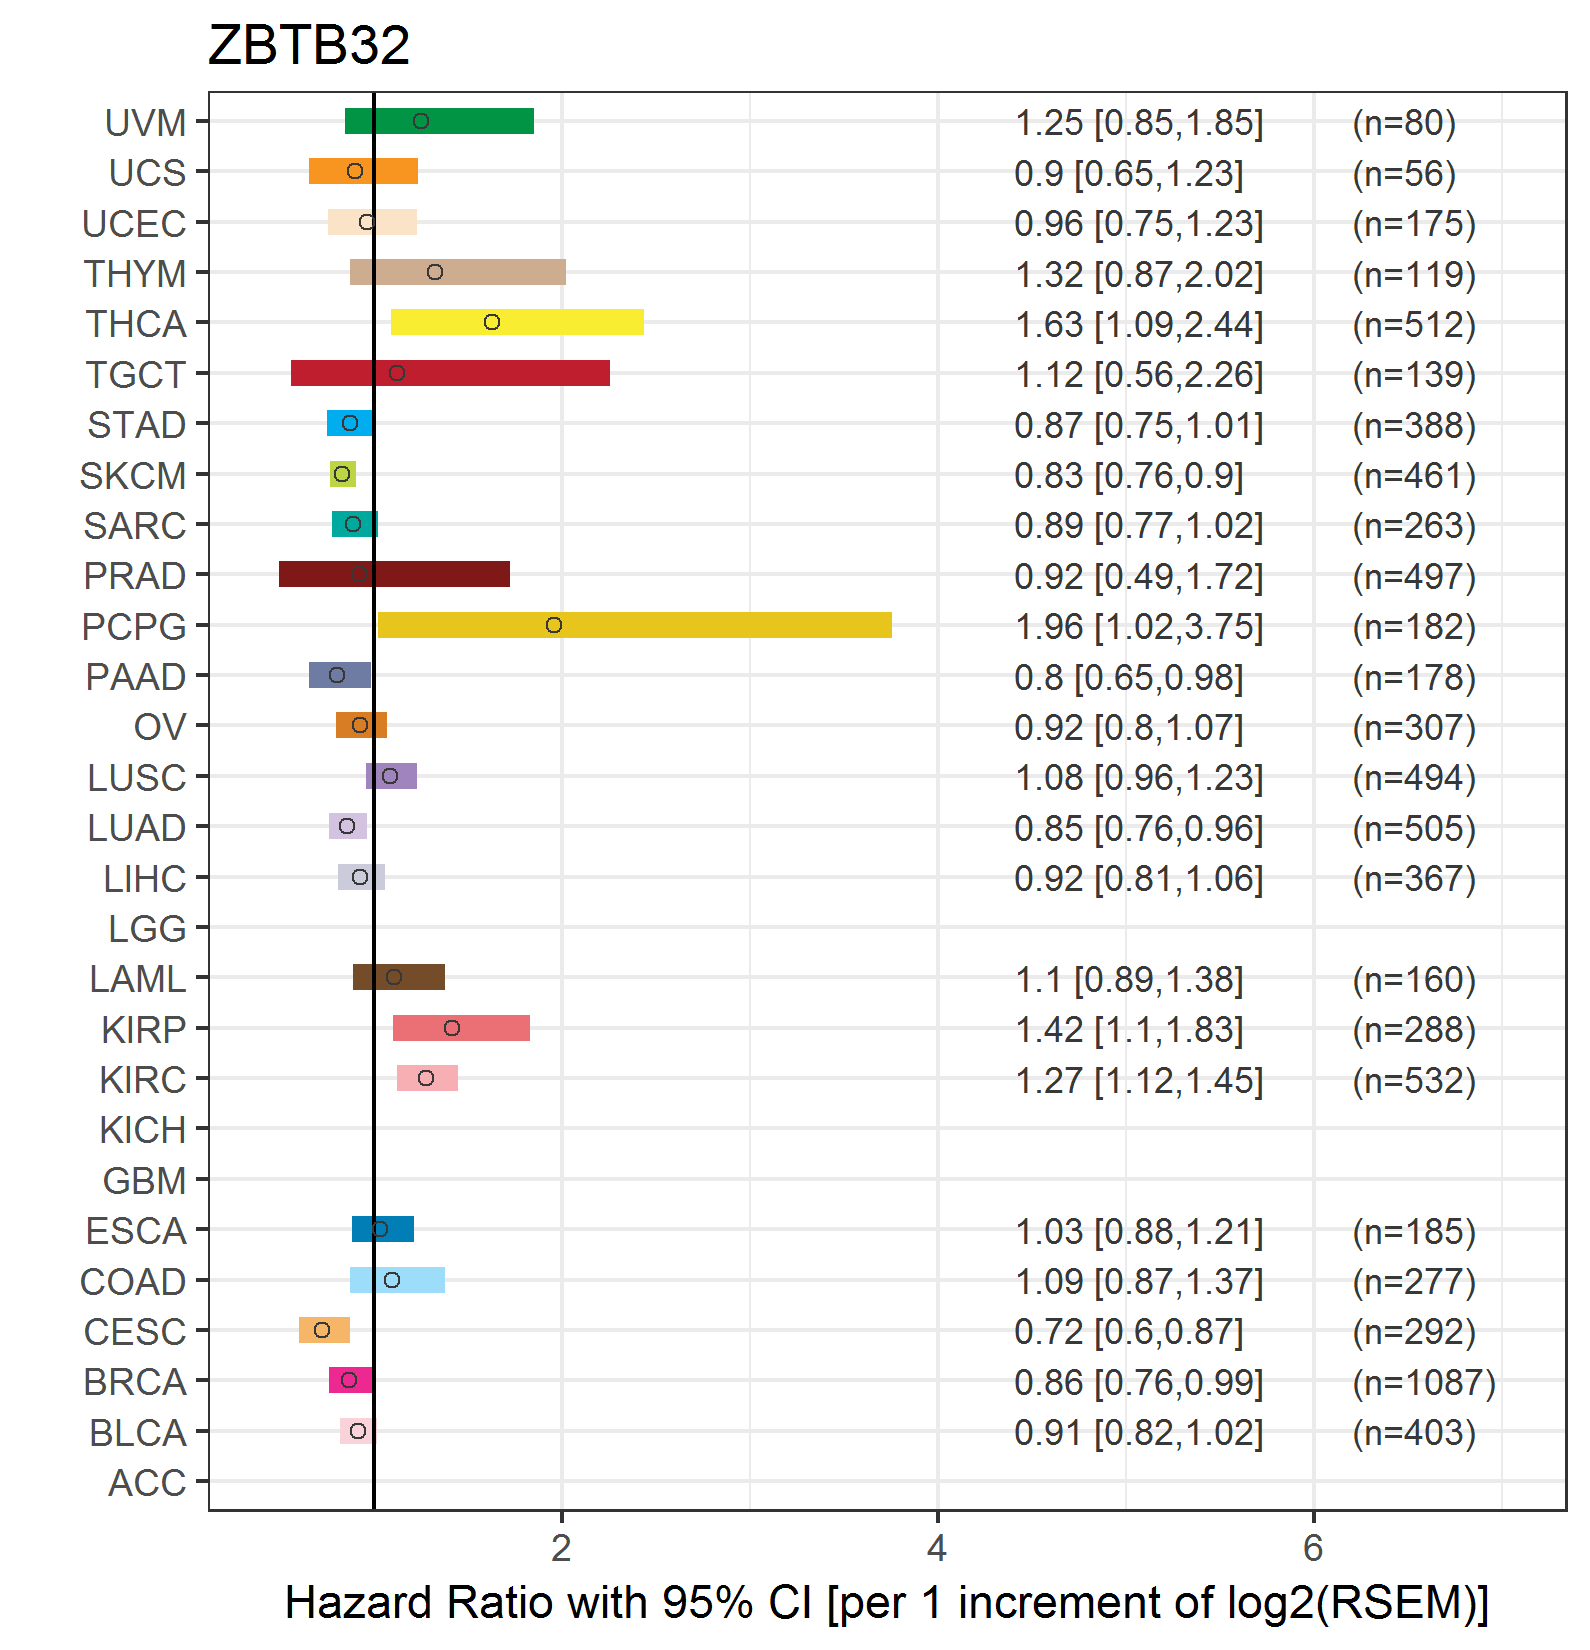 |
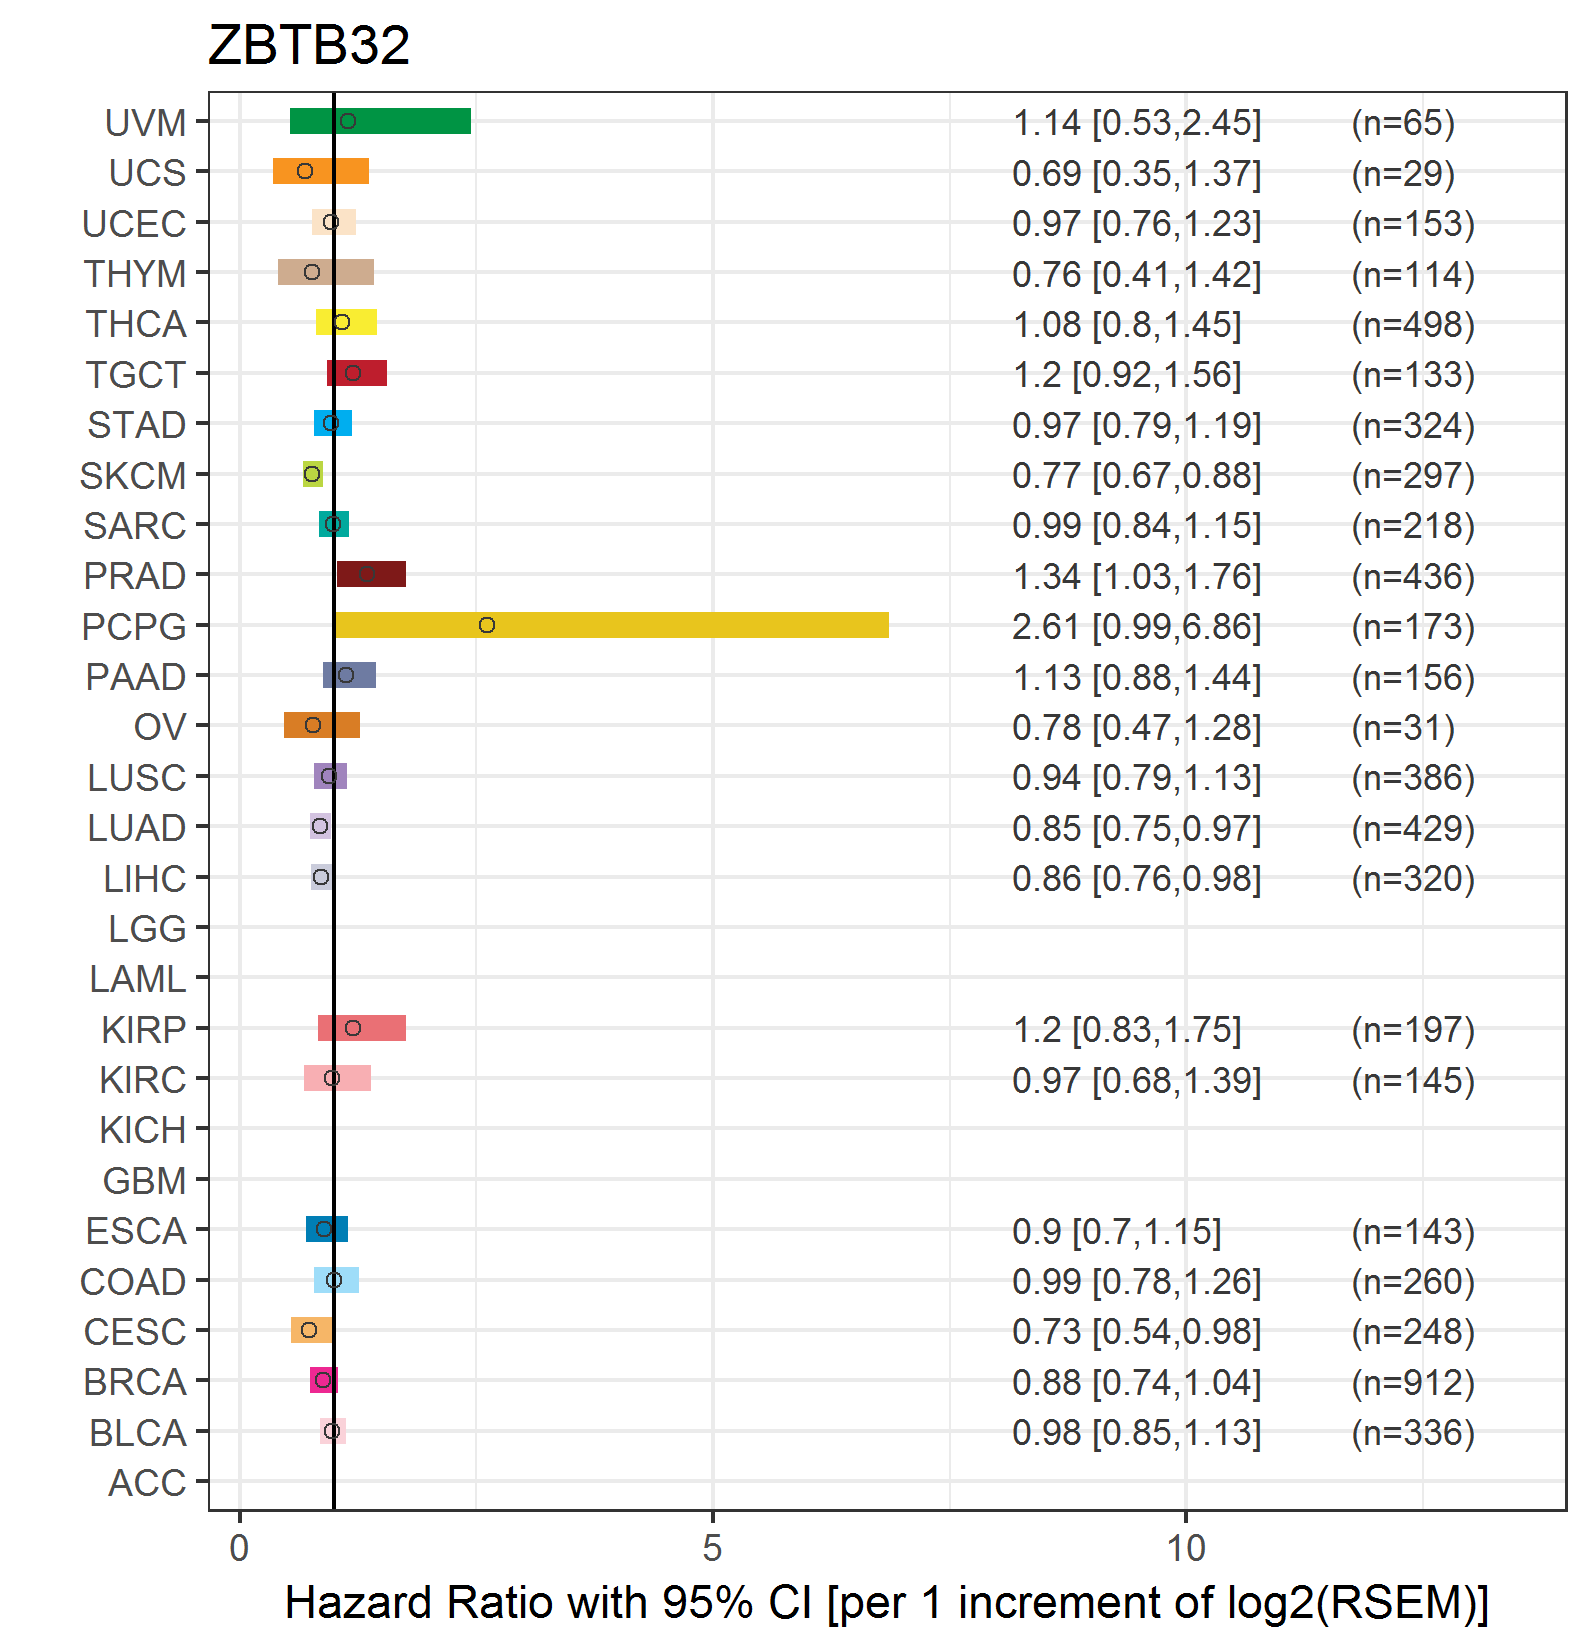
| Forest plot of Cox proportional hazard ratio (HR) and 95% CI of relapse free survival (RFS) using 28 cancer types (TCGA IlluminaHiSeq_RNASeqV2, pan-cancer normalized log2(norm_counts+1) data, version 2016-08-16) (TCGA clinicalMatrix, phenotype data, version 2016-04-27) * Click on the image enlarge it in a new window. |
 |
| Top |
| TissGeneClin for ZBTB32 |
| TissGeneDrug for ZBTB32 |
| Drug information targeting TissGene (DrugBank Version 5.0.6, 2017-04-01) |
| DrugBank ID | Drug name | Drug activity | Drug type | Drug status |
| Top |
| TissGeneDisease for ZBTB32 |
| Disease information associated with TissGene (DisGeNet, 2016-06-01) |
| Disease ID | Disease name | # pubmeds | Source |
| umls:C0015625 | Fanconi Anemia | 2 | BeFree,LHGDN |
| umls:C0006142 | Malignant neoplasm of breast | 1 | BeFree |
| umls:C0023487 | Acute Promyelocytic Leukemia | 1 | BeFree |
| umls:C0079744 | Diffuse Large B-Cell Lymphoma | 1 | BeFree |
| umls:C0278996 | Cancer of Head and Neck | 1 | BeFree |
| umls:C0678222 | Breast Carcinoma | 1 | BeFree |
| umls:C1168401 | Squamous cell carcinoma of the head and neck | 1 | BeFree |
| umls:C2349952 | Oropharyngeal Carcinoma | 1 | BeFree |
| umls:C2745900 | Promyelocytic leukemia | 1 | BeFree |
| umls:C3469521 | FANCONI ANEMIA, COMPLEMENTATION GROUP A (disorder) | 1 | BeFree |
|
Copyright 2016-Present - The University of Texas Health Science Center at Houston (UTHealth) Web File Viewing | How to Report, Fraud, Waste and Abuse | State of Texas | Statewide Search | Texas Homeland Security | Site Policies |