 |
| |
| |
| |
| |
| |
| |
|

| TissGeneSummary for FAM71E2 |
 Gene summary Gene summary |
| Basic gene information | Gene symbol | FAM71E2 |
| Gene name | family with sequence similarity 71, member E2 | |
| Synonyms | C19orf16 | |
| Cytomap | UCSC genome browser: 19q13.42 | |
| Type of gene | protein-coding | |
| RefGenes | NM_001145402.1, | |
| Description | protein FAM71E2putative protein FAM71E2 | |
| Modification date | 20141207 | |
| dbXrefs | HGNC : HGNC | |
| Ensembl : ENSG00000180043 | ||
| Vega : OTTHUMG00000170357 | ||
| Protein | UniProt: go to UniProt's Cross Reference DB Table | |
| Expression | CleanEX: HS_FAM71E2 | |
| BioGPS: 284418 | ||
| Pathway | NCI Pathway Interaction Database: FAM71E2 | |
| KEGG: FAM71E2 | ||
| REACTOME: FAM71E2 | ||
| Pathway Commons: FAM71E2 | ||
| Context | iHOP: FAM71E2 | |
| ligand binding site mutation search in PubMed: FAM71E2 | ||
| UCL Cancer Institute: FAM71E2 | ||
| Assigned class in TissGDB* | C | |
| Included tissue-specific gene expression resources | HPA,GTEx | |
| Specific-tissues in normal samples (assigned by TissGDB using HPA, TiGER, and GTEx) | Testis | |
| Cancer types related to the specific-tissues in cancer samples (assigned by TissGDB using TCGA) | TGCT | |
| Reference showing the relevant tissue of FAM71E2 | ||
| Description by TissGene annotations | ||
| * Class A consists of genes with literature evidence and is part of the cTissGenes. Class B consists of only cTissGenes without additional evidence. The remaining genes belong to Class C. |
| Gene ontology having evidence of Inferred from Direct Assay (IDA) from Entrez |
| GO ID | GO term | PubMed ID |
| Top |
| TissGeneExp for FAM71E2 |
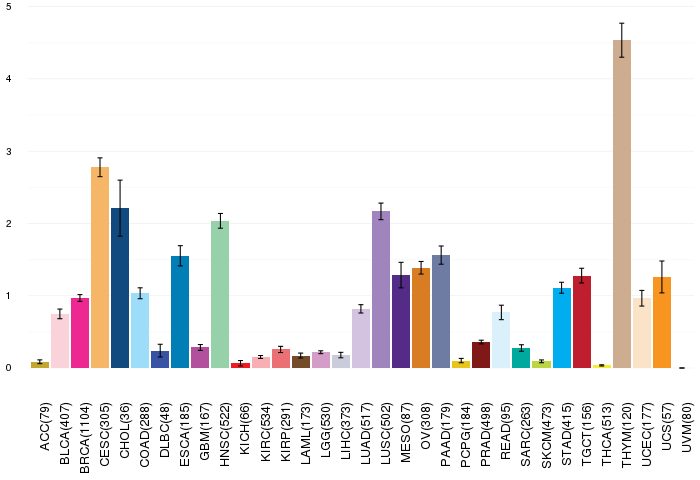
| Gene expressions across 28 cancer types (X-axis: cancer type and Y-axis: log2(norm_counts+1)) (TCGA IlluminaHiSeq_RNASeqV2, pan-cancer normalized log2(norm_counts+1) data, version 2016-08-16) |
 |
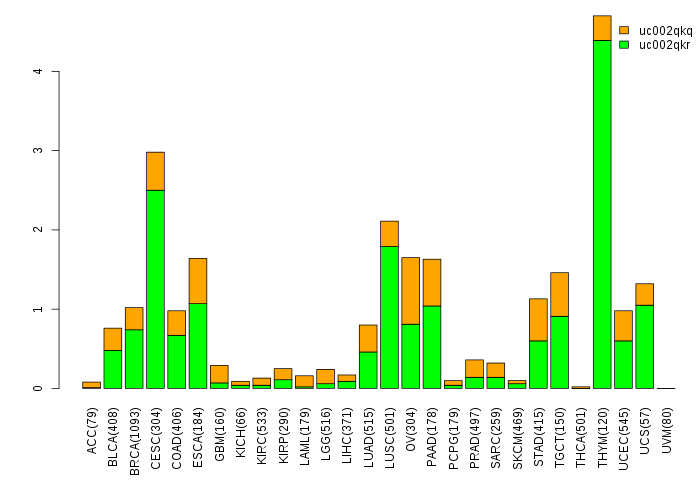
| Gene isoform expressions across 28 cancer types (X-axis: cancer type and Y-axis: log2(norm_counts+1)) (TCGA pan-cancer tcga_rsem_isoform_tpm, version 2016-09-01) |
 |
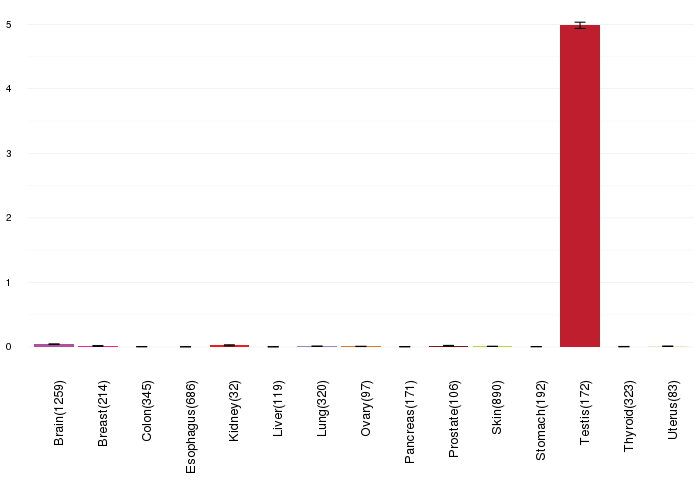
| Gene expressions across normal tissues of GTEx data (GTEx GTEx_Analysis_v6_RNA-seq_RNA-SeQCv1.1.8_gene_rpkm.gct) - Here, we shows the matched tissue types only among our 28 cancer types. |
 |
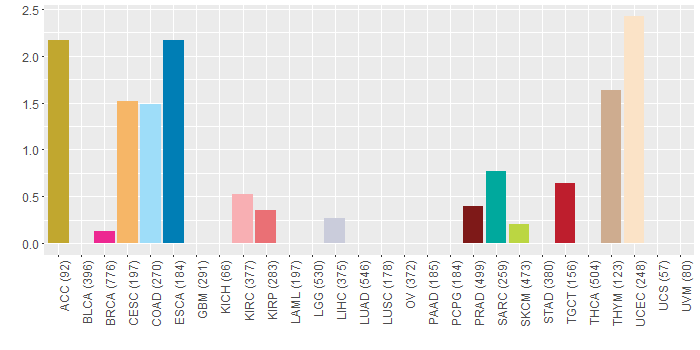
| Different expressions across 14 cancer types with more than 10 samples between matched tumors and normals (X-axis: cancer type and Y-axis: log2(norm_counts+1)) (TCGA IlluminaHiSeq_RNASeqV2, pan-cancer normalized log2(norm_counts+1) data, version 2016-08-16) |
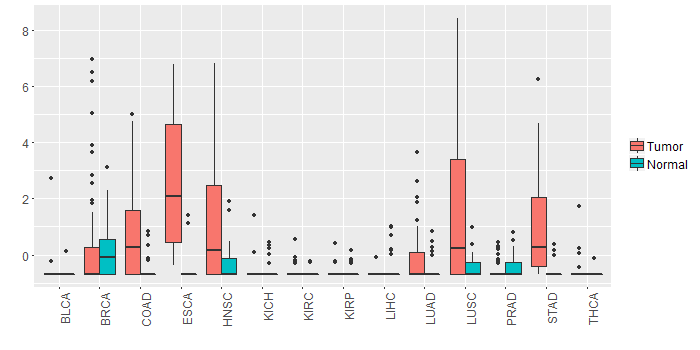 |
| - Significantly differentially expressed cancer types and information. (|Fold change|>1 and FDR<0.05) |
| Cancer type | Mean(exp) in tumor | Mean(exp) in matched normal | Log2FC | P-val. | FDR |
| LUSC | 1.523723199 | -0.486568958 | 2.010292157 | 7.43E-07 | 1.89E-06 |
| ESCA | 2.678669723 | -0.327693913 | 3.006363636 | 0.00319 | 0.030028692 |
| COAD | 0.808010982 | -0.471631326 | 1.279642308 | 0.000836 | 0.002454623 |
| HNSC | 1.124032091 | -0.35477256 | 1.478804651 | 4.61E-05 | 0.000224513 |
| STAD | 1.024831655 | -0.604705845 | 1.6295375 | 1.59E-05 | 0.000167883 |
| Top |
| TissGene-miRNA for FAM71E2 |
| Significantly anti-correlated miRNAs of TissGene across 28 cancer types (Gene-miRNA relations from TargetScanHuman Relsease 7.1, Conserved_Site_Context_Scores.txt.zip, 06.01.2016) (TCGA IlluminaHiSeq_miRNASeq, log2(RPM+1) data, version 2016-11-21) (TCGA IlluminaHiSeq_RNASeqV2, log2(normalized_count+1) data, version 2016-08-16) (Spearman’s Rank Correlation (p-value<0.05 and coefficient<-0.25)) |
| Cancer type | miRNA id | miRNA accession | P-val. | Coeff. | # samples |
| Top |
| TissGeneMut for FAM71E2 |
| TissGeneSNV for FAM71E2 |
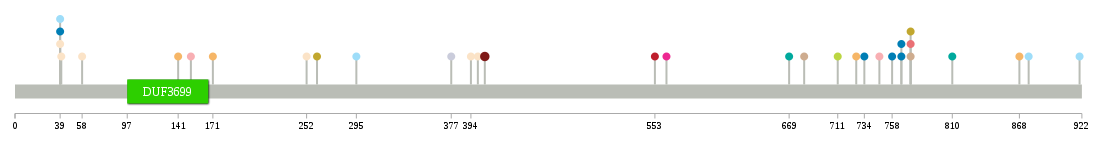
| nsSNV counts per each loci. Different colors of circles represent different cancer types. Circle size denotes number of samples. (TCGA somatic mutation (SNPs and small INDELs) data, version 2016-04-25) * Click on the image to enlarge it in a new window. |
 |
 |
| Somatic nucleotide variants of TissGene across 28 cancer types (X-axis: cancer type and Y-axis: % of mutated samples) The numbers in parentheses are numbers of samples with mutation (nsSNVs). (TCGA somatic mutation (SNPs and small INDELs) data, version 2016-04-25) |
 |
| - nsSNVs sorted by frequency. |
| AAchange | Cancer type | # samples |
| p.L406P | PRAD | 2 |
| p.E774K | ACC | 1 |
| p.Q500P | MESO | 1 |
| p.A920V | COAD | 1 |
| p.T868I | CESC | 1 |
| p.A171G | CESC | 1 |
| p.D261N | ACC | 1 |
| p.R39H | ESCA | 1 |
| p.K766X | ESCA | 1 |
| p.Q400H | UCEC | 1 |
| p.P553L | TGCT | 1 |
| p.L747F | KIRC | 1 |
| p.L152F | KIRC | 1 |
| p.Q758H | ESCA | 1 |
| p.G682D | THYM | 1 |
| p.E774K | KIRP | 1 |
| p.L876I | COAD | 1 |
| p.S377Y | LIHC | 1 |
| p.E810K | SARC | 1 |
| p.M734V | ESCA | 1 |
| p.E774K | THYM | 1 |
| p.P295S | COAD | 1 |
| p.R39C | UCEC | 1 |
| p.D563Y | BRCA | 1 |
| p.R39H | COAD | 1 |
| p.V58M | UCEC | 1 |
| p.P727S | CESC | 1 |
| p.P40L | UCEC | 1 |
| p.K252N | UCEC | 1 |
| p.R259H | READ | 1 |
| p.P394L | UCEC | 1 |
| p.K766* | ESCA | 1 |
| p.R669Q | SARC | 1 |
| p.P711R | SKCM | 1 |
| p.E141Q | CESC | 1 |
| Top |
| TissGeneCNV for FAM71E2 |
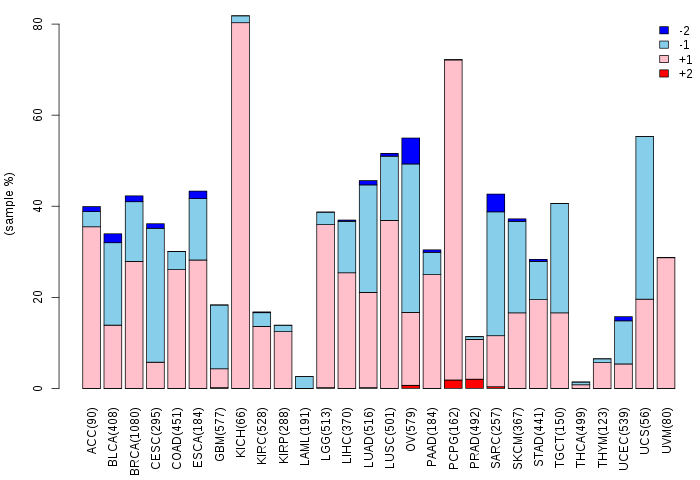
| Copy number variations of TissGene across 28 cancer types (X-axis: cancer type and Y-axis: % of CNV samples) (TCGA Gistic2_CopyNumber_Gistic2_all_data_by_genes, Gistic2 copy number data, version 2016-08-16) |
 |
| Top |
| TissGeneFusions for FAM71E2 |
| Fusion genes including TissGene (ChimerDB 3.0, 2016-12-01 and TCGA fusion Portal 2015-12-01) |
| Database | Src | Cancer type | Sample | Fusion gene | ORF | 5'-gene BP | 3'-gene BP |
| Top |
| TissGeneNet for FAM71E2 |
| Co-expressed gene networks based on protein-protein interaction data (CePIN) (TCGA IlluminaHiSeq_RNASeqV2, pan-cancer normalized log2(norm_counts+1) data, version 2016-08-16) (PINA2 ppi data) |
| Top |
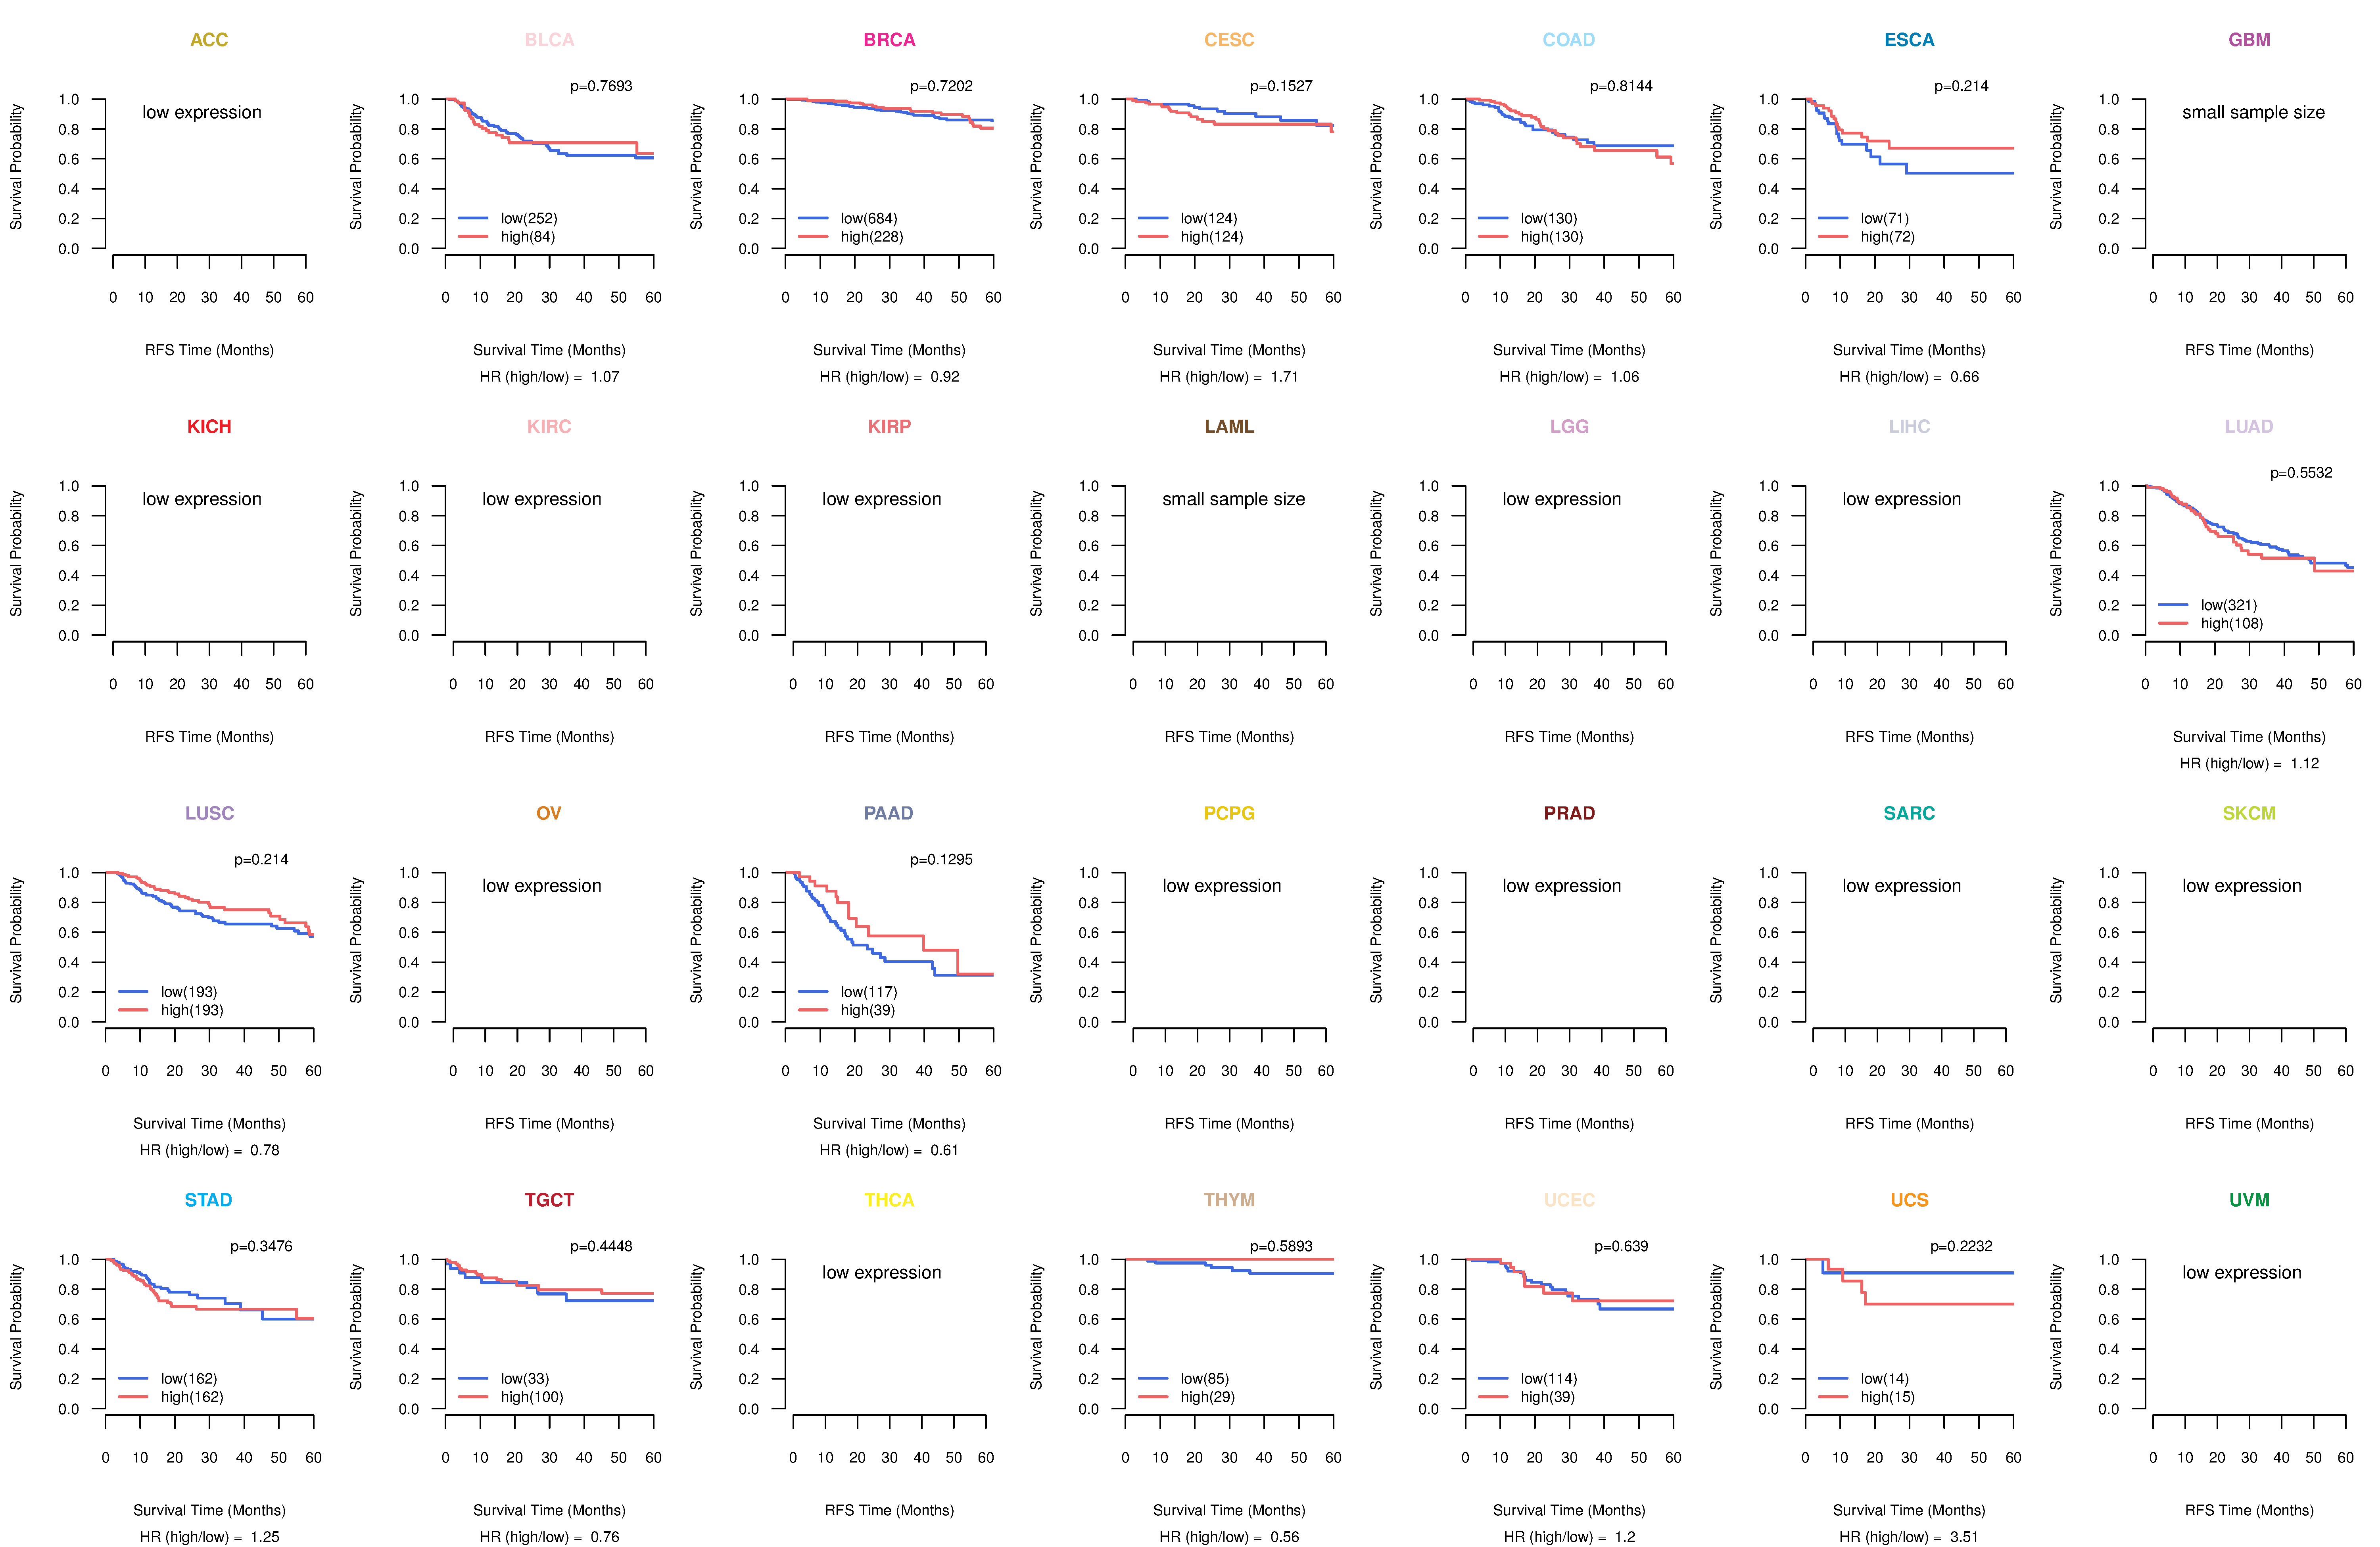
| TissGeneProg for FAM71E2 |
| Kaplan-Meier plots with logrank tests of overall survival (OS) using 28 cancer types (TCGA IlluminaHiSeq_RNASeqV2, pan-cancer normalized log2(norm_counts+1) data, version 2016-08-16) (TCGA clinicalMatrix, phenotype data, version 2016-04-27) * Click on the image to enlarge it in a new window. |
 |
| Kaplan-Meier plots with logrank test of relapse free survival (RFS) using 28 cancer types (TCGA IlluminaHiSeq_RNASeqV2, pan-cancer normalized log2(norm_counts+1) data, version 2016-08-16) (TCGA clinicalMatrix, phenotype data, version 2016-04-27) * Click on the image enlarge it in a new window. |
 |
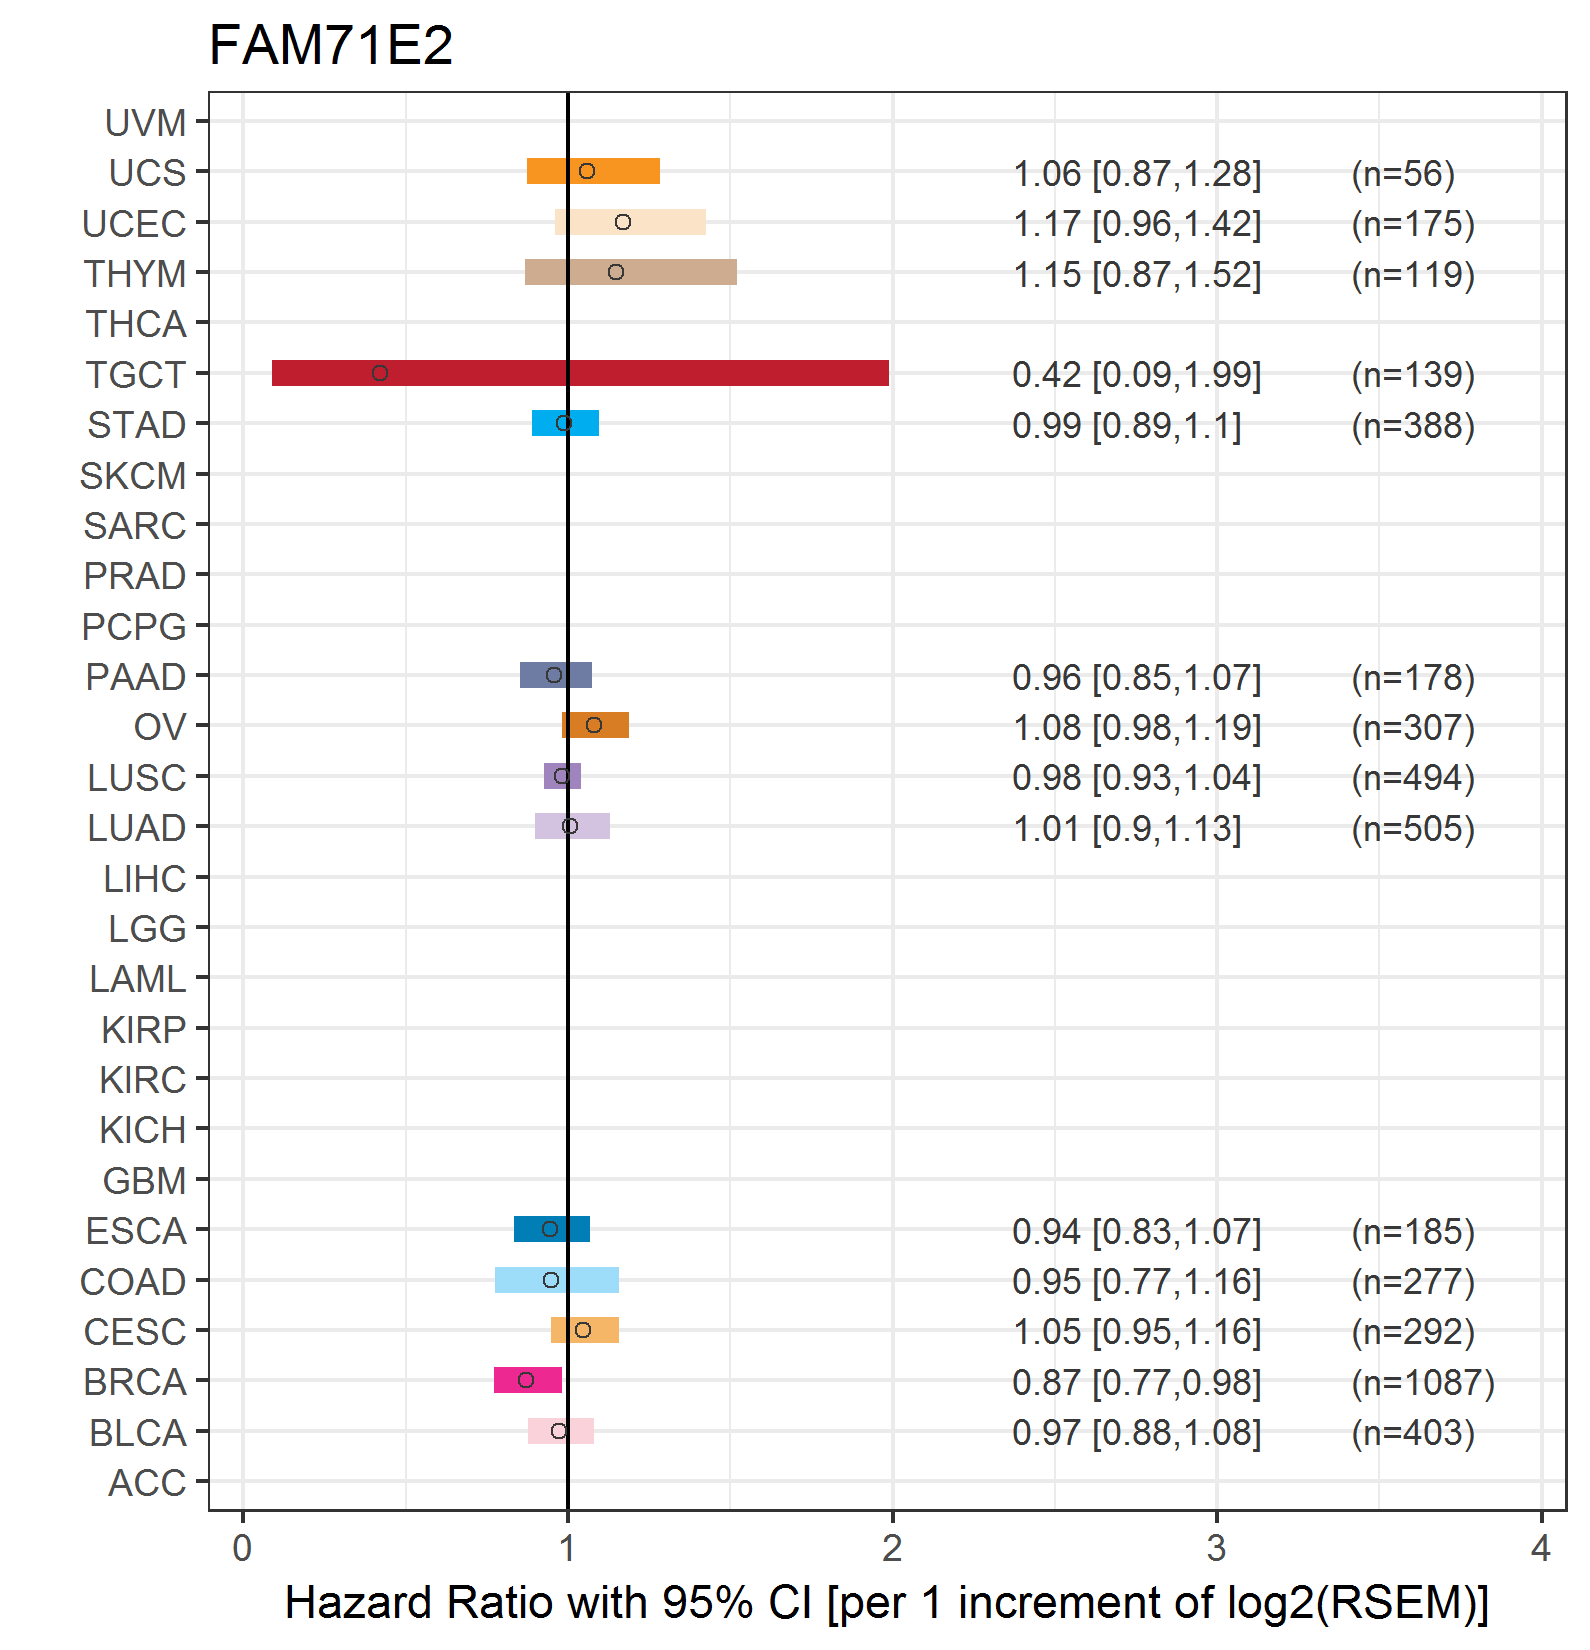
| Forest plot of Cox proportional hazard ratio (HR) and 95% CI of overall survival (OS) using 28 cancer types (TCGA IlluminaHiSeq_RNASeqV2, pan-cancer normalized log2(norm_counts+1) data, version 2016-08-16) (TCGA clinicalMatrix, phenotype data, version 2016-04-27) * Click on the image enlarge it in a new window. |
 |
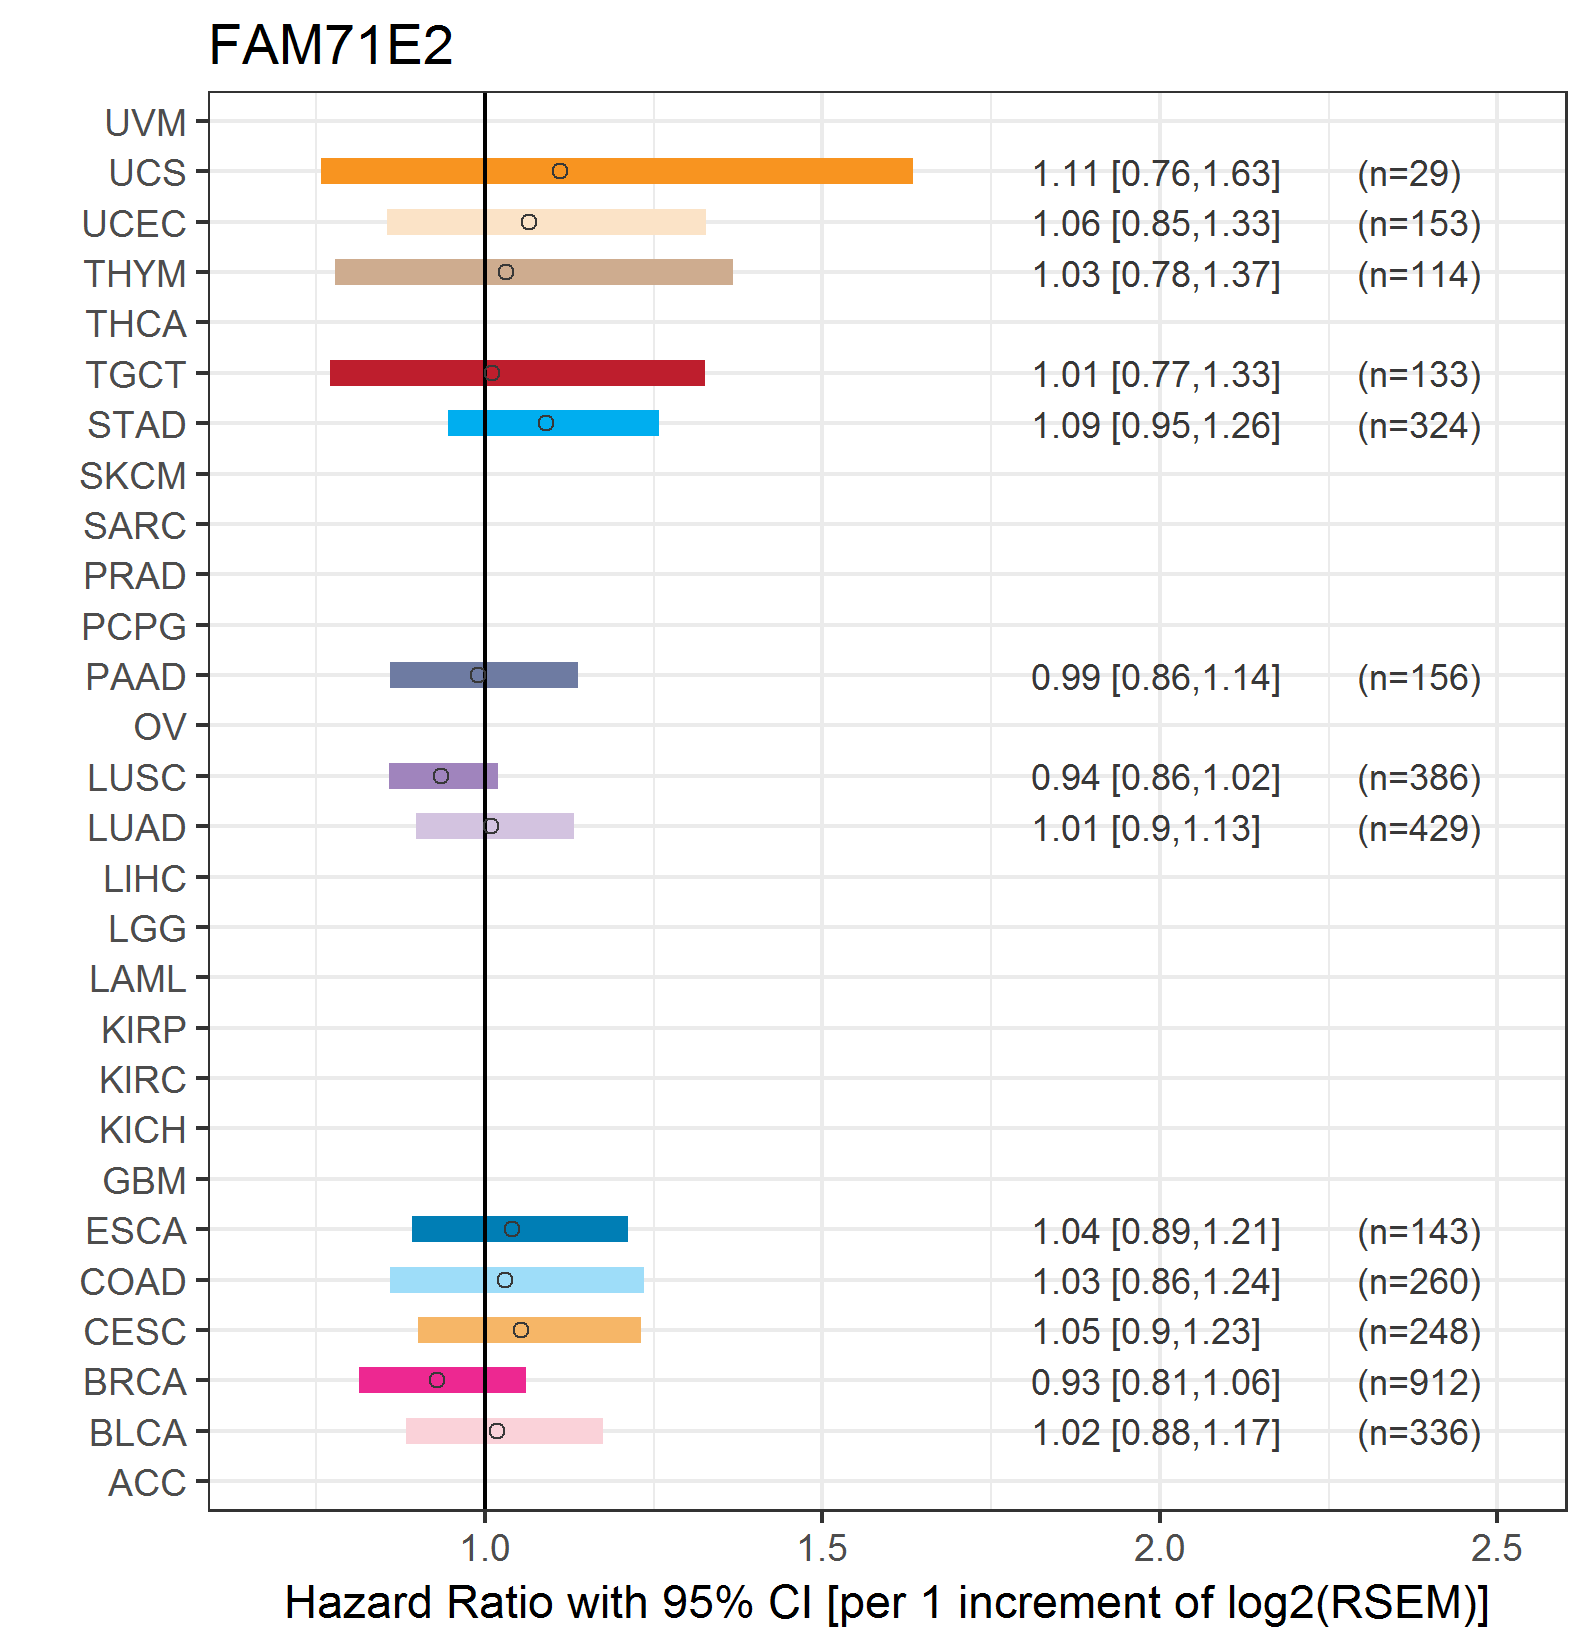
| Forest plot of Cox proportional hazard ratio (HR) and 95% CI of relapse free survival (RFS) using 28 cancer types (TCGA IlluminaHiSeq_RNASeqV2, pan-cancer normalized log2(norm_counts+1) data, version 2016-08-16) (TCGA clinicalMatrix, phenotype data, version 2016-04-27) * Click on the image enlarge it in a new window. |
 |
| Top |
| TissGeneClin for FAM71E2 |
| TissGeneDrug for FAM71E2 |
| Drug information targeting TissGene (DrugBank Version 5.0.6, 2017-04-01) |
| DrugBank ID | Drug name | Drug activity | Drug type | Drug status |
| Top |
| TissGeneDisease for FAM71E2 |
| Disease information associated with TissGene (DisGeNet, 2016-06-01) |
| Disease ID | Disease name | # pubmeds | Source |
|
Copyright 2016-Present - The University of Texas Health Science Center at Houston (UTHealth) Web File Viewing | How to Report, Fraud, Waste and Abuse | State of Texas | Statewide Search | Texas Homeland Security | Site Policies |